South Asian countries are facing an epidemic of non-communicable diseases including Type 2 Diabetes and Cardiovascular Diseases (CVD) [1]. Individuals with type 2 diabetes (T2DM) have two to four-fold increased risk of Cardiovascular Disease (CVD) than the non-diabetic individuals [2,3]. Estimation of cardiovascular risk in asymptomatic individuals and their referral for necessary preventive interventions is an important measure to reduce CVD morbidity and mortality [4].
Assessment of CVD risk is usually carried out by looking for measureable risk markers such as age, gender, total cholesterol level, systolic blood pressure and smoking status and then uses these markers to calculate the ten year risk of a vascular event as a percentage probability. Ten-year risk estimates may serve not only as a basis for decision making about institution of various preventive therapy but also as a useful means for risk communication with patients. Framingham Risk Score (FRS), United Kingdom Prospective Diabetes Study (UKPDS) risk engine and the risk score developed by the World Health Organization (WHO) are three widely used cardiovascular risk assessment tools in clinical and epidemiological research. The first two assessment tools are derived from, data from the Framingham and UKPDS studies which predominantly included Caucasian population [5,6]. WHO risk score is derived from data collected in few cohorts in developing countries including Asia and it is primarily meant to be used in resource poor setting [7]. As these risk assessment tools are developed using data of patients in different ethnic settings, their global applicability may be limited. Number of studies have shown that even in the correct setting these risk scores can either underestimate or overestimate the real cardiac risk [8,9]. A study conducted in multi-ethnic population in the United Kingdom has revealed that FRS underestimated the CVD risk in South Asian females [10]. Another study among the high-risk South Asians revealed that FRS could categorise only 5% of the population into the high CVD risk (>20%) category [11]. Although the WHO risk charts are developed for most regions of the world, only few studies have reported its performance in resource poor setting in developing countries.
Even though the accuracy of risk prediction tools should be assessed by observing cardiac events over many years, it may not be practical. Since Carotid Intima-Media Thickness (CIMT) has been shown to predict Cardiovascular (CV) events in multiple large studies, ability of the risk prediction tools to predict CIMT can be used to assess the accuracy of these tools [12] . The amount of lesion in the Common Carotid Artery (CCA) has been reported to correlate to the extent of atherosclerotic lesions elsewhere in the body including the heart. Several large, research-based cohort studies have clearly indicated a relationship between CIMT and CV events [13].
We aimed to study the associations between CIMT and the CVD risk estimates obtained using the three risk assessment tools in a cohort of patients with diabetes mellitus.
Materials and Methods
The present work was undertaken at Department of Medicine, Faculty of Medicine, University of Ruhuna, Sri Lanka during the period from January 2014 to January 2015. The study subjects were selected from a community-derived sample of patients with Type 2 Diabetes Mellitus. Patients were excluded if they had any previous history of ischaemic stroke, hypertension, familial hyperlipidaemia, history of angina, myocardial infarction, angioplasty, congestive heart failure, atrial fibrillation, coronary artery bypass, carotid or peripheral vascular surgery, or renal insufficiency. Sixty eight patients fulfilled inclusion criteria for the study. Patients receiving oral hypoglycaemic agents, antihypertensive, and antiplatelet agents were not excluded from the study.
The study protocol was approved by the Ethics Review Committee (ERC) of Faculty of Medicine, University of Ruhuna and written informed consent was obtained from all participants.
Data Collection and Risk Factor Definition
Information on demographic characteristics and risk factors was collected using a pre-tested structured questionnaire. Blood pressure was measured in a sitting position, and hypertension treatment at admission was recorded. Hypertension was defined as having systolic blood pressure ≥ 140mmHg or diastolic blood pressure ≥ 90mmHg on two or more occasions or having treatment for hypertension. Blood was drawn in the morning from fasting subjects for blood sugar and lipid profile determination. Low-Density Lipoprotein (LDL) cholesterol was calculated by the Friedewald formula. Subjects were classified as diabetic when their fasting blood sugar values were ≥126 mg/dL, or post prandial blood sugar ≥ 200 mg/dL and/ or on treatment for diabetes with medications.
CIMT Measurement
Carotid ultrasonography studies were performed uniformly on all patients by a single radiologist who was blinded to the CVD risk scores of study subjects. Ultrasonography was performed with B-mode images of a high-resolution ultrasound scanner equipped with a 7 MHz linear array transducer. Anterior, antero-lateral, and postero-lateral projections were used to obtain images of the left and right common and internal carotid arteries. CIMT was measured according to the standard protocol and the presence of carotid plaques were documented at the same time.
CVD Risk Assessment
CVD risk scores according to the FRS, UKPDS risk engine and WHO system were calculated separately using the information on clinical and laboratory findings. The correlations between each risk score with CIMT were estimated using Pearson’s correlation and p-value of <0.05 was considered as statistically significant.
Statistical Analysis
While all qualitative variables were presented in frequency or percentages, all quantitative variables were presented in the form of mean and standard deviation (SD). T-tests and chi-square tests were performed to compare the differences in groups. Pearson correlation analyses were used to evaluate associations between CIMT and CVD risk score detected by three risk scores. CIMT was log transformed as it was not normally distributed. All analyses were two-tailed and <0.05 was considered statistically significant. Statistical analyses were performed using the SPSS version 18.0.
Results
There were 68 patients (50%males) with mean (SD) age 56.6 (±9.6) years, mean age at diagnosis 44.2 (±9) years and mean duration of diabetes was 12.2 (±7.6) years [Table/Fig-1]. The mean HbA1c was 7.3%. Of the total 66% and 90% of study participants were on anti-hypertensive and lipid lowering therapy respectively.
Characteristics of study sample.
| Variable | Mean (+SD) |
|---|
| Age (years) | 56.59 (±9.63) |
| Age at diagnosis (years) | 44.26 (±9.01) |
| BMI (Kg / m 2) | 24.33 (±3.23) |
| Duration (years) | 12.16 (± 7.66) |
| HbA1C (%) | 07.30 (±0.77) |
SD – Standard Deviation, HbA1c-Glycated haemoglobin, LDL – Low Density Lipoprotein, TG-Triglyceride.
[Table/Fig-2] shows the correlation between CIMT and different variables. Among all variables CIMT had significant and positive association with duration of T2DM and HbA1c level. The other variables too showed positive association even though they did not reach the statistical significance.
Correlation between CIMT with different variables including age, duration of T2DM, HbA1c, total cholesterol, LDL, and TG.
| Variable | r value | p-value |
|---|
| Age | 0.149 | 0.083 |
| Duration of T2DM | 0.194 | 0.041* |
| BMI | 0.097 | 0.450 |
| HbA1c | 0.284 | 0.027* |
| Total cholesterol | 0.065 | 0.596 |
| LDL | 0.138 | 0.265 |
| TG | 0.028 | 0.824 |
*p-value is significant at <0.05, CIMT - Carotid Artery Intima Media Thickness, T2DM-Type 2 Diabetes Mellitus, HbA1c-Glycated Haemoglobin, LDL – Low Density Lipoprotein, TG-Triglyceride.
As shown in [Table/Fig-3], the WHO risk score categorised considerably higher proportion (97%) of patient into low cardiac risk (<10%) whereas, both FRS and UKPDS risk scores categorised lower proportions into low risk category.
Percentages of study subjects in each risk category according to three risk estimation tools.
| <10% | 10%-20% | 21%-30% | >30% |
|---|
| WHO | 97.1% | 00 % | 1.5% | 1.5% |
| FRS | 36.76% | 38.25% | 16.17% | 8.82% |
| UKPDS | 54.41% | 35.29% | 4.41% | 5.88% |
FRS-Framingham risk score, UKPDS- United Kingdom Prospective Diabetes Study risk engine, WHO -World Health Organization
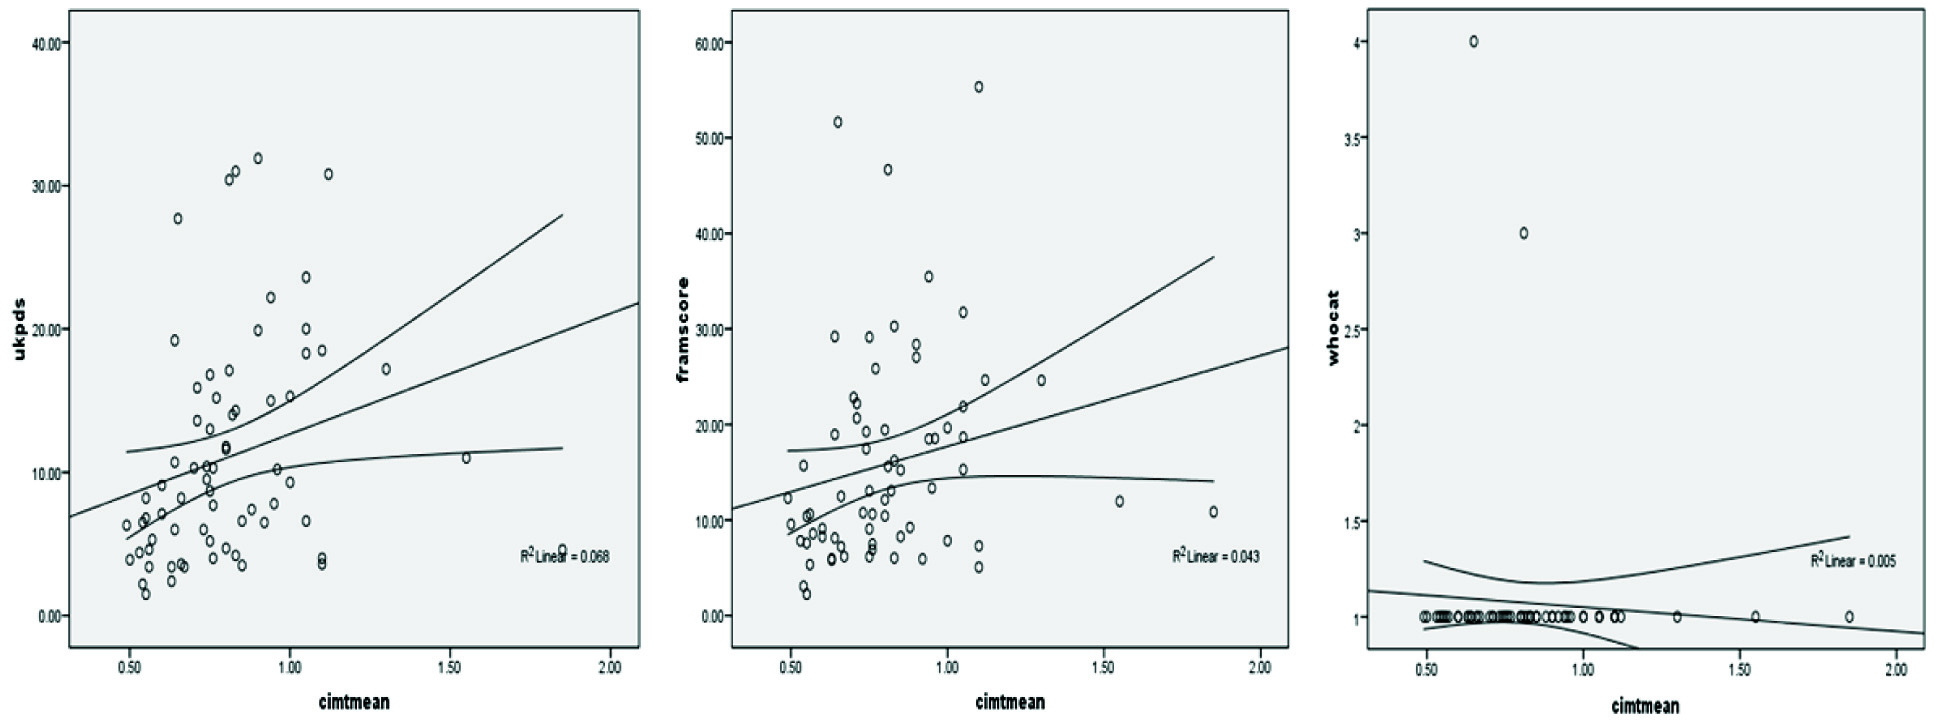
Twelve of the 68 (17%) patients had ultrasonically detectable carotid plaques. Out of the three CVD risk estimation tools, UKPDS risk score revealed a weakly positive but significant correlation with CIMT (r=0.26, p=0.03). FRS also had weakly positive but statistically non-significant association (r=0.2, p=0.08) and WHO risk score had non-significant negative association (r=-0.06, p=0.5) with CIMT. [Table/Fig-4] shows the association of FRS, WHO, UKPDS scores with CIMT.
Scatter plots showing the association of FRS, WHO and UKPDS scores with CIMT.
FRS-Framingham Risk Score, UKPDS- United Kingdom Prospective Diabetes Study risk engine, WHO-World Health Organization, CIMT -carotid artery intima media thickness
In order to find the degree of agreement of CVD risk estimates into low or high category (< 10% and > 10%) obtained from each screening tool, we calculated Cohen’s kappa value and found that FRS and UKPDS risk estimates have moderate degree of agreements and WHO tool has poor degree of agreements with both FRS and UKPDS, with a kappa value of 0.5 and 0.04, 0.02 respectively [Table/Fig-5].
Agreement of different risk factor combinations.
| Kappa value | Asymp. SE | Approx. Sig. |
|---|
| FRS and UKPDS | 0.540 | 0.095 | 0.000 |
| WHO and UKPDS | 0.070 | 0.048 | 0.117 |
| WHO and FRS | 0.035 | 0.025 | 0.274 |
FRS-Framingham risk score, UKPDS- United Kingdom Prospective Diabetes Study risk engine, WHO -World Health Organization.
Discussion
Rising incidence of CVD in the developing countries has necessitated adoption of primary prevention approaches aimed at controlling risk factors to reduce cardiovascular morbidity and mortality. This approach needs sensitive and cost-effective screening tools to identify asymptomatic individuals with higher risk and/or subclinical CVD in the community. Different risk scoring systems have been developed for this purpose. However, due to marked variations in risk profiles due to difference in culture and lifestyle, these risk scores cannot be applied to all ethnic groups equally. Furthermore, studies have found that the most CVD risk scores, which were developed mainly for Caucasians, underestimate the cardiac risk among South Asians. Even though WHO risk score for South Asia is derived from locally collected data, it has not been tested on its ability to detect subclinical atherosclerosis among patients with T2DM in Sri Lanka.
Findings of this study revealed that FRS and UKPDS risk engines are better CVD screening tools to detect subclinical atherosclerosis than the WHO risk score in a cohort of Sri Lankan patients with T2DM. Ability of a CVD risk scoring tool to detect individuals with high risk of CVD in a given setting depends on several factors. Out of them, variables (risk factors) used in each tool to calculate CVD risk and the relative weightage given to each of them are important. Three CVD risk screening tools compared in this study differ in the variables included in them. Age, gender, smoking status and systolic blood pressure are common to all three tools but the UKPDS risk engine in addition include ethnicity, duration of diabetes, glycosylated haemoglobin level and the FRS include high density cholesterol level. Findings of this study revealed that inclusion of additional parameters have improved the detection rates of individuals at all cut-off levels in both FRS and UKPDS tools.
Few studies have reported on the ability of UKPDS risk engine to predict subclinical atherosclerosis in Asian populations. A Korean study which investigated the ability of UKPDS risk engine and FRS in predicting CIMT of 621 patients with T2DM has reported that the former had the highest odds ratios of detecting Korean individuals with carotid atherosclerosis [14]. Previous studies done in Sri Lanka and Oman have reported that the FRS compared to WHO risk score categorized more individuals into low cardiac risk category of <10% [15,16]. These findings suggest that the WHO tool is relatively less sensitive in detecting individuals with low to moderate CVD risk than the FRS. A study conducted in three developing countries including Mongolia, Malaysia and Cambodia have reported that using the WHO risk score, the percentages in the risk category > 20% were 6%. 2.3% and 1.3 % respectively, indicating its lower detection rates of individuals with high CVD risk [17].
The possible explanation for both UKPDS and FRS to reveal stronger associations with CIMT than the WHO tool could be due to inclusion of additional variables such as HDL cholesterol, glycated haemoglobin and duration of diabetes in them. Studies have shown higher prevalence rates of lower HDL cholesterol among Indian Asians [18]. Higher CVD morbidity and mortality in the South Asian region is postulated to be associated with lower HDL level [19]. Markedly lower percentages of individuals in the CVD risk categories of > 10% with WHO risk score suggests the relative lack of sensitivity of including the total cholesterol level alone in predicting the CVD risk in Asian ethnicity.
The observed degree of agreement of the UKPDS and FRS are moderate with Cohen’s kappa value of 0.5 [Table/Fig-3]. Although the WHO risk estimation tool is meant to be used in the developing countries with poor resources, findings of this study argues against its reliability in detecting individuals who need primary prevention strategies in this setting. Instead, both UKPDS and FRS which are derived from data from Caucasian population, revealed better yield of patients with risk level above cut-off levels 10% and 20%. Adoption of WHO risk estimation tool in resource poor settings may incur low costs, but the price these communities will have to pay by denying the evidence based therapy such as statins and aspirin for needy patients could be costly. Instead of the WHO tool, use of either FRS or UKPDS risk assessment tool could detect a higher percentage of patients with CVD risk levels of > 10% and 10-20%.
This is the first study from our country to reveal the association of risk estimates of CVD risk estimation tools with a surrogate marker of atherosclerosis. However, there are few limitations in this study. The main limitation of this study is the sample size. As we used clinical evidence of established CVD in excluding patients for CIMT measurement, it is possible that some patients with established CVD without symptoms may have been included inadvertently for CIMT testing. We studied only the patients with diabetes hence, these findings may not be applicable to individuals without diabetes. Despite these limitations, we believe our findings would serve as an eye opener for public health authorities in the developing countries in selecting and adopting sensitive risk estimation method to screen asymptomatic individuals with diabetes for necessary primary prevention strategies.
Conclusion
We reported relative lack of sensitivity of WHO risk assessment tool compared to FRS and UKPDS risk engines to detect subclinical atherosclerosis among individuals with T2DM in a developing country. The CVD risk scores obtained by the latter two risk assessment tools had positive but weak associations with a surrogate marker of atherosclerosis and moderate agreement between them.
SD – Standard Deviation, HbA1c-Glycated haemoglobin, LDL – Low Density Lipoprotein, TG-Triglyceride.
*p-value is significant at <0.05, CIMT - Carotid Artery Intima Media Thickness, T2DM-Type 2 Diabetes Mellitus, HbA1c-Glycated Haemoglobin, LDL – Low Density Lipoprotein, TG-Triglyceride.
FRS-Framingham risk score, UKPDS- United Kingdom Prospective Diabetes Study risk engine, WHO -World Health Organization
FRS-Framingham risk score, UKPDS- United Kingdom Prospective Diabetes Study risk engine, WHO -World Health Organization.