In neurosurgical practice suprasellar tumors are very common. Pituitary adenomas, craniopharyngiomas, meningiomas and gliomas are generally the most frequent tumors in this area, but the whole spectrum of the possible pathologies is extremely wide, and includes both neoplastic and non-neoplastic masses. In many cases, these different entities can be readily distinguished by MRI alone or by MRI in combination with computed tomography, [1]. But even after using the most up-to-date equipment and imaging sequences, a definitive histological diagnosis often cannot be made preoperatively [2].
Materials and Methods
This prospective study was carried out in the Department of Radiodiagnosis of SMS hospital between October 2010 through September 2012 and Chettinad Hospital and Research Institute and in Department of Radiology in Chettinad Hospital and Research institute between October 2012 through September 2014. Institutional ethical approval was obtained for the study.
Sixty cases (suprasellar, hypothalamic and third ventricle tumors) among the patients who were advised MRI were investigated, with long-echo single voxel 1H-MRS. Informed consent from the patients was received and all investigations were done using 1.5 Tesla clinical imager (General electronics Signa Excite). Single-voxel spectroscopic examinations were guided by T1-weighted or T2-weighted images and where needed, postgadolinium T1-weighted MRI was used. Under three dimensional control, the rectangular 1H-MRS voxel was placed on the projection of the solid part of the tumor with avoidance of its cystic/ necrotic areas, as well as contamination with skull and cerebral ventricles. Acquisition of the spectrum was by STimulated Echo Acquisition Mode (STEAM). The size of the voxel used was either 15 x 15 x 15 mm (volume: 3.4 cc), or 20 x 20 x 20 mm (volume: 8 cc).
Metabolite signals from mobile lipids (Lip), lactate (Lac), N-acetylaspartate (NAA), creatine (Cr), and choline-containing compounds (Cho), centered, respectively at 0.9, 1.3, 2.0, 3.0, and 3.2 ppm, were obtained. Presence of each metabolite peak was initially evaluated qualitatively by visual inspection and type of the pathological 1H-MR spectra was determined according to the classification as in [Table/Fig-1]. Additionally, the content of NAA, Cho, and Cr in tumors was expressed relatively to their corresponding metabolites in the reference spectrum of the normal brain tissue (Mtbtumor/Mtbbrain). Peak intensity of NAA, Cho and Lip were normalized to Cr of the normal brain (nCr), and ratio Lip/NAA was calculated. Statistical analyses were done using IBM SPSS software version 19.
Types of the pathological 1H-MR spectra [5].
| Type of the pathological1H-MR spectra | Predominant metabolitePeak | Presence of Lacpeak | Presence of Lippeaks |
|---|
| Type I A | NAA (NAA content<0.75and/or Cho content>1.25 | No | No |
| Type I B | NAA | Yes | No |
| Type I C with mild elevationof Lip | NAA | Notrelevant | Yes (Lip/Cho<1) |
| Type I C with moderateelevation of Lip | NAA | Notrelevant | Yes (Lip/Cho>1) |
| Type II A | Cho | No | No |
| Type II B | Cho | Yes | No |
| Type II C with mild elevationof Lip | Cho | Notrelevant | Yes (Lip/NAA<1) |
| Type II C with moderateelevation of Lip | Cho | Notrelevant | Yes (Lip/NAA>1) |
| Type III A | Lip (Cho peak preserved) | Notrelevant | Yes |
| Type III B | Lip (significant reduction ordisappearance of Cho peak) | Notrelevant | Yes |
| Type III C | Absence of any detectablepeak | | |
Our study included 34 males and 26 females, aged between 6 and 71 years with a median age of 31 years. There were 28 pituitary adenomas, 12 gliomas, 8 craniopharyngiomas, 4 chordomas, 2 each of meningiomas, malignant lymphomas, Rathke cleft cysts and 1 each of germinoma, hypothalamic hamartoma. The MRS metabolites of 4 commonly encountered lesions viz. pituitary adenoma, glioma, craniopharyngioma and chordoma were identified, quantified and tabulated. Metabolites of occasionally confronted lesions were dealt with independently.
Results
The present data from our study has shown that in initially diagnosed tumors with large suprasellar extension 1H-MRS can provide valuable metabolic information. The various pathological 1H-MR spectra are categorized and typed based on [Table/Fig-1]. The observed NAA content, Cho content and Cr content of four major suprasellar tumors namely pituitary adenoma, glioma, craniopharyngioma and chordoma are quantified in [Table/Fig-2,3 and 4]. respectively. 1H-MR spectra of the pituitary tumors in the study were typically characterized by significant reduction of NAA peak, moderate elevation of Cho and infrequent presence of small Lip and Lac peaks [Table/Fig-5,6]. nCr level was found to be constant and various ratios Lip/nCr*, NAA/nCr*, Cho/nCr* were calculated [Table/Fig-7,8 and 9].
| Metabolic charact-eristics | Pituitary adenomas (28) | Gliomas (12) | Cranio-pharyn-giomas (8) | Chordomas (4) | Statistics† |
|---|
| NAA content* | 0.77(0.39-1.22) | 0.76(0.64-0.77) | 0.75 | 0.76 | H=0.275(p>0.2) |
* Data presented as medians with 95% confidence interval in parenthesis
† According to Kruskal–Wallis test
NAA-N-acetylaspartate
| Metabolic charact-eristics | Pituitary adenomas (28) | Gliomas(12) | Cranio-pharyn-giomas (8) | Chordomas(4) | Statistics† |
|---|
| Cho content* | 12.46(2.47-14.41) | 2.55(1.39-14.42) | 2.20 | 13.73(13.01-14.16) | H=10.336(p<0.05) |
* Data presented as medians with 95% confidence interval in parenthesis
† According to Kruskal–Wallis test
Cho-choline-containing compounds
| Metabolic charact-eristics | Pituitaryadenomas(28) | Gliomas (12) | Cranio-pharyn-giomas (8) | Chordomas (4) | Statistics† |
|---|
| Cr Content* | 0.51(0.16-.44) | 0.46(0.41-0.59) | NC | NC | H=0.659(p>0.2) |
* Data presented as medians with 95% confidence interval in parenthesis
† According to Kruskal–Wallis test
Cr-creatine
Presence of Lip0.9 and/or Lip1.3 peaks.
| Metabolic charact-eristics | Pituitary adenomas (28) | Gliomas (12) | Cranio-pharyn-giomas (8) | Chordomas (4) | Statistics‡ |
|---|
| Presence of Lip 0.9 and/or Lip 1.3 peaks* | 12 | 4 | 2 | 3 | χ2 corrected=2.418(p>0.2) |
* Data presented as medians with 95% confidence interval in parenthesis
‡ According to chi-square test with continuity correction
Lip-mobile lipids
| Metabolic charact-eristics | Pituitary adenomas (28) | Gliomas (12) | Cranio-pharyn-giomas (8) | Chordomas (4) | Statistics‡ |
|---|
| Presence of Lac peak* | 10 | 5 | 1 | 3 | χ2 corrected=0.312(p>0.2) |
* Data presented as medians with 95% confidence interval in parenthesis
‡ According to chi-square test with continuity correction
Lac-lactate
| Metabolic charact-eristics | Pituitary adenomas (28) | Gliomas (12) | Cranio-pharyn-giomas (8) | Chordomas (4) | Statistics† |
|---|
| Lip/nCr* | 7.99(2.52-13.54) | 10.43(92.5-12.51) | 2.76 | 13.75(12.9-14.19) | H=6.871(p<0.1) |
* Data presented as medians with 95% confidence interval in parenthesis
† According to Kruskal–Wallis test
nCr-creatine of the normal brain; Lip-mobile lipids
| Metabolic charact-eristics | Pituitary adenomas (28) | Gliomas (12) | Cranio-pharyn-giomas (8) | Chordomas (4) | Statistics† |
|---|
| NAA/nCr* | 0.48(0.11-1.33) | 0.47(0.08-1.98) | 1.78 | 0.34 | H=1.419(p>0.2) |
* Data presented as medians with 95% confidence interval in parenthesis
† According to Kruskal–Wallis test
| Metabolic charact-eristics | Pituitary adenomas (28) | Gliomas (12) | Cranio-pharyn-giomas (8) | Chordomas (4) | Statistics† |
|---|
| Cho/nCr* | 11.62(2.41-13.57) | 12.43(2.51-13.56) | 0.89 | 13.74(13.31-14.16) | H=8.421(p<0.05) |
* Data presented as medians with 95% confidence interval in parenthesis
† According to Kruskal–Wallis test
Pituitary Adenomas
Among 28 tumors, 17 were functional and rest non-functional. 1H-MR spectra of the pituitary tumors were typically characterized by significant reduction of NAA peak, which was not identified at all in 14 cases, absence (8 cases) or presence of only residual (6 cases) Cr peak, moderate elevation of Cho and infrequent presence of small Lip and Lac peaks. Seven cases had type I A spectra, 3 cases had type II B spectra, 5 cases had type II C with mild elevation of lip peak, 4 cases had type II C with moderate elevation of lip peak, 3 cases had type III C while 6 cases had type IIIB. It should be noted, that even in cases with moderate elevation of Lip, increase of Lip/NAA ratio above 1 was seemingly caused not by elevation of the Lip content, but by significant decrease of NAA [Table/Fig-10,11]. No significant differences were found between functional and non-functional tumors.
| Metabolic charact-eristics | Pituitary adenomas (28) | Gliomas (12) | Cranio-pharyn-giomas (8) | Chordomas (4) | Statistics† |
|---|
| Lip/NAA* | 21.29(2.16-25.49) | 27.12(24.16-29.12) | 5.75 | 31.03 | H=5.233(p>0.2) |
* Data presented as medians with 95% confidence interval in parenthesis
† According to Kruskal–Wallis test
NC - not calculated
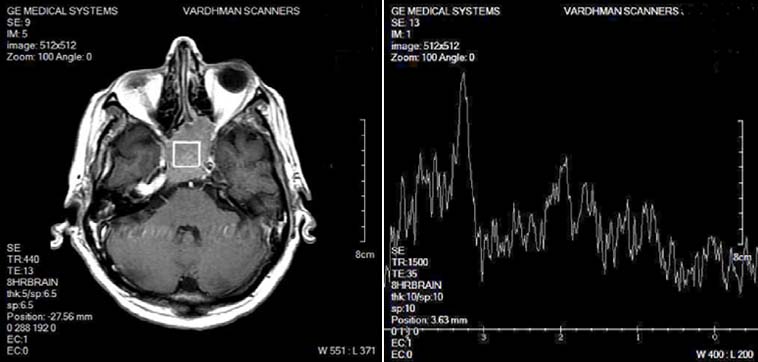
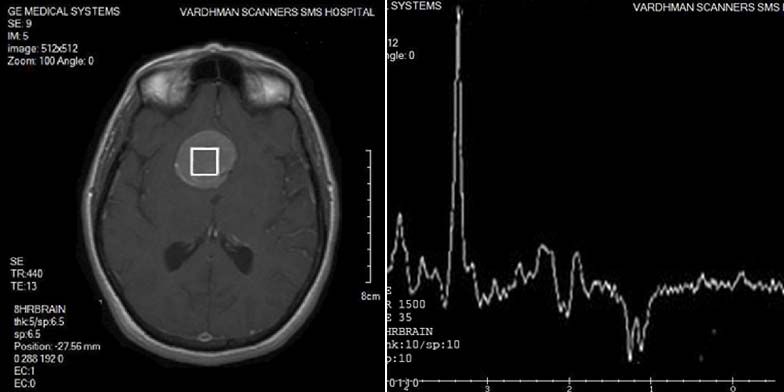
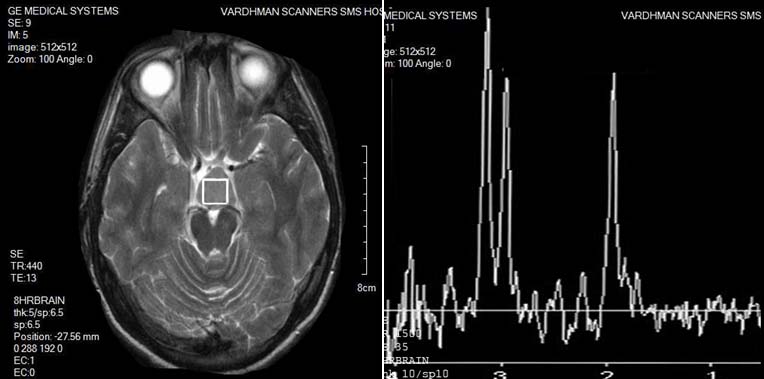
PITUITARY ADENOMA: Spectroscopy of a pituitary adenoma shows significant reduction of NAA peak, Cr peak, moderate elevation of Cho, and a small Lip and Lac peak.
Gliomas
Among 12 gliomas there were 7 WHO Grade I tumors while 5 were WHO Grade II tumors. 1H-MR spectra of gliomas were typically characterized by decrease of NAA and Cr peaks, and increase of Cho peak, which, however, were usually preserved [Table/Fig-12]. Lip and Lac peaks were identified in 4 and 5 cases, respectively. Ten tumors had pathological 1H-MR spectra Type II: 4—Type II A, 3—Type II B, and 3—Type II C with moderate elevation of Lip. Two tumors had type III C spectra. Identification of NAA in gliomas can be caused either by infiltrative growth of the tumor and presence of viable neurons within the bulk of neoplasm or by production of the metabolite by the neoplastic cells itself [6].
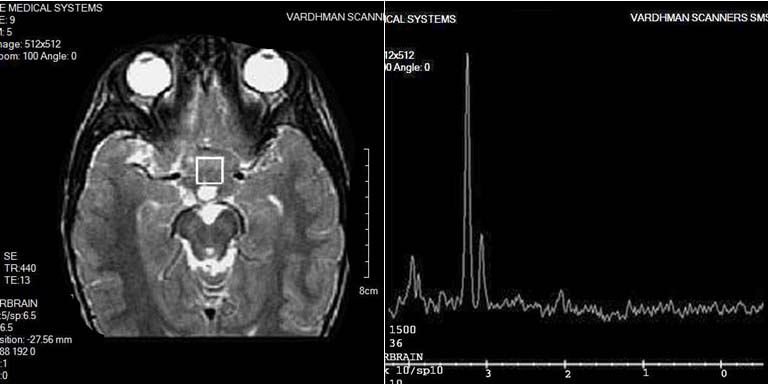
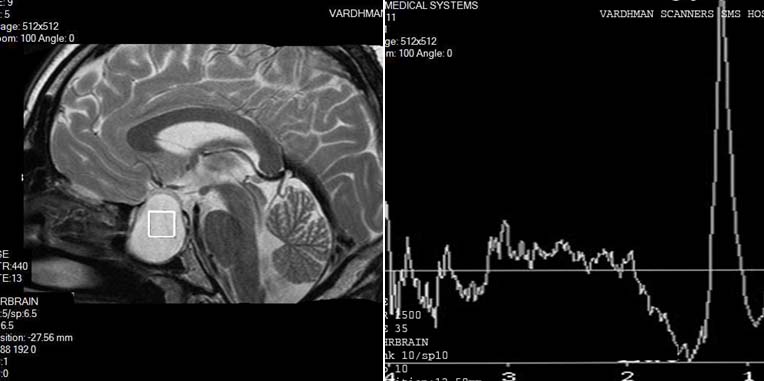
GLIOMA: Spectroscopy of a glioma shows decrease of NAA and Cr peaks and increase of Cho peak and a small Lip and Lac peak.
Craniopharyngiomas
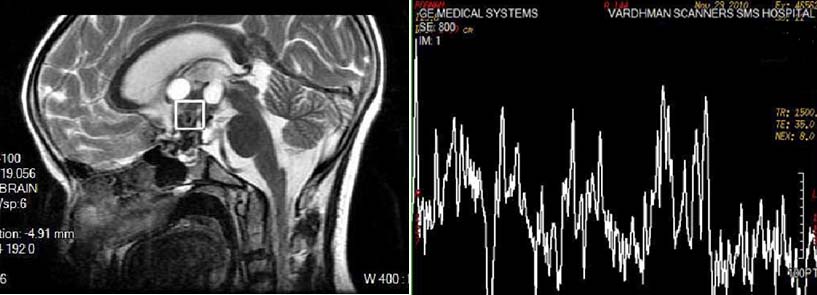
1H-MR spectra of the tumors were typically characterized by significant decrease of all metabolites and presence of multiple additional peaks [Table/Fig-13]. Two tumors had pathological 1H-MR spectrum Type II C with mild elevation of Lip, whereas 6 others had pathological 1H-MR spectra Type III C.
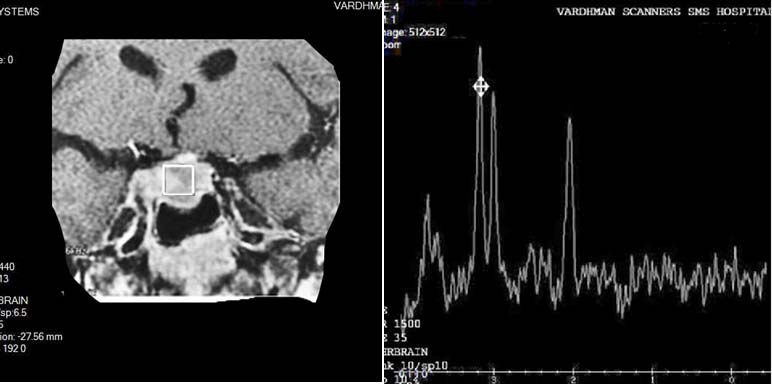
CRANIOPHARYNGIOMA: Spectroscopy shows significant decrease of all metabolites and presence of multiple additional peaks.
Chordomas
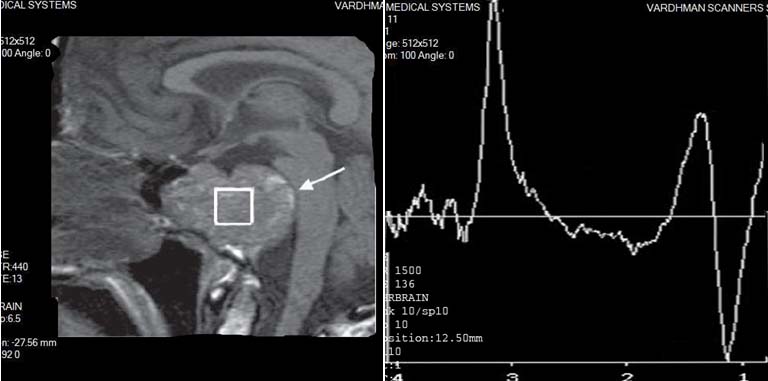
1H-MR spectra of the tumors were typically characterized by significant decrease of NAA and Cr peaks, and profound elevation of Cho and Lip peaks [Table/Fig-14]. Prominent Lac peak was presented in 3 cases. All tumors had pathological 1H-MR spectra Type II C with moderate elevation of Lip.
CHORDOMA: Spectroscopy shows significant decrease of NAA and Cr peaks and profound elevation of Cho and Lip peaks and the presence of lactate peak.
Others
Both meningiomas had pathological 1H-MR spectrum Type II C with mild elevation of Lip, which was characterized by absence of NAA peak, residual Cr peak, mild elevation of Cho, presence of small Lac and Lip peaks [Table/Fig-15].
MENINGIOMA: Spectroscopy shows mild elevation of Lip, absence of NAA peak, residual Cr peak, mild elevation of Cho, presence of small Lac and Lip peaks as well as an alanine peak.
Malignant lymphoma(two cases) had pathological 1H-MR spectrum Type II C with moderate elevation of Lip, which were characterized by decrease of NAA peak, residual Cr peak, slightly increased Cho peak and presence of Lac and Lip peaks [Table/Fig-16].
LYMPHOMA: Spectroscopy shows moderate elevation of Lip, decrease of NAA peak, residual Cr peak, slightly increased Cho peak, and presence of a Lac and Lip peak.
Germinoma had pathological 1H-MR spectrum Type II C with moderate elevation of Lip, which was characterized by absence of NAA peak, residual Cr peak, significant elevation of Cho peak, and presence of prominent Lip and Lac peaks [Table/Fig-17].
GERMINOMA: Spectroscopy shows moderate elevation of Lip, absence of NAA peak, residual Cr peak, significant elevation of Cho peak, and presence of prominent Lip and Lac peaks.
Rathke’s cleft cyst (two cases) had pathological 1H-MR spectrum Type III B, which were characterized by absence of any metabolite peaks beside Lip and Lac [Table/Fig-18].
RATHKE’S CLEFT CYST: Spectroscopy is characterized by absence of any metabolite peaks beside Lip and Lac.
Hypothalamic hamartoma had pathological 1H-MR spectrum Type II A, which was characterized by decrease of NAA peak, practically unchanged Cr peak, and slightly increased Cho peak [Table/Fig-19].
HYPOTHALAMIC HAMARTOMA: Spectroscopy is characterized by decrease of NAA peak, practically unchanged Cr peak, and slightly increased Cho peak.
Discussion
Magnetic Resonance Imaging (MRI) is now a widely accepted modality for delineating normal and pathological structures within the brain. Discrimination among different types of pathological tissues remains difficult and in cases of brain tumors, biopsy is often required to establish a specific pathological diagnosis. Proton magnetic resonance spectroscopy (1H-MRS) gives completely different information related to neuronal integrity, cell proliferation or degradation, energy metabolism, and necrotic transformation of brain or tumour tissues [7,8]. In conjunction with structural imaging modalities, 1H-MRS plays an increasingly important role in a number of common neurological disorders [9,10] and MRS may be useful in providing a more improved preoperative diagnosis of suprasellar tumors [11].
In spite of the fact that the function of NAA is not known exactly, it is generally recognized as a marker of functional neurons and their appendages (including dendrites). Whenever brain tissue is damaged or replaced by any destructive, degenerative or infiltrative process, NAA is markedly reduced [12–14]. This is in concordance with the results of the study. Extra-axial lesions, which do not infiltrate brain or which do not contain neuroglial tissue, will not demonstrate any NAA resonances. Since Cr-bound phosphates are a substrate of the ATP/ADP cycle, Cr is considered to be an indicator of energy metabolism. Cr is quite constant in various metabolic conditions, it has often been used as an internal standard for semi-quantitative evaluation of metabolic changes of other brain metabolites-Cho resonances originate mainly from intermediates of phospholipid metabolism such as phosphocholine and glycerophosphocholine, which both play an important role in the structure and function of cell membranes. Consequently, increased Cho can be seen in processes with elevated cell-membrane turnover, such as in proliferating tumors [12–14]. In the present study, pituitary adenomas and chordomas showed significant increase in Cho content. Lipids and lactate are physiologically not detectable in healthy brain. In-vitro studies have shown that the amount of lipids detected by spectroscopy correlates well with the degree of micro- and macronecrosis seen on histology. Brain lactate is produced in conditions of anaerobic glycolysis, i.e. during a mismatch between glycolysis and oxygen supply and indicates hypoxic conditions as well as hypermetabolic glucose consumption [15].
1H MRS permits exact spatial localization and interpretable spectra may be obtained from regions of interest as small as 8 cm3, thus allowing data to be obtained from relatively small tumors. Unfortunately, metabolites cannot be readily quantified in terms of absolute concentrations and data must be expressed in terms of the ratios of the different peaks. Nevertheless, metabolites may be measured noninvasively and repetitively in a manner not possible by other methods [16].
Conclusion
MRS findings should never be used in isolation but interpreted in conjunction with the clinical and spatial imaging findings. This is especially important if the list of possible pathologies for differential diagnosis is as wide as in suprasellar region. As it is shown in the present series there is definite variation of the metabolic patterns in neoplasms with the same histological type, whereas more or less similar neurochemical alterations can be observed in completely different diseases. However, there is clear evidence that spectra obtained from different tumors exhibited reproducible differences, while histologically similar tumors yielded characteristic spectra with only minor differences.
* Data presented as medians with 95% confidence interval in parenthesis
† According to Kruskal–Wallis test
NAA-N-acetylaspartate
* Data presented as medians with 95% confidence interval in parenthesis
† According to Kruskal–Wallis test
Cho-choline-containing compounds
* Data presented as medians with 95% confidence interval in parenthesis
† According to Kruskal–Wallis test
Cr-creatine
* Data presented as medians with 95% confidence interval in parenthesis
‡ According to chi-square test with continuity correction
Lip-mobile lipids
* Data presented as medians with 95% confidence interval in parenthesis
‡ According to chi-square test with continuity correction
Lac-lactate
* Data presented as medians with 95% confidence interval in parenthesis
† According to Kruskal–Wallis test
nCr-creatine of the normal brain; Lip-mobile lipids
* Data presented as medians with 95% confidence interval in parenthesis
† According to Kruskal–Wallis test
* Data presented as medians with 95% confidence interval in parenthesis
† According to Kruskal–Wallis test