Amongst other factors, prognosis of dental implant is based on the various loads applied during function on the prosthetic part and the load transmitted to the bone at various regions [1]. Hence, load applied is an important factor in evaluating the prognosis. After implant insertion and its subsequent initial loading, crestal bone undergoes remodeling and resorption. The mechanism of bone resorption is presently attributed to a biologic width re-establishment that follows a chronic bacterial inflammation of the implant/abutment connection. Additional bone resorption seems to be related to micro-movements at the abutment-implant interface and occlusal loading [2,3].
Occlusal forces affect the bone surrounding an oral implant. Mechanical stresses may have a negative effect on the surrounding bone leading to bone resorption. When an implant is occlusally loaded, the stress will be transferred to the bone with the highest stress at the coronal portion of the bone.
Studies on stress distribution around screw retained implants in different bone densities are limited [4]. In clinical situations crowns of different heights are placed on the implants, and the effect of varying crown implant ratio on the bone is not understood properly. Hence, considering the factors mentioned above, a three dimensional finite element analysis was designed to evaluate stress distribution in screw retained implants of different crown implant ratios in different bone qualities under various loads.
Materials and Methods
This study was conducted and evaluated at Narayana Dental College and Hospital, Nellore, Andhra Pradesh, India, fordoration of six months.
In this invitro study the stress distribution was evaluated and compared between two different crown heights, retained on implants by using different screw materials, in two different densities of bone D2 and D3 under various load applications by using finite element analysis.
The acquired data from different sources was subjected to finite element procedure at CAD technical solutions, Vijayawada, India under the following methodology:
Finite Element Modelling
1. Construction of geometric models
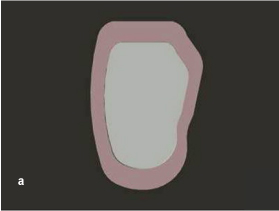
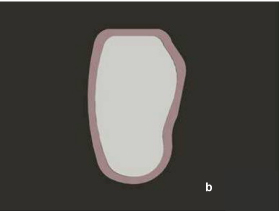
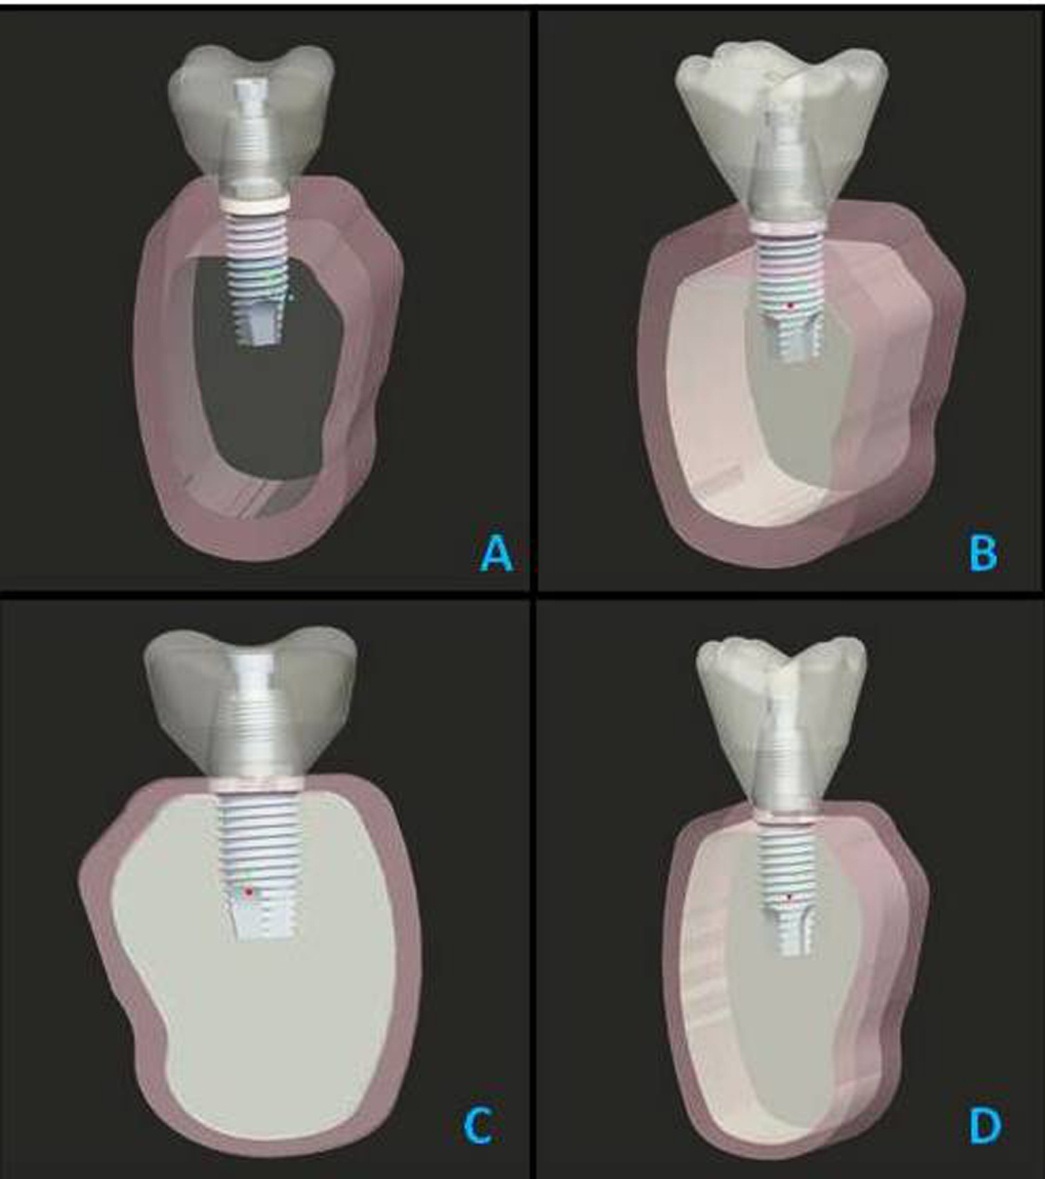
a) Modelling of bone: For the construction of geometric model of bone, the data obtained through CT scan of the mandibular posterior region was fed into computer to create a numeric model of bone segment. The segment of bone D2 type [Table/Fig-1a] consists of cancellous bone surrounded by 2mm thick cortical layer, height of 22mm,14.48 mm of width and D3 type bone [Table/Fig-1b] surrounded by 1mm cortical layer, 22mm height,14.49 mm of width.
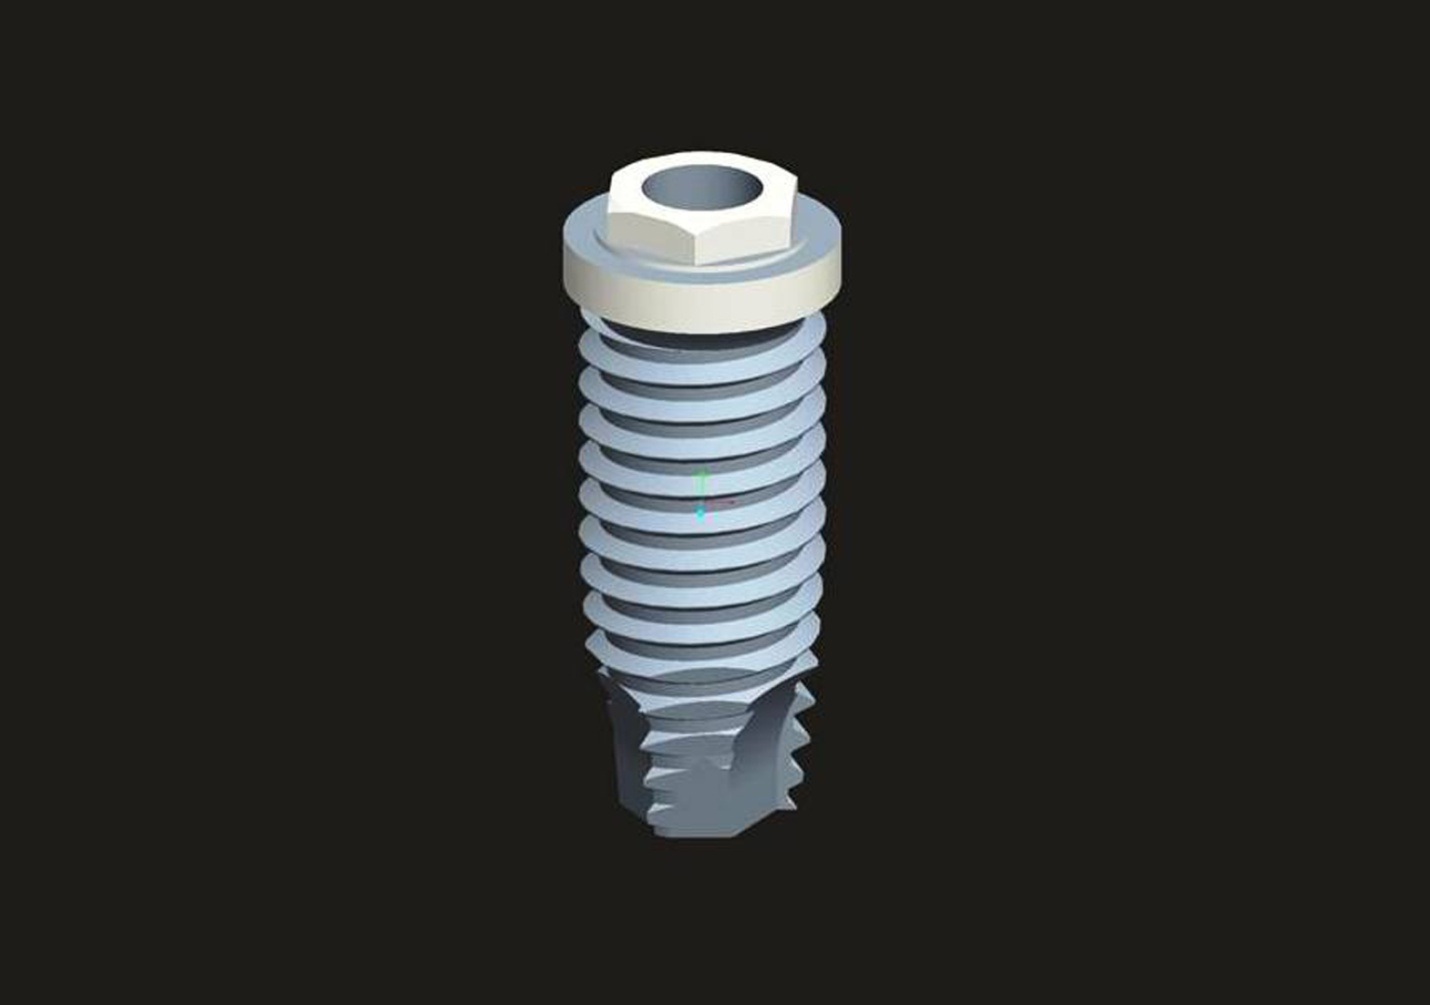
b) Modelling of implant: A three dimensional model of Nobel Biocare implant was generated with dimensions of 3.5mm diameter and 10mm length with a crest module of 1.5mm. It consists of micro threads along with internal conical connection with a “V” shaped thread pattern. The data acquisition was obtained from manufacturers and implant was built to the required dimensions using Catia software. It was positioned halfway between the mesio-distal segment of the mandible representing mandibular first molar region [Table/Fig-2].
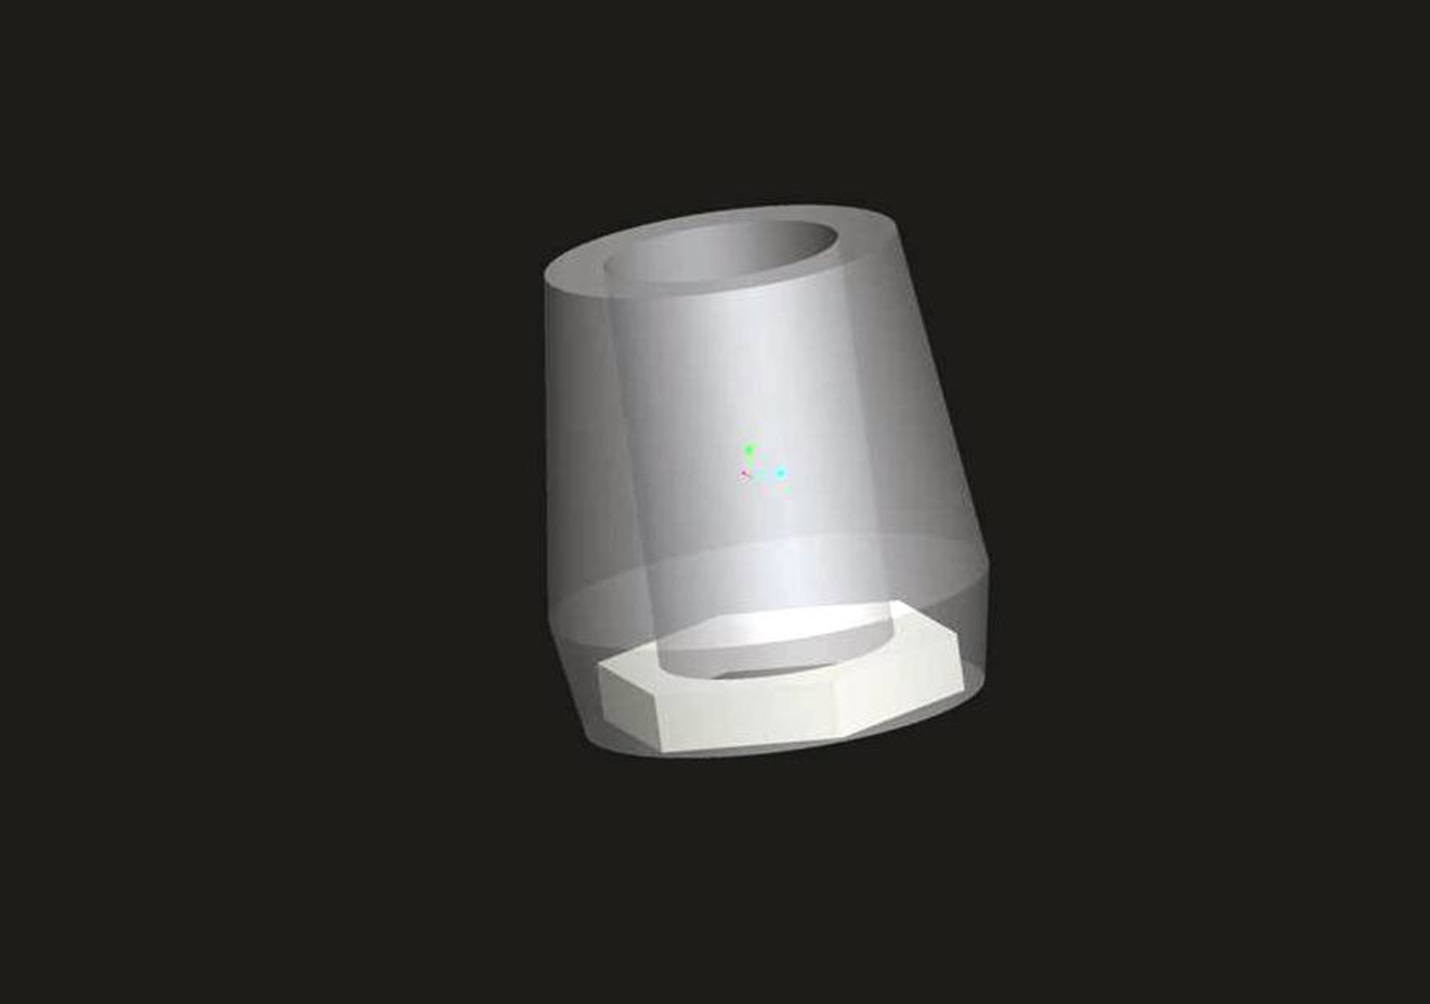
c) Modelling of abutment: Implant abutments of 5mm height, 4.3mm diameter, and 2.1mm width were generated [Table/Fig-3].
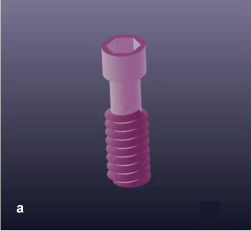
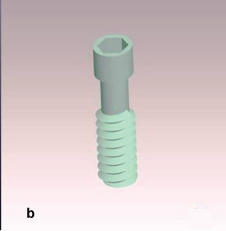
d) Modelling of screw: Screws of two different materials - Commercially pure titanium (CpTi) [Table/Fig-4a], Titanium alloy (Ti alloy) [Table/Fig-4b] each with 10mm height and 2mm width were generated.
Modeling of screw (commercially pure titanium).
Modeling of screw (titanium alloy).
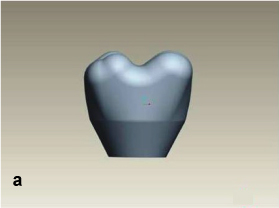
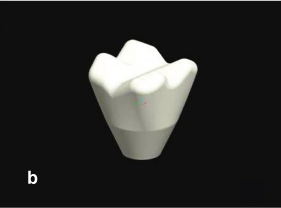
e) Modelling of crown: Zirconia crown (Cercon, Dentsply, Burlington, Newzealand) was used as screw retained prosthesis. Youngs modulus of this crown is 70000MPa, poisons ratio is 0.190. Screw retained prosthesis was designed on the implant, first one with the dimensions of 7.5mm cervico-occlusal length, 10mm mesiodistal diameter, 9.5mm buccolingual width and 2mm of occlusal and lateral wall thickness [Table/Fig-5a]. Second superstructure was designed with the dimensions of 10mm cervico-occlusal length, 13.3mm mesio-distal diameter, 12.66mm bucco-lingual width and 2mm of occlusal and lateral wall thickness [Table/Fig-5b]. Also, 3D models of implants with crowns were generated in D2 and D3 bone with crown height 7.5mm and 10 mm [Table/Fig-6a-6d].
Modeling of crown (7.5mm).
Modeling of crown (10mm).
a A 3D model of the implant placement in D2 bone of crown height 7.5mm. b A 3D model of the implant placement in D2 bone of crown height. c A 3D model of the implant placement in D3 bone of crown height 7.5mm. d: A 3D model of the implant placement in D3 bone of crown height 10mm.
2. Mesh generation
The geometry of implant, abutment, screw and crown was tetra meshed due to complexity of design by using Solid185 element programme. Meshing was done by giving a meshing command to the software. During meshing some approximations were done due to difficulty in meshing. Meshing divides the body into infinite number of elements, each element having nodes and control points. Three dimensional models of meshing in the bone were generated [Table/Fig-7a-7d].
a A 3D model of the mesh generation in D2 bone of crown height 7.5mm. b A 3D model of the mesh generation in D2 bone of crown height 10mm. c A 3D model of the mesh generation in D3 bone of crown height 7.5mm. d A 3D model of the mesh generation in D3 bone of crown height 10mm.
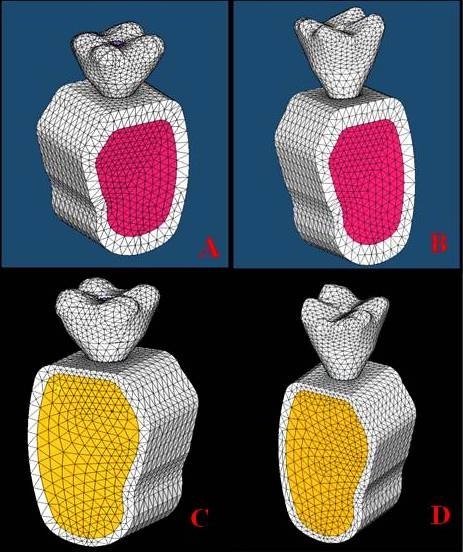
The total number of elements and nodes obtained from the mesh generation were tabulated in [Table/Fig-8].
Number of nodes and elements obtaining from mesh generation.
| S. no | Name | 7.5_D2 | 10_D2 | 7.5_D3 | 10_D3 |
|---|
| Nodes | Ele-ments | Nodes | Ele-ments | Nodes | Ele-ments | Nodes | Ele-ments |
|---|
| 1. | Cortical Bone | 13229 | 7241 | 13227 | 7241 | 8500 | 4107 | 8999 | 4349 |
| 2. | Can-cellous Bone | 23601 | 14780 | 23599 | 14780 | 28201 | 17653 | 29255 | 18274 |
| 3. | Implant | 15254 | 8266 | 15254 | 8266 | 15254 | 8266 | 15254 | 8266 |
| 4. | Implant abut-ment | 19549 | 11521 | 19547 | 11521 | 19547 | 11521 | 19547 | 11521 |
| 5. | Implant screw | 15254 | 8266 | 15254 | 8266 | 15254 | 8266 | 15254 | 8266 |
| 6. | Crown | 8650 | 5007 | 10633 | 6305 | 8648 | 5007 | 10633 | 6305 |
| 7. | Full model | 57134 | 39725 | 59117 | 41023 | 56832 | 39464 | 60206 | 41625 |
3. Specifying material properties
The material properties of cortical, cancellous bone, implant, abutment, screw and crown were incorporated for the accurate analysis and interpretation of the programme. TheYoung’s modulus and Poisson’s ratio of all the materials was incorporated in the previously generated models. The elastic parameters for all the components were obtained from the literature. Two types of bone densities were modeled by varying the elastic modulus of compact bone and cancellous bone. The cortical bone, cancellous bone and screw retained implants with abutments were presumed to be linearly elastic, homogenous and isotropic. Although cortical bone has anisotropic material characteristics and posses regional stiffness variation, they were presumed to be linearly elastic, homogenous and isotropic. They were modeled isotropically due to unavailability of sufficient data and difficulty in establishing the principal axis of anisotropy. The material properties of different components modeled in this study are illustrated in [Table/Fig-9].
Properties of bone and implant screw and crown material.
| Material | Young’s Modulus (MPa) | Poissons Ratio |
|---|
| Cortical Bone | 13700 | 0.30 |
| Cancellous Bone | 1100 | 0.3 |
| Commercially Pure Titanium | 110000 | 0.33 |
| Titanium Alloy | 114000 | 0.30 |
| Crown (Zirconia) | 70000 | 0.190 |
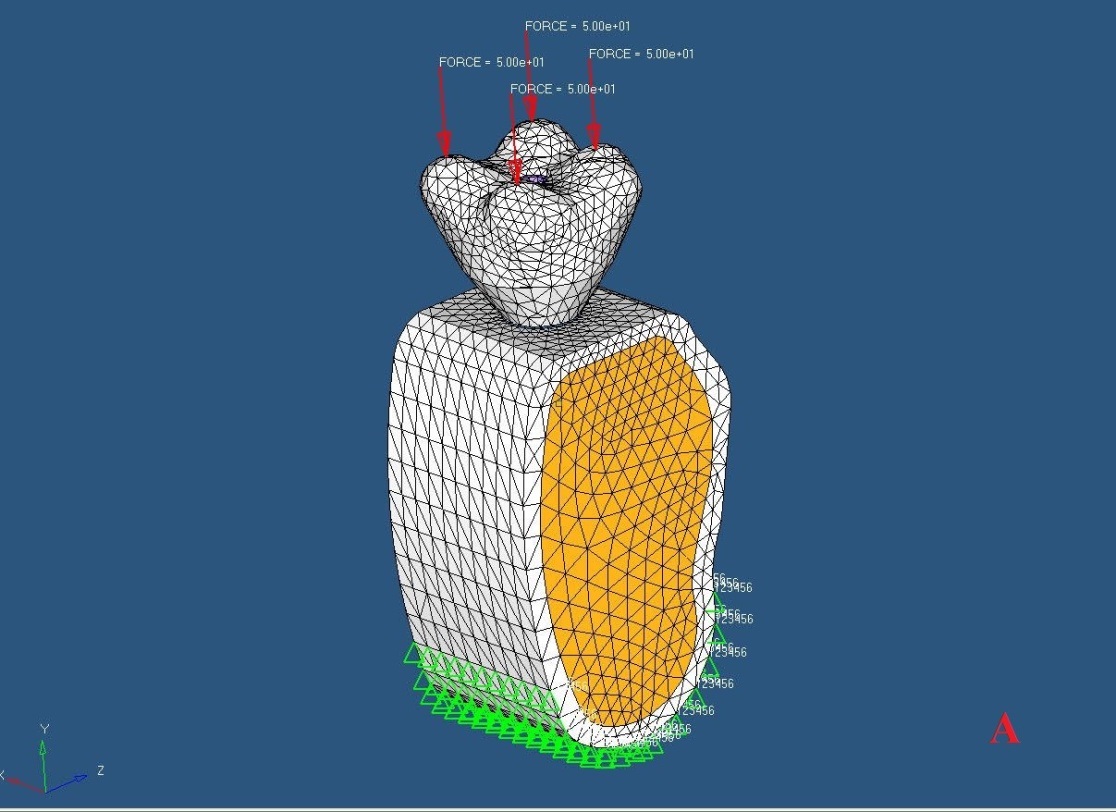
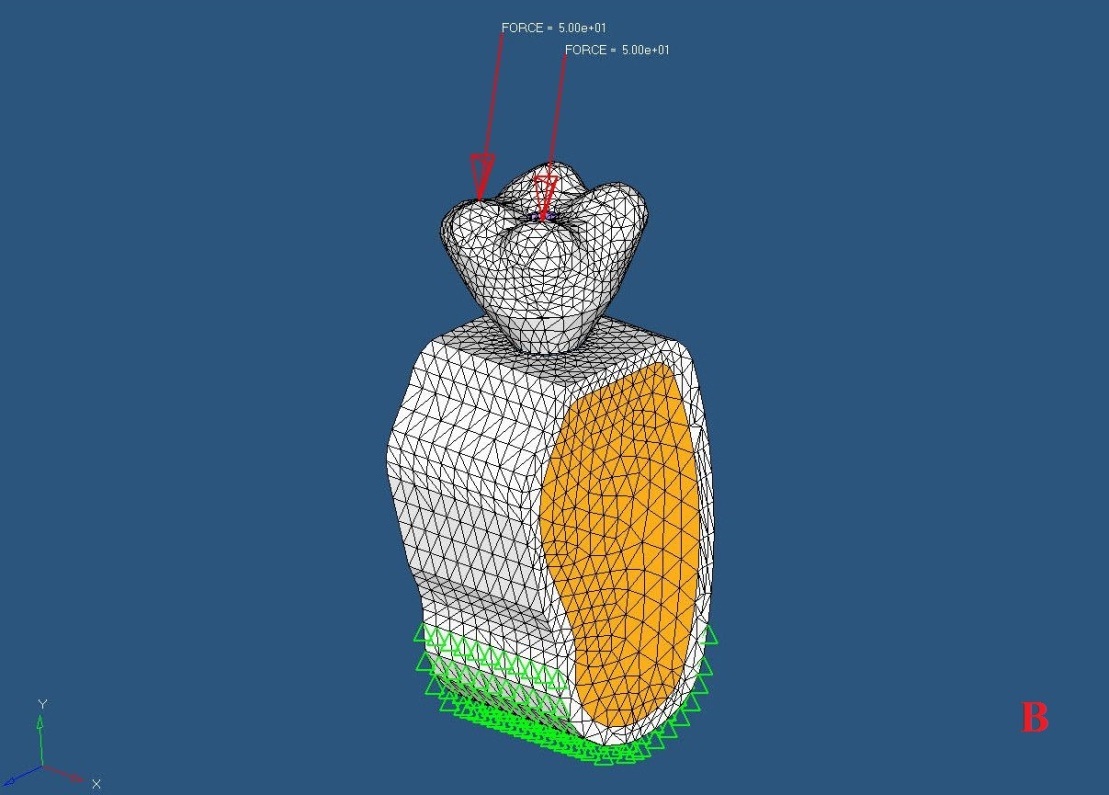
4. Applying boundary conditions
Both anterior and posterior bone boundary regions are constrained and omitting support at the bottom permitted bending of the model. These aspects make the model achieve more realistic representation of clinical situation.
5. Application of loads
A total static load of 200N (50N each on buccal and lingual cusps) was applied in vertical direction. A total static load of 100N [50N each on lingual cusps] was applied in oblique direction to simulate eccentric contacts (Morneburg and Proschel) [Table/Fig-10a,10b].
Application of vertical load on all 4 cusps (buccal and lingual cusps).
Application of oblique load on 2 cusps (lingual cusps).
6. Evaluation procedure
The components modeled through finite element modeling i.e., two different densities of bone D2 and D3, with two different crown heights and two different screw materials were generated on to the implant model at the mandibular first molar region. They were subjected to 200N axial loads on the buccal and lingual cusps in vertical direction and 100N of oblique load on the lingual cusps in oblique direction and further analysis was carried out.
Finite Element Analysis
Different models were analyzed by processor i.e., solver and results were displayed by post processor of finite element analysis (ANSYS) in the form of color code maps using Von Mises Stress Analysis [Table/Fig-11a-p]
Maximum stress concentration by application of vertical load in D2 bone of crown height 7.5mm. b Maximum stress concentration by application of vertical load in D2 bone of crown height 10mm. c Maximum stress concentration by application of vertical load in D3 bone of crown height 7.5mm.d Maximum stress concentration by application of vertical load in D3 bone of crown height 10mm. e Maximum stress concentration by application of oblique load in D2 bone of crown height 7.5mm. f Maximum stress concentration by application of oblique load in D2 bone of crown height 10mm. g Maximum stress concentration by application of oblique load in D3 bone of crown height 7.5mm. h Maximum stress concentration by application of oblique load in D3 bone of crown height 10mm. i Maximum stress concentration by application of vertical load in titanium screw with crown height of 7.5mm. j Maximum stress concentration by application of oblique load in titanium screw with crown height of 7.5mm. k Maximum stress concentration by application of vertical load in titanium screw with crown height of 10mm. l Maximum stress concentration by application of oblique load in titanium screw with crown height of 10mm. m Maximum stress concentration by application of vertical load in titanium alloy screw with crown height of 7.5mm. n Maximum stress concentration by application of oblique load in titanium alloy screw with crown height of 7.5mm. o Maximum stress concentration by application of vertical load in titanium alloy screw with crown height of 10mm. p Maximum stress concentration by application of oblique load in titanium alloy screw with crown height of 10mm.
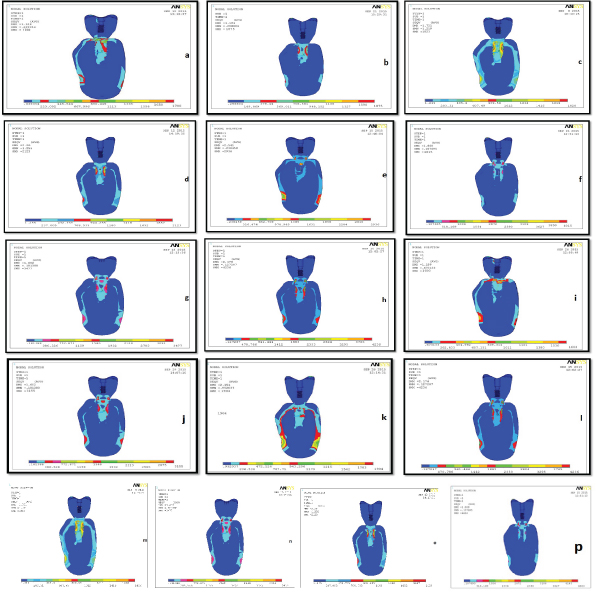
Von Mises Stress values are defined as the beginning of deformation for ductile materials. Metallic implant failure occurs when Von Mises Stress values exceed the yield strength of an implant material. Von Mises Stress is commonly reported in FEA studies to summarize the overall stress state at a point. Therefore they are important for interpreting the stresses occurring within the implant material. Stress distribution in the finite element model comes in numerical values and in color coding. Maximum values of VON MISES STRESS are denoted by red color. Minimum values of VON MISES STRESS are denoted by blue color. In between values are represented by bluish green, green, greenish yellow and yellowish red in the ascending order of stress distribution.
Results
Von Mises Stress was measured in screw, implant and bone region. Von Mises Stress was maximum in the implant–bone interface in relation to body of the implant, and also within the facial and lingual areas of cortical bone in the body of mandible and middle threads of the screw.
The following results were obtained through finite element procedure:
When vertical load of 200N was applied the maximum stress concentration in D2 and D3 bone density for crown height of 7.5 mm was 1780 N/cm2 and 1820 N/cm2 respectively.
When oblique load of 100N was applied the stress concentration in D2 and D3 bone density for crown height of 7.5mm was 2936N/cm2 and 3477 N/cm2 respectively. When vertical load of 200N was applied the stress concentration in D2 and D3 bone density for crown height of 10mm was 1875 N/cm2 and 2123 N/cm2 respectively.
When oblique load of 100N was applied the stress concentration in D2 and D3 bone density for crown height of 10mm was 4015N/cm2 and 4236N/cm2 respectively [Table/Fig-12].
Comparison of the values of maximum stress concentration in different bone densities in different crown heights under different load application.
| S.No | Bone Density | Crown Height | Stress Concentration Under Vertical Load N/ cm2 | Stress Concentration Under Oblique Load N/ cm2 |
|---|
| 1. | D2 | 7.5 mm | 1780 | 2936 |
| D3 | 1820 | 3477 |
| 2. | D2 | 10 mm | 1875 | 4015 |
| D3 | 2123 | 4236 |
In case of titanium screws for crown height of 7.5mm, when vertical load was applied, stress concentration was 1603N/cm2 where as for titanium alloy screw it was 1820N/cm2. In case of 10mm crown height stress concentration was 1904N/cm2 for titanium screw and 2123N/cm2 for titanium alloy screw.
In case of oblique loading for 7.5mm crown height stress concentration was 3155N/cm2 for titanium screw 3477N/cm2 for titanium alloy screw. For 10mm crown height stress concentration was 4236N/cm2 for titanium screw, 4663N/cm2 for titanium alloy screw [Table/Fig-13].
The maximum values of stress concentration under different load application on different screw materials.
| S. No | Crown Height | Screw Type |
|---|
| Commercially Pure Titanium | Titanium Alloy |
|---|
| Stress Concentration Under Vertical Load N/ cm2 | Stress Concentration Under Oblique Load N/ cm2 | Stress Concentration Under Vertical Load N/ cm2 | Stress Concentration Under Oblique Load N/ cm2 |
|---|
| 1. | 7.5 mm | 1603 | 3155 | 1820 | 3477 |
| 2. | 10 mm | 1904 | 4236 | 2123 | 4663 |
Discussion
The density of available bone in an edentulous site is a determining factor in treatment planning, implant design, surgical approach, healing time and initial progressive bone loading during prosthetic reconstruction.
Young’s modulus of compact bone is ten times higher than that of cancellous bone. Compact bone quality will ensure better implant stability and better condition for successful implant [5]. Zarb and Schmitt stated that bone structure is the most important factor in selecting the most favorable treatment outcome in implant dentistry [2,6].
The crown implant ratio was established as a biomechanical variable that may have negative influence on dental implants and bone tissue [4]. The optimum ratio is 0.5:1 and up to 1:1 still regarded as clinically acceptable. Occlusal factors become important in posterior region with high crown to implant ratio. Unfavorable crown implant ratio may result in excessive off axis load that will increase the tendency to load the prosthetic stack and cervical supporting bone [7]. A design factor that is closely related to the crown implant ratio is implant length [8]. Shorter implant results in a higher crown-implant ratio in most cases. The effects of implant length on implant survival have been evaluated in many studies [7, 9,10]. Most forces applied to the osseointegrated implant are concentrated in the crestal bone, regardless of implant design and bone density. Therefore, implant length is not an effective method to overcome the effect of the crown height. Only increased crestal bone and implant contact may decrease stress distribution [11–13]. The literature indicates that under non-axial forces, the stress concentration increases with an increase in crown-implant ratio.
In the present study, stress distribution for different crown-implant ratios, placed in different bone densities was analyzed. D2 is the most commonly occurring bone density in mandibular posterior region. All FEA models represent mandibular molars, which is the most commonly missing teeth in oral cavity. When crown height was 10mm, the stress was 1875N/cm2. In case of oblique loading (100N), for 7.5mm crown height in D2 bone the stress was 2936N/cm2, and when crown height increased to 10mm, the stress was 4015N/cm2. Results of this study show, with a crown height of 7.5mm and vertical load of 200N; maximum stress observed was 1820N/cm2 in D3 bone density, and when crown height was 10mm, the stress was 2123N/cm2. In case of oblique loading (100N), for D3 bone density for 7.5mm crown height, the stress was 3477N/cm2, and when crown height increased to 10mm, the stress was 4236N/cm2, Therefore, stress concentration in D2 and D3 bone was more in oblique loading when compared to vertical loading.
The results of the present study coincide with the study conducted by Holmes and Loftus [3]. The authors concluded that the placement of implants in type 1 bone quality resulted in less micromotion and reduced stress concentration. From the results, the stress concentration was more in D3 bone than D2 bone. So that the stress distribution will be more in D2 bone than D3 both under the application of vertical and oblique load.
The results of the present study coincide with the study conducted by Nissan et al., [7]. The authors concluded that when the force is axial, crown height space does not increase stress to the bone. However, non axial forces are magnified in direct relationship to the crown height. According to this study, stress concentration was more with the application of oblique load than in the application of vertical load in both 7.5mm and 10mm height of crowns.
The stress concentration in prosthetic screws was also in the same pattern. [Table/Fig-13] shows values of maximum stress concentration under different load application on different screw materials. According to S.L.D Moraes et al., under axial loading, there was no significant increase in stress concentration in screw with increase in crown height however under oblique loads there was a significant increase in stress concentrations in screw with increase in crown height [4]. This result may be supported by the theoretical analysis of Rangert et al., [14]. Rangert’s study suggests that the movement caused by the oblique forces is more severe, emphasizing the strength potential of increasing the concentration of tension in the implant and bone in oblique loading [4].
When it comes to prosthetic screw materials, the stress concentration was more in titanium alloy screw than in commercially pure titanium screw in the crown heights of 7.5mm and 10mm respectively. So that the distribution was more in commercially pure titanium screws than in titanium alloy’s screw.
When planning for implant prosthesis, the clinician should consider the height of the crown, the quality of the bone, type of occlusal load on the prosthesis which is also important for favourable stress distribution. The type of alloy of the prosthetic screw is also an important consideration in designing a prosthesis that should not be overlooked.
Future prospects of this study: In the upcoming /future studies, stress distribution under cyclic loading is to be analyzed since it is observed clinically and the clinical relevance of the current study is to be tested.
Limitation
In the present study, stress distribution was observed only under static load. Cyclic loading, duration which is usually observed clinically has not been taken into consideration to evaluate stress distribution pattern and this study has been conducted on computer generated models with different properties incorporated into the models. Further studies have to be carried out clinically to evaluate the effect of stress in different crown-implant ratios under functional load.
Conclusion
This study was conducted to evaluate stress distribution in different crown–implant ratios and under different loading conditions in different bone densities. After loading, they were subjected to FE analysis using ANSYS software. The stress distribution pattern was observed in the form of colour coding bands. Within the parameters and limitations – of this finite element study, the following conclusions are made. Stress distribution was more in vertical loading than oblique loading in both crown heights of 7.5mm and 10mm. Stress distribution was more in D2 bone density than in D3 bone density and more stress distribution was also seen in commercially pure titanium screws than in titanium alloy screw.