Diabetes Mellitus (DM) is a clinical syndrome characterized by abnormalities in carbohydrate, lipid and protein metabolism that results in appearance of various complications such as retinopathy, nephropathy, neuropathy, cardiovascular symptoms etc. The patients with DM are also prone to dental complications, such as periodontal disease, dental caries, salivary dysfunction, dry mouth, oral mucosal diseases and oral infections [1]. Its prevalence is rapidly increasing as number was expected to rise to 300 million by year 2025, 366 million by the year 2030 [2]. Presently, the diagnosis of DM is done by measuring serum blood glucose levels by standardized methods which are invasive and traumatic to the patient both physically and psychologically [3]. Hence, the current method discourages the individuals from undergoing investigations resulting in lack of sufficient diagnosis thus attributing DM as a major cause of death worldwide [4]. So in the recent years, efforts have been made to replace blood investigations with other biological material sample that could be collected by noninvasive procedures [5]. Saliva has been put forth as a potential diagnostic tool for surveillance of disease due to its several advantages. It clearly offers an inexpensive, simple and easy to use screening method [6].
Due to hyperglycemia in DM patients, the glucose metabolic products cause changes in the microvasculature and basal membrane of salivary glands and other oral mucosal tissues. This leads to easier diffusion of glucose from serum to saliva and gingival crevicular fluid [1].
The word Amylase is derived from the Greek word "amylone" means starch, the main function of which is to cleave starch into smaller polysaccharides at the internal 1 to 4 α linkage during digestion. The insulin deficiency in Type 1 Diabetes Mellitus (T1DM) causes more disturbances in serum amylase than Type II Diabetes Mellitus (T2DM) [7]. Some authors suggested that serum amylase level were low and salivary amylase level were higher in DM patients [7,8].
In oral cavity, albumin is regarded as a serum ultra filtrate to the mouth and it may diffuse into the mucosal secretions. Immunosuppression, radiotherapy and DM are examples of conditions in which high concentrations of salivary albumin have been detected [9]. In last few years, more specific and sensitive techniques for detection of total salivary proteome have been used. Analysis and identification of albumin and globulin is important not only for understanding of oral pathophysiology, but it may be useful as a potential biomarker for systemic disease [1].
Changes in serum electrolyte concentrations can affect systemic disease. Saliva is saturated with calcium ions that play important role in enamel remineralization. The DM patients have demonstrated an increase in calcium concentration in saliva compared to the control group [1]. It is believed that a high concentration of calcium in saliva is a favorable indicator of oral health.
Limited studies have attempted to investigate association of salivary and serum correlation of glucose, amylase, proteins, calcium and phosphorus DM [2,10]. The need of the study was to explore the potential of saliva over serum as a marker in monitoring DM.
Materials and Methods
This comparative cross-sectional study included 120 subjects aged between 36-65 years including males and females, which were divided into; Group- I: 60 DM patients (Type 1 and Type 2) Group-II: 60 normal and healthy individuals as controls, who reported to regular outpatient department, Surendera Dental College and General Hospital, from June, 2015 up to January 2016. The sample size was determined depending upon the average new daily dental OPD presenting with medical conditions. The detailed case history and informed written consent was taken for each patient. The institutional ethical committee clearance was obtained to conduct the study. As there is no difference in the levels of salivary biomarkers in both types of DM therefore, considered under a single group.
Inclusion Criteria
The subjects with confirmed diagnosed cases of T1DM and T2DM (Study group).
The subjects without any history of DM and systemic diseases as confirmed by detailed history, not taking any systemic drug therapy, and whose serum glucose levels were within normal limits (Control group).
Exclusion Criteria
Patients with history of salivary gland surgeries.
Patients receiving radiotherapy, under long term local and systemic drug therapy except (oral hypoglycemics and insulin).
Patients with history of systemic illness, endocrinal and metabolic disorders affecting the serum/salivary glucose levels except DM.
Showing sample collection (a) Blood collection (b) Saliva collection (b) Armamentarium for clinical examination (d) Reagents used for study.
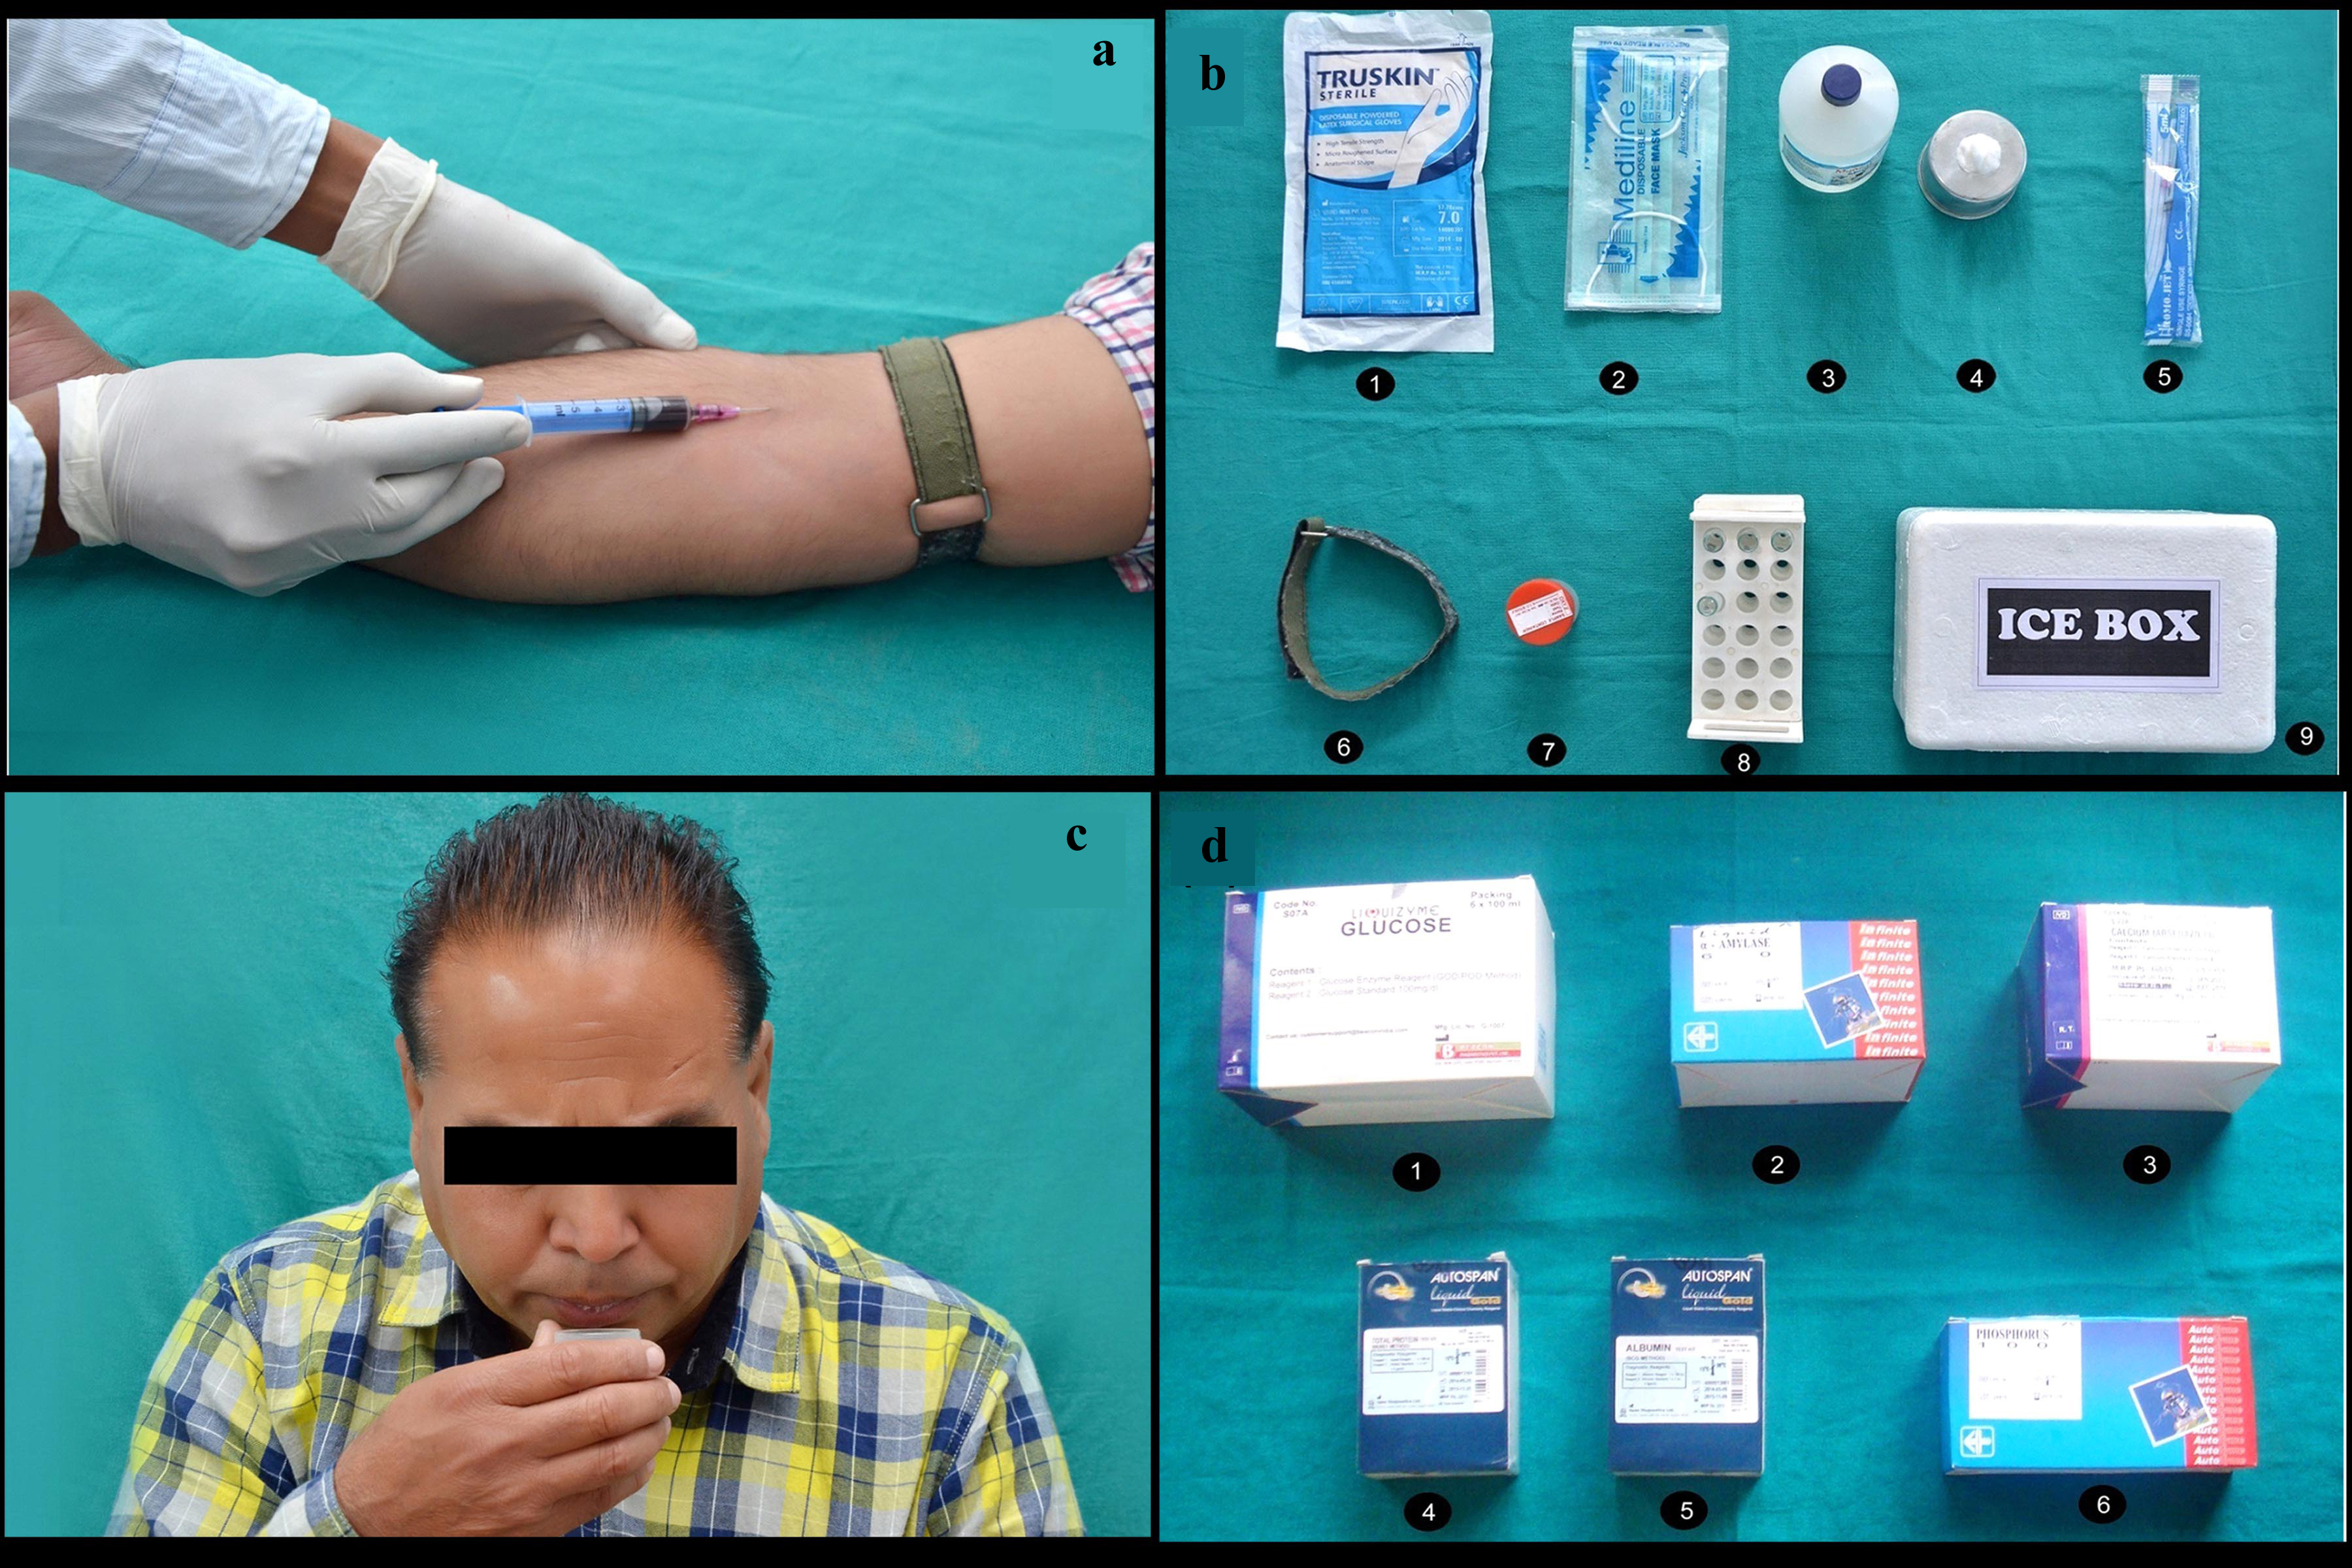
Serum: Fasting blood sample was withdrawn from both the patients suffering from DM and healthy volunteers, under aseptic conditions. Only 2ml of intravenous blood was obtained from median cubital vein of forearm with a 5ml syringe. Each sample was centrifuged at 2000 rpm for 5 minutes and the serum was separated and stored at 20oC. The serum thus obtained was used for further analysis.
Saliva: The patients were detailed about collection of saliva. They were advised to avoid food and fluid intake 2 hours prior to collection of saliva. The saliva was collected in resting position after rinsing the mouth with distilled water between 9.00am and 11.00am. The patient was instructed to spit in a sterile plastic container over a period of 5 minutes. The 2ml of unstimulated whole salivary sample was collected from both control and study groups, stored at 200C temperatures and sent to laboratory immediately. There it was centrifuged at 2000 rpm for 5 minutes using R8C centrifugal machine (REMI MOTORS LTD, MUMBAI. INDIA) and then supranents were subjected to analysis using incubator and AutochemNex Gen-autoanalyser.
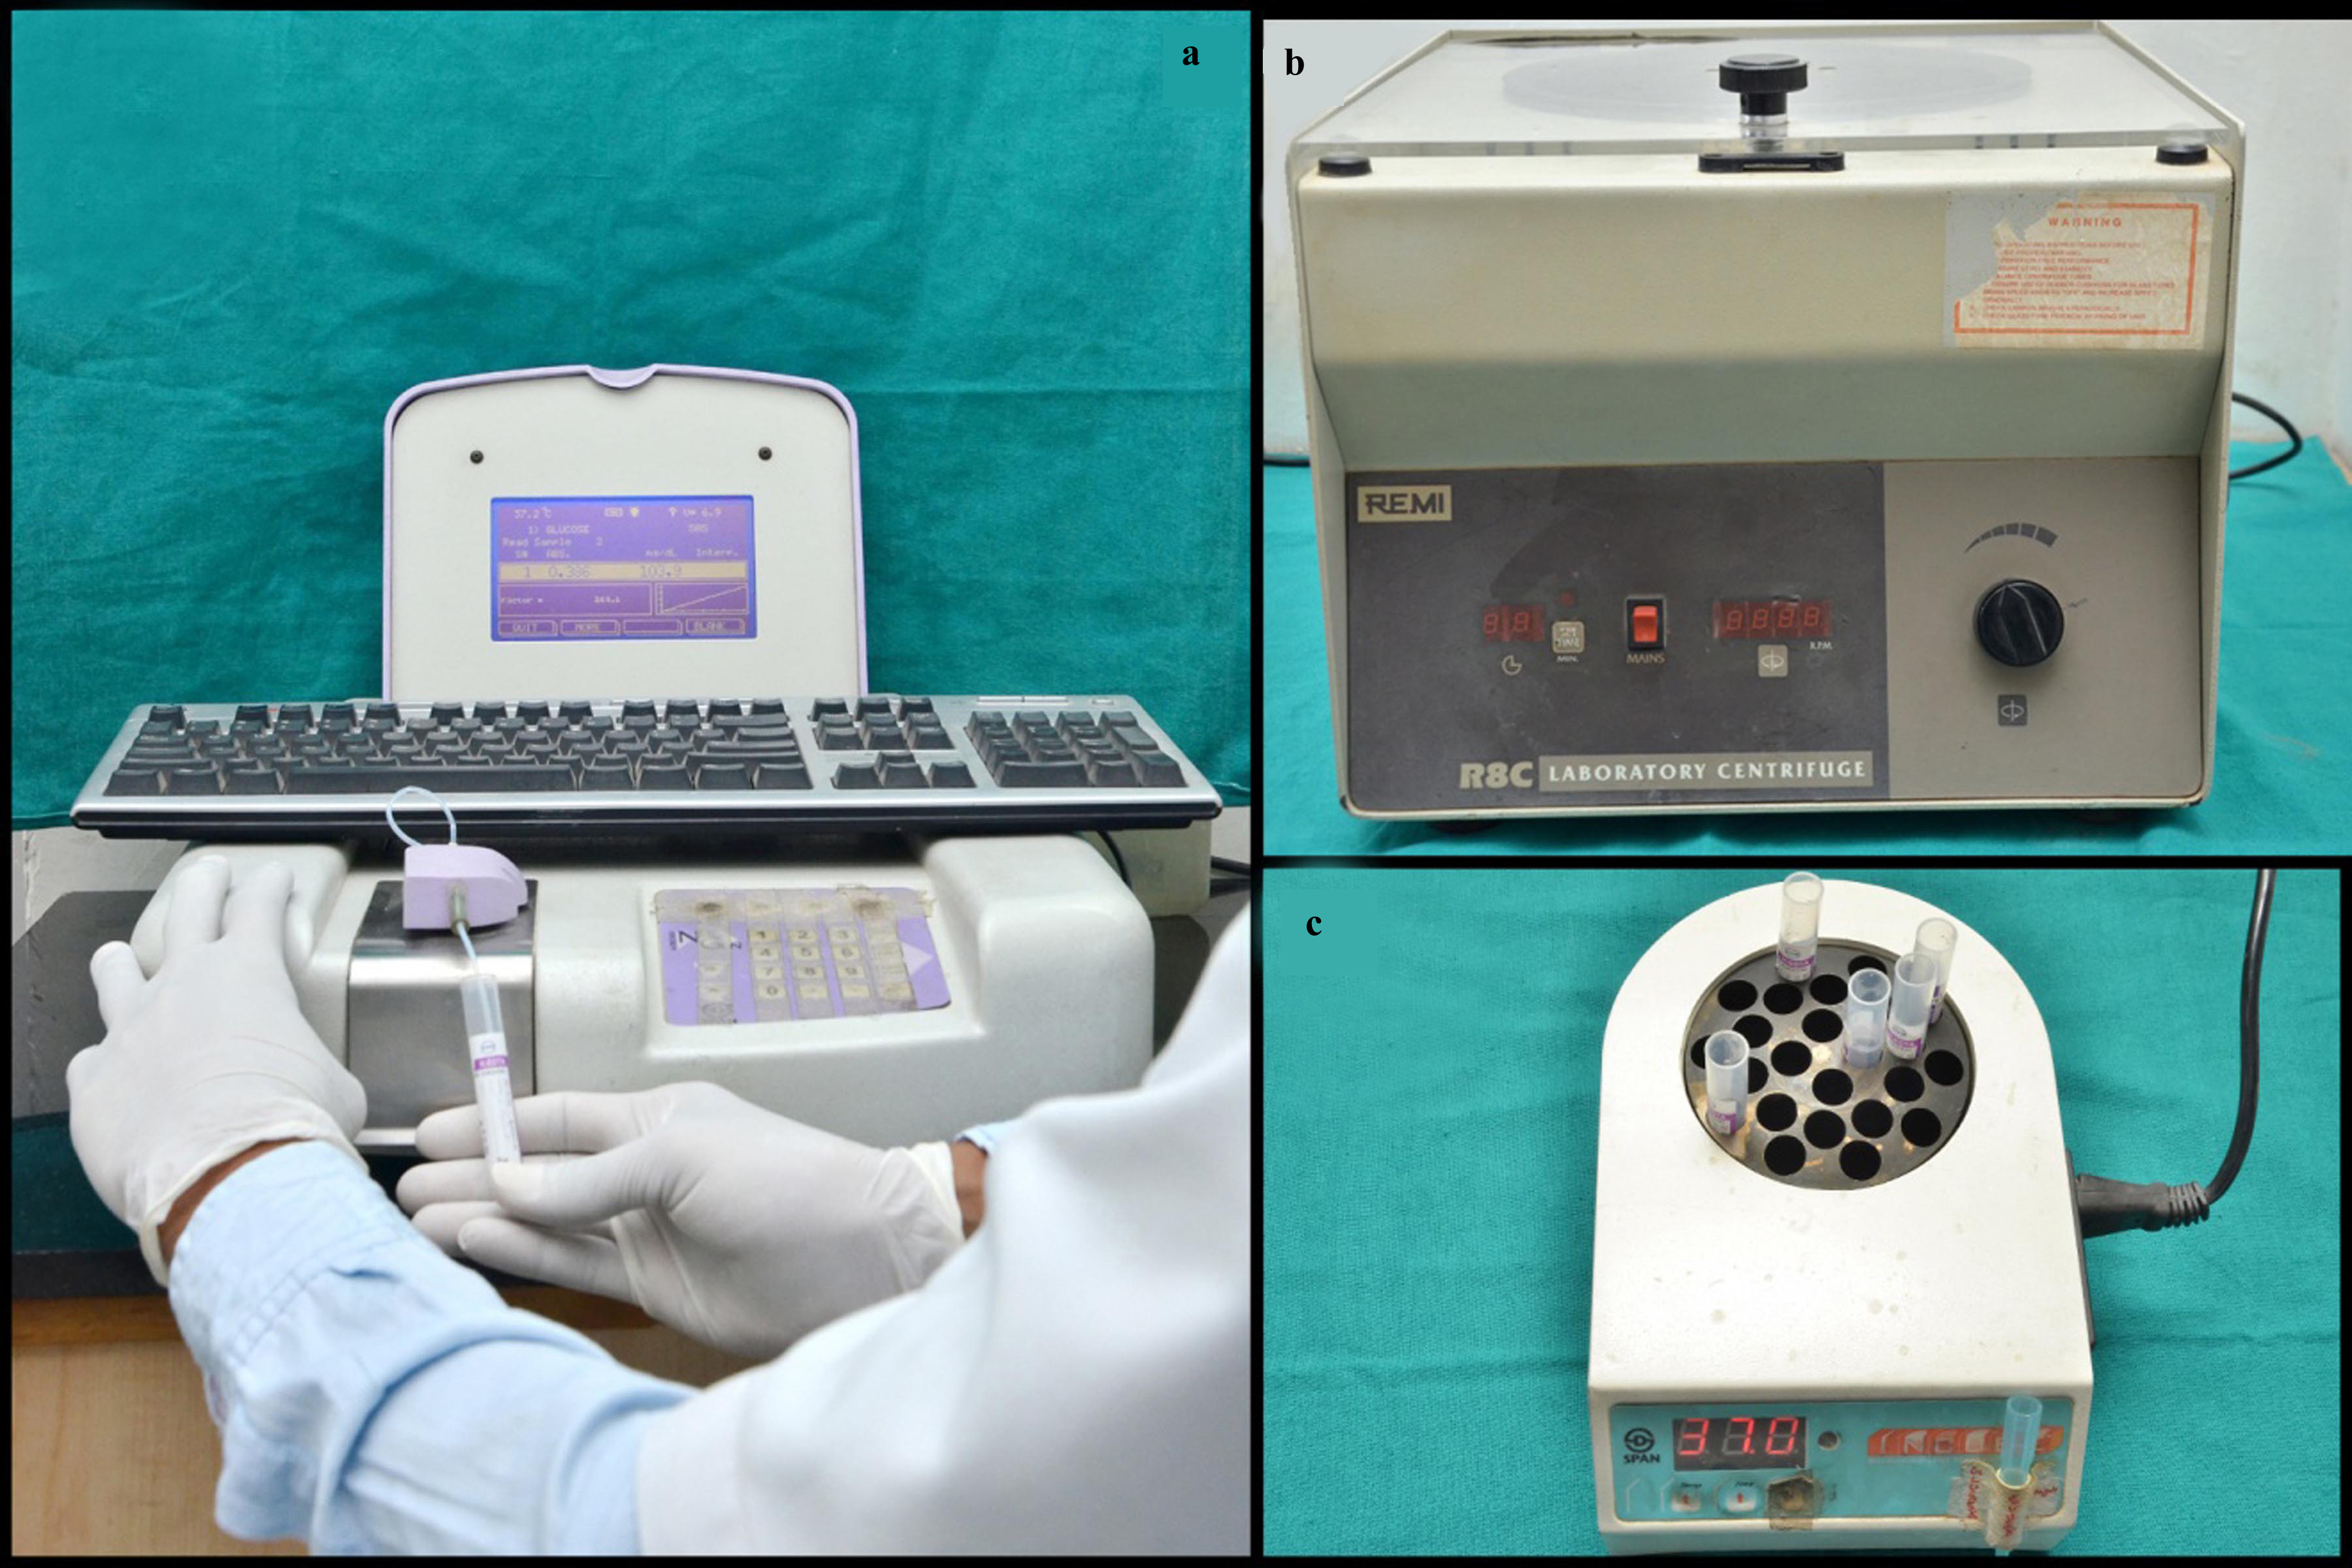
Laboratorial armamentarium (a) AutochemNex Gen-autoanalyser (b) R8C Centrifugal Machine (c) Incubator (Span Diagnostics Ltd, India).
Estimation of serum and salivary glucose: The serum and salivary glucose estimation was performed using glucose oxidase-peroxidase (GOD-POD) end-point method. The serum and saliva sample test tubes were labeled then 1,000μl of reagent solution was pipetted into each of 3 test tubes labelled ‘Blank’, ‘Standard’ and ‘Test’ of each serum and saliva sample. Then, 10μl of standard was added to the test tube marked as ‘Standard’, followed by 10μl of test sample to the ‘Test’ test tube. After mixing well, the test tubes were kept at 370C for 10 minutes in an incubator before aspiration. The reagent “Blank” was aspirated in analyzer first, followed by standard solution and the readings were noted, finally the test sample was aspirated and readings were noted again.
Estimation of serum and salivary amylase: The serum and salivary amylase activity was determined by the CNPG3 (2-Chloro-4-Nitrophenyl-α-Maltotrioside) substrate method (kinetic enzyme assay). The ability of α-amylase to catalyze the hydrolysis of starch to maltose is the principle used to estimate amylase. The serum and saliva sample test tube were labelled. They were diluted to 1 in 100 (1 part of serum and 99 parts of saline, 1 part of saliva and 99 parts of saline) and 25μl of serum and saliva sample were taken in test tubes then 1.0 ml of reagent solution was pipetted into each of 3 test tubes labelled ‘Blank’, ‘Standard’ and ‘Test’ of serum and saliva. These were analyzed in an automatic analyzer. Finally, the test sample was aspirated and the readings were noted.
Estimation of serum and salivary total protein: The estimation of serum and salivary total protein was performed by modified Biuret, end point method. The Cu++ ions in alkaline solution react with the peptide bonds of proteins to form blue-violet complex. The 5 or 6 peptide bonds of proteins complexed with one Cu++ ion and the proteins concentration is proportional to the color formed when measured at 546nm. The serum and saliva sample test tubes were labeled then 1,000μl of reagent solution was pipetted into each of three test tubes labeled ‘Blank’, ‘Standard’ and ‘Test’ of serum and saliva. Then, 10μl of standard was added to the test tube marked as ‘Standard’, followed by 10μl of test sample to the ‘Test’ test tube. These were mixed well and all the test tubes were kept in an incubator at 37°C for 10 min before aspiration. The reagent blank was first aspirated in the automatic analyzer, followed by standard solution, for which the reading was noted, and finally, the test sample was aspirated and the readings were noted.
Estimation of serum and salivary albumin: The estimation of serum and salivary total protein was performed by Bromocresol green, end point method. The albumin act as a cation and binds to anionic dye bromocresol green forming a green coloured complex, the absorbance of final colour is measured at 630 nm. The colour intensity of the complex is proportional to albumin concentration in the sample. The serum and saliva test tube were labelled, then 1,000μl of reagent solution was pipetted into each of three test tubes labelled ‘Blank’, ‘Standard’ and ‘Test’ in sample of serum and saliva Then, 10μl of standard was added to the test tube marked as ‘Standard’, followed by 10μl of test sample to the ‘Test’ test tube. These were mixed well and all the test tubes were kept in an incubator at 37°C for 10mins before aspiration. The reagent Blank was first aspirated in the analyzer, followed by standard solution, for which the reading was noted, and finally, the test sample was aspirated and the reading was noted.
Estimation of serum and salivary globulin: The estimation of serum and salivary globulin concentration were estimated by subtracting albumin concentration from total protein concentration. Then albumin / globulin concentration were calculated in both serum and saliva sample.
Estimation of serum and salivary calcium: It was done using calcium test kit (Arsenazo III), end point method. The calcium combined specifically with ArsenazoIe III at neutral pH to form blue purple complex. The intensity of colour was formed directly proportional to the amount of calcium present in the sample. The serum and saliva sample were labelled, then 1.0 ml of reagent solution was pipetted into each of three test tubes labelled ‘Blank’, ‘Standard’ and ‘Test’ for serum and saliva. Then, 20μl standard was added to the test tube marked as ‘Standard’, followed by 20μl of test sample to the ‘Test’ test tube. These were mixed well and all the test tubes were kept in an incubator at 37°C for 2mins before aspiration. Then calcium concentration was measured in both serum and saliva sample by automatic analyzer.
Estimation of serum and salivary phosphorus: The estimation of serum and salivary in organic phosphorus was done by using end point method. The ammonium molybdate reacts with phosphate ions in acidic medium to form phosphor molybdate complex and the amount is proportional to the inorganic phosphorus in the sample. The intensity of the complex was measured at 340nm. The serum and saliva sample were labeled, 1.0ml of reagent solution was pipetted into each of three test tubes labeled ‘Blank’, ‘Standard’ and ‘Test’ for serum and saliva. Then, 10μl standard was added to the test tube marked as ‘Standard’, followed by 10μl of test sample to the ‘Test’ test tube. These were mixed well and all the test tubes were kept in an incubator at 37°C for 5mins before aspiration. Then inorganic phosphorus concentrations were measured in both serum and saliva sample by automatic analyzer.
The values thus obtained were tabulated and subjected to statistical analysis using SPSS software version 20 (Microsoft Corporation Inc., Chicago, IL, USA). The paired and unpaired t-test and Pearson Coefficient correlation (p-value) was determined between salivary and serum biomarkers.
Results
In the present study, 120 subjects were investigated out of which 60 were DM subjects (41 males and 19 females) (9-IDDM and 51-NIDDM) and 60 were non-diabetic subjects (32 males and 28 females). The male to female ratio was found to be 2.16 for DM (Group I) and 1.14 for non-diabetics (Group II). The age ranges from 36-65 years for both groups with mean age (52.32 ± 8.05years) for Group I and (48.33 ± 7.3years) for Group II subjects. The significant correlation was found between both genders and two study groups (p<0.05) [Table/Fig-3].
Age and gender distribution between Group I and Group II.
| Variable | Group I | Group II | p-value |
|---|
| Males | 41(68.3%) | 32(53.3%) | 0.092NS |
| Females | 19(31.7%) | 28(46.7%) | |
| M:F | 2.16 | 1.14 | |
| Age + SD(years) | 52.32 ± 8.05 | 48.33 ± 7.30 | 0.005* |
NS: p>0.05; Not Significant; *p<0.05; Significant
In the DM patients, the mean serum glucose value was found to be 211.50 ± 43.82 ml/dl while mean salivary glucose was 14.10 ± 6.99 ml /dl. In non diabetics the mean serum glucose level was 88.81 ± 11.29 mg/dl while mean salivary glucose level was found to be 5.87 ± 2.42 mg/dl. On statistical analysis significant correlation (p=0.018) was found between serum and salivary glucose level in Group I [Table/Fig-4] and insignificant correlation (p=0.349) was found between same parameters in Group II [Table/Fig-5]. The comparison of salivary glucose and serum glucose levels between Group I and Group II showed a highly significant correlation (p <0.001) [Table/Fig-6,7]. The mean amylase level was found to be higher in saliva as compared to serum in both study groups [Table/Fig-4,5]. The correlation between serum and salivary amylase was found to be significant (p=0.023) in Group I [Table/Fig-4], while the correlation was found insignificant in Group II (p=0.100) [Table/Fig-5]. The comparison of salivary amylase levels between Group I and Group II showed a significant correlation (p= 0.003) [Table/Fig-6] where as serum amylase shows insignificant correlation between both study groups (p= 0.441) [Table/Fig-7].
Distribution and comparison of serum and saliva components for Group I.
| Parameters | SerumMean ± SD(mg/dl) | SalivaMean ± SD(mg/dl) | Pearson Coefficient correlation (r) | p-value |
|---|
| Glucose | 211.50 ± 43.82 | 14.10 ± 6.99 | 0.303 | 0.018* |
| Amylase | 79.86 ± 16.23 | 1671.42 ± 569.86 | 0.293 | 0.023* |
| Total Protein | 6.65 ± 0.84 | 1.33 ± 1.11 | 0.435 | 0.001* |
| Albumin | 3.91 ± 0.61 | 0.78 ± 0.63 | 0.283 | 0.029* |
| Globulin | 2.74 ± 0.47 | 0.55 ± 0.60 | 0.273 | 0.035* |
| A/G | 1.47 ± 0.34 | 2.05 ± 1.29 | 0.020 | 0.879NS |
| Calcium | 7.17 ± 0.91 | 10.06 ± 2.76 | -0.088 | 0.501NS |
| Phosphorous | 3.68 ± 0.65 | 13.75 ± 4.45 | 0.199 | 0.127NS |
Paired t-test; NS: p>0.05; Not Significant; *p<0.05; Significant; **p<0.001; Highly Significant; r=Pearson Correlation Coefficient
Distribution and comparison of serum and saliva components for Group II.
| Parameters | SerumMean ± SD(mg/dl) | SalivaMean ± SD(mg/dl) | Pearson coefficient correlation value (r) | p-value |
|---|
| Glucose | 88.81 ± 11.29 | 5.87 ± 2.42 | 0.123 | 0.349NS |
| Amylase | 77.67 ± 14.88 | 1397.59 ± 415.97 | 0.214 | 0.100NS |
| Total Protein | 6.35 ± 0.76 | 1.36 ± 0.81 | -0.019 | 0.887NS |
| Albumin | 3.81 ± 0.54 | 0.61 ± 0.41 | -0.339 | 0.008* |
| Globulin | 2.54 ± 0.59 | 0.75 ± 0.54 | 0.334 | 0.009* |
| A/G | 1.61 ± 0.59 | 1.20 ± 0.93 | 0.131 | 0.324NS |
| Calcium | 7.52 ± 0.97 | 7.73 ± 2.78 | -0.296 | 0.022* |
| Phosphorous | 3.96±0.91 | 8.39 ± 1.95 | 0.087 | 0.508NS |
Paired t test; NS: p > 0.05; Not Significant; *p<0.05; Significant; **p<0.001; Highly Significant; r=Pearson coefficient correlation
Distribution and comparison of salivary components between Group I & II.
| Parameters | Group I(mg/dl) | Group II(mg/dl) | p -value |
|---|
| Glucose | 14.10 ± 6.99 | 5.87 ± 2.42 | <0.001** |
| Amylase | 1671.42 ± 569.86 | 1397.59 ± 415.97 | 0.003* |
| Total Protein | 1.33 ± 1.11 | 1.36 ± 0.81 | 0.873NS |
| Albumin | 0.78 ± 0.63 | 0.61 ± 0.41 | 0.078NS |
| Globulin | 0.55 ± 0.60 | 0.75 ± 0.54 | 0.058NS |
| A/G | 2.05 ± 1.29 | 1.20 ± 0.93 | <0.001** |
| Calcium | 10.06 ± 2.76 | 7.73± 2.78 | <0.001** |
| Phosphorous | 13.75 ± 4.45 | 8.39 ± 1.95 | <0.001** |
Unpaired t-test; NS: p > 0.05; Not Significant; *p<0.05; Significant; **p<0.001; Highly Significant
Distribution and comparison of salivary components between Group I & II.
| Parameters | Group I(mg/dl) | Group II(mg/dl) | p -value |
|---|
| Glucose | 211.50 ± 43.82 | 88.81 ± 11.29 | <0.001** |
| Amylase | 79.86 ± 16.23 | 77.67 ± 14.88 | 0.441NS |
| Total Protein | 6.65 ± 0.84 | 6.35 ± 0.76 | 0.047* |
| Albumin | 3.91 ± 0.61 | 3.81 ± 0.54 | 0.342NS |
| Globulin | 2.74 ± 0.47 | 2.54 ± 0.59 | 0.048* |
| A/G | 1.47 ± 0.34 | 1.61 ± 0.59 | 0.109NS |
| Calcium | 7.17 ± 0.91 | 7.52 ± 0.97 | 0.042* |
| Phosphorous | 3.68 ± 0.65 | 3.96 ± 0.91 | 0.054NS |
Unpaired t-test; NS: p >0.05; Not Significant; *p<0.05; Significant; **p<0.001; Highly Significant
On estimating total protein value in two fluids in Group I and Group II, the mean total protein level was found to be higher in serum as compared to saliva [Table/Fig-4,5]. On statistical analysis significant correlation was found between serum and salivary total protein level in Group I (p= 0.001) [Table/Fig-4] while the results showed insignificant correlation between same parameters in Group II (p=0.887) [Table/Fig-5]. The mean serum albumin and globulin levels were found to be 3.91 ± 0.61and 2.74 ± 0.47 ml/dl respectively in Group I patients [Table/Fig-4] while the values of same parameters were recorded less in Group II [Table/Fig-5]. The mean salivary albumin and globulin levels were found to be 0.78 ± 0.63 and 0.55 ± 0.60 ml/dl respectively in Group I patients [Table/Fig-6] while the values of salivary albumin was found to be less and salivary globulin was noted more in Group II [Table/Fig-7]. The A/G ratio was found to be higher in serum of Group II patients compared to Group I while the ratio was found to be lower in saliva of Group II than Group I [Table/Fig-4, 5]. The correlation between serum and salivary mean total protein value in Group I was found to be significant (p=0.001) [Table/Fig-4] while the correlation of the same parameters in Group II was found to be insignificant (p=0.887) [Table/Fig-5]. The significant correlation was found between serum and salivary albumin levels in Group I (p=0.029) and Group II (p=0.008) [Table/Fig-5]. The significant correlation was found between serum and salivary globulin levels in Group I (p=0.035) and Group II (p=0.009) [Table/Fig-5]. On intergroup comparison of salivary parameters, insignificant correlation was found for total protein, albumin, and globulin levels (p>0.05) [Table/Fig-6] while intergroup comparison of same serum parameters showed significant correlation for total protein and globulin level (p<0.05) and insignificant correlation for albumin and A/G ratio [Table/Fig-7].
The mean value of serum and salivary calcium levels in Group I were found to be 7.17 ± 0.91 and 10.06 ± 2.76 mg/dl respectively [Table/Fig-1], while the values of same parameters in Group II were found to be 7.52 ± 0.97 and 7.73 ± 2.78 mg/dl respectively [Table/Fig-6]. The Pearson coefficient correlation was found be significant (p<0.05) for serum and salivary calcium levels in both groups [Table/Fig-6,7].
The mean value of serum phosphorus was found to be 3.68 ± 0.65 mg/dl in diabetics which is lesser than that of controls (3.96 ± 0.91) [Table/Fig-7] whereas the value of salivary phosphorus was found to be higher in DM patients than controls [Table/Fig-6]. The insignificant correlation was found between serum and salivary phosphorus levels in both the groups (p>0.05) [Table/Fig-4, 5]. The inter group comparison showed a highly significant correlation (p< 0.01) in case of salivary phosphorus levels [Table/Fig-6] whereas the correlation was found insignificant with respect to serum phosphorus levels [Table/Fig-7].
Discussion
DM is a group of chronic diseases characterized by insulin deficiency, cellular resistance to insulin action or both which results in hyperglycemia and other related metabolic disturbances [2]. In the present study the fasting salivary glucose levels was found to be higher in Group I (DM patients) than Group II (controls); the difference was statistically highly significant (p<0.001). The results were in accordance with previous studies [11,12]. However Ficara et al., and Marcheti et al., found no significant difference of salivary glucose among diabetics and healthy individuals [13,14]. The elevated salivary glucose levels are due to diabetic membranopathy, which leads to leakage across the basement membrane and raised percolation of glucose from blood to saliva [15]. Also there was significant correlation observed between serum and salivary glucose levels in DM patients and no statistical correlation between same parameters was observed among non-diabetic individuals in present study. Similar to our study, few studies found a positive correlation between serum and salivary glucose levels in DM patients [16,17]. However in contrast to our study, other trials on DM patients could not establish a correlation between salivary and serum glucose [18,19]. This difference may be due to different methodology and design of their study and the fact that subjects evaluated in their studies were not fasted and it was not clear what food products had been consumed by subjects within the two hours prior to sampling; whereas subjects were fasted in our study.
The salivary α-amylase levels of whole saliva in the present study showed significantly higher values in diabetics than in non-diabetics (p=0.003). There is considerable disagreement in the literature about salivary amylase activity in DM patients; whereas others have reported that salivary amylase concentration from diabetics is higher [20,21]. Lopez et al., found it lower while Tenouvo J et al., reported it same in diabetics and non-diabetics [11,22]. These differences may be attributed due to difference to stress levels, hormonal and metabolic changes in DM patients compared to non-diabetics. Also the significantly higher level of α-amylase was found in saliva than serum in diabetics in the present study. The results were in accordance with Malathi L et al., studies [23]. It has been suggested that low serum amylase levels in DM patients might be associated with an impaired insulin action due the insulin resistance and or inadequate insulin secretion.
The present study results showed significantly increased levels of salivary total proteins when compared with serum total proteins in DM patients as reported by Panchbhai et al., in the controlled diabetic group [15]. The greater micro-organism activity or proteins of periodontal origin can be the cause for increased salivary proteins. Few studies have attributed the high levels of total salivary proteins than serum in DM patients due to extra proteins added to saliva derived from the gingival fluid by active periodontal disease activity [23]. As proposed by Mandel, increased basement membrane permeability, which is often associated with DM, is one of the possibilities for the increased passage of proteins from the exocrine glands into their secretions [24]. The insignificant difference was found in the levels for total salivary proteins concentration in diabetics and control groups in present study. The similar results were obtained in Tenovuo J et al., studies [22], whereas lower values was found by Streckfus et al., [25] and higher values were found by Belazi et al., in their study [17]. These differences could be explained by the fact that the different studies examined DM patients in different disease stages, different method of collecting saliva, diurnal variation, speed and duration of centrifugation.
In the oral cavity, albumin is regarded as a serum ultra filtrate to the mouth, and it may diffuse into the mucosal secretions. According to the results of the present study, no significant difference in salivary albumin was found between DM patients and control group (p=0.078), which matches the results of Vaziri PB et al., studies and Belazi et al., [9,17]. The results of the studies of Ben-Aryeh et al., and Dodd’s et al., showed significant higher level of salivary albumin in DM patients than controls [19,26]. They suggested that, albumin; as a serum protein is substantially increased like lactoferrine, with acute inflammation of the salivary glands. This suggest that low grade infection of the salivary glands causing increased leakage of serum proteins into the saliva that is a common finding in DM patients. Also the present study showed slightly higher values of serum albumin in DM patients (3.91 ± 0.61 mg/dl) than controls (3.81 ± 0.54 mg/dl). The results were in accordance with other studies [27,28].
In the present study the salivary globulin level was noted decreased in DM patients than controls. This may be due to decreased migration of immunoglobulin in saliva as the result of direct inhibition of globulin by cytokines. The results were in contradiction to Hasan HR et al., study where the authors reported increase in the salivary globulin levels [29]. Also our study showed that higher mean serum globulin levels in diabetics than non-diabetics. The similar results were noted by Koj A et al., and Gruys E et al., [30,31]. The increased serum globulin concentration occurs in DM patients due to loss of the normal feedback inhibition of gluconeogenesis in the liver, this lead to increased breakdown of fats and proteins and conversion of glucogenic amino acids to glucose. Also the present study showed that salivary A/G ratio was statistically higher in diabetic subjects when compared with controls, the results were in accordance with Gazy Y et al., studies [32].
In Group I patients, the mean serum calcium was significantly lower than the control group, similar results were obtained by AbouSeif MA et al., [33], Moreira AR et al., in their studies [34]. The serum calcium is decreased because of decreased insulin leading to its stimulatory action on proliferation of osteoblast and calcium homeostasis impairment. The increase glucose also increase urinary excretion of calcium and phosphorus which is proportional to the degree of glucosuria [35]. Also in the present study, the salivary calcium levels were found significantly higher (p<0.001) in diabetics than non-diabetics, the results were similar as Lopez ME et al., studies whereas Shirzaiy M et al., found no significant difference of salivary calcium levels between two groups [1]. The reason of increase in salivary calcium in DM patients is due to reduction in salivary flow rate, or with an increase of the concentration of specific proteins which make special bonds with calcium phosphate.
This study demonstrated a significantly high concentration of salivary phosphorus in DM patients compared to controls. Similar results were seen by Sultan E et al., studies [35]. This might be due to reduction in salivary flow and release of binded phosphorus into the saliva from the degraded periodontal proteins in DM patients. Also the serum phosphorus levels were found less in Diabetics in the present study, whereas Mohammed MK et al., [36,37] found significantly higher levels of serum phosphorus and calcium in their studies. The insulin action is stimulated by vitamin D either by enhancing the expression of insulin receptors thereby increasing the responsiveness of insulin for glucose transport or indirectly by regulating extracellular cytoplasmic calcium levels [38]. The comparison of the results with previous studies was done [Table/Fig-8].
Comparison of various studies for salivary parameters in diabetic patients.
| Sr. No | Authors | Year | Total Sam-ple | SalivryGlucose(mg/dl) | SalivaryAmylase(mg/dl) | Salivary Total Protein (mg/dl) | SalivaryCalcium(mg/dl) | Salivary Phos-phorus(mg/dl) |
|---|
| 1. | Moreira et al., [34] | 2009 | 60 | - | - | - | 14.71 ±8.1 | - |
| 2. | Vascon-celoset al., [39] | 2010 | 80 | 14.03-16.76 | - | - | - | - |
| 3. | Al-Rawi et al., [40] | 2010 | 60 | - | - | 243.06±111.63 | 0.77±0.38 | 3.76±0.65 |
| 4. | Panchbhai et al., [15] | 2010 | 120 | 8.09±6.4 | - | 90.01±44.22 | - | - |
| 5. | Iqbal et al., [41] | 2011 | 60 | 15.60 | - | - | 3.73 | - |
| 6. | Shirzaii et al., [42] | 2012 | 50 | - | - | - | 9.2±2.3 | 12.7±4.6 |
| 7. | Prathibha et al., [10] | 2013 | 60 | 17.31± 2.05 | 19.20±1.8 | 877.29 ± 603.84 | 4.22±0.12 | - |
| 8. | Azizi et al., [43] | 2014 | 150 | 1.4±0.2 | - | - | - | - |
| 9. | Indira et al., [2] | 2015 | 40 | 8.45 ± 4.59 | 107.66 ±28.60 | 91.80 ± 6.61 | - | - |
| 10 | Present study | 2016 | 120 | 14.10 ± 6.99 | 1671.42 ± 569.86 | 1.33 ± 1.11 | 10.06 ± 2.76 | 13.75 ±4.45 |
Limitation
The main limitation of the study was the small sample size, which definitely calls for a more extensive and large sample size research to substantiate the usefulness of saliva as diagnostic marker in DM. Also HbA1C (glycosylated hemoglobin) level would have been better for checking the glycemic control of the patients.
Conclusion
The highly significant correlation was found between serum and salivary levels of glucose, amylase, total proteins, albumin and globulin in DM patients while on intergroup comparison, significant correlation was found between diabetics and non-diabetics for salivary glucose, amylase, calcium and phosphorous. Hence, present study will add new dimensions and lay the foundation for further research on large populations in making use of salivary biochemical parameters (glucose, amylase, calcium, phosphorus) for screening, diagnosis and monitoring of DM to blood.
NS: p>0.05; Not Significant; *p<0.05; Significant
Paired t-test; NS: p>0.05; Not Significant; *p<0.05; Significant; **p<0.001; Highly Significant; r=Pearson Correlation Coefficient
Paired t test; NS: p > 0.05; Not Significant; *p<0.05; Significant; **p<0.001; Highly Significant; r=Pearson coefficient correlation
Unpaired t-test; NS: p > 0.05; Not Significant; *p<0.05; Significant; **p<0.001; Highly Significant
Unpaired t-test; NS: p >0.05; Not Significant; *p<0.05; Significant; **p<0.001; Highly Significant