Knowledge of facial growth velocity and percentage of facial growth remaining is mandatory for effective planning of growth interventions. This must be based on an individual assessment of the patient’s skeletal maturation.
The concept of optimal timing for dento-facial orthopedics is intimately connected to the identification of periods of accelerated growth which necessitates the orthodontist to commence procedures prior to the start of pubertal growth [1].
For optimal treatment planning for growth modification procedures, orthodontists tend to use these methods to assess the skeletal maturity level of the child which are, the chronological age, the dental development, height and weight measurements, sexual characteristics both primary as well as secondary, and skeletal age [2,3].
The Cervical Vertebrae Maturation (CVM) is one such method which is effective to analyze the adolescent growth peak of growing children, both in body height and mandibular size. This was first suggested by Lamparski and also by Franchi, Baccetti and Chen [4–7].
Chronological age in itself forms one of the crucial elements in determining the skeletal maturation of the individual and it has been shown that the start of pre-pubertal growth minimum and the peak pubertal growth has a strong correlation with the chronological age of the individual [8]. A study done by Ball et al., showed that the peak mandibular growth velocity in boys occurred at an average age of 14 years whilst the pre-pubertal growth minimum velocity started two years before this peak velocity which meant, around 12 years of age at an average [8]. Skeletal age is more a viable and reliable parameter to check maturation and the growth potential present during adolescence or pre-adolescence when planning orthodontic treatment.
The aim of the present study was to evaluate the concordance between three entities namely; cervical vertebra maturation, statural height and body weight with the chronological age of 12 years as measured in local population. The null hypothesis stated that there is no concordance between CVMI stages and physical parameters like statural height and body weight in 12-year-old children.
Materials and Methods
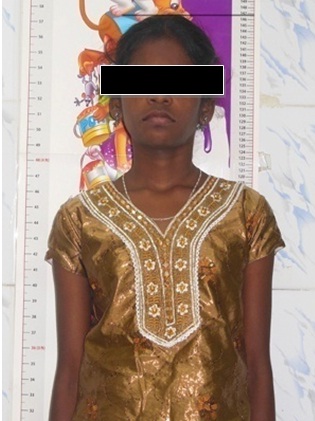
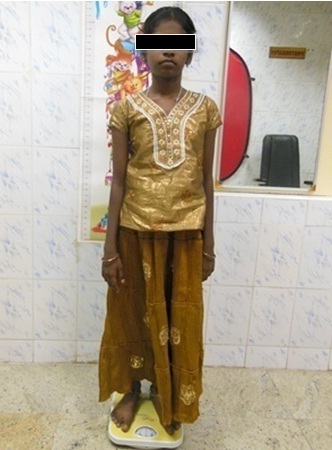
Study Sample: The sample size in this study was of 94 individuals (48 females and 46 males) of chronological age of 12 years selected from those who reported to the out-patient department seeking orthodontic treatment at Meenakshi Ammal Dental College, Chennai, Tamil Nadu, India. The study by design was cross-sectional and was done over a period of six months. Lateral cephalograms used in the study were taken as a part of the pre-treatment records for their orthodontic treatment. The chronologic age of the samples was recorded by their date of birth. Additional developmental data which included measurement of statural height and body weight [Table/Fig-1,2] was taken and then correlated with the Indian Council of Medical Research (ICMR) chart standards [Table/Fig-3,4] for optimal height and weight in Indian children [9].
Measurement of statural height in subject.
Measurement of body weight in subject.
Average height and weight of boys at different ages.
| AGE | WEIGHT (kg) | HEIGHT (cm) |
|---|
| Birth | 3.3 | 50.5 |
| 3 months | 6.0 | 61.1 |
| 6 months | 7.8 | 67.8 |
| 9 months | 9.2 | 72.3 |
| 1 year | 10.2 | 76.1 |
| 2 years | 12.3 | 85.6 |
| 3 years | 14.6 | 94.9 |
| 4 years | 16.7 | 102.9 |
| 5 years | 18.7 | 109.9 |
| 6 years | 20.7 | 116.1 |
| 7 years | 22.9 | 121.7 |
| 8 years | 25.3 | 127.0 |
| 9 years | 28.1 | 132.2 |
| 10 years | 31.4 | 137.5 |
| 11 years | 32.2 | 140.0 |
| 12 years | 37.0 | 147.0 |
Average height and weight of girls at different ages.
| AGE | WEIGHT (kg) | HEIGHT (cm) |
|---|
| Birth | 3.2 | 49.9 |
| 3 months | 5.4 | 60.2 |
| 6 months | 7.2 | 66.6 |
| 9 months | 8.6 | 71.1 |
| 1 year | 9.5 | 75.0 |
| 2 years | 11.8 | 84.5 |
| 3 years | 14.1 | 93.9 |
| 4 years | 16.0 | 101.6 |
| 5 years | 17.7 | 108.4 |
| 6 years | 19.5 | 114.6 |
| 7 years | 21.8 | 120.6 |
| 8 years | 24.8 | 126.4 |
| 9 years | 28.5 | 132.2 |
| 10 years | 32.5 | 138.3 |
| 11 years | 33.7 | 142.0 |
| 12 years | 38.7 | 148.0 |
(Source: Nutrient Requirements and Recommended Dietary Allowances for Indians, I.C.M.R. 1990) [9].
Inclusion Criteria: The inclusion criteria for the study were that the children be free of any serious illness or systemic disease. They should belong to the local Dravidian population. This would provide uniformity in the assessment of the growth pattern as the samples belonged to a particular set of population and also the age of the sample should be 12 years and a standard deviation of up to three months ahead was considered acceptable.
The exclusion criteria were mainly samples belonging to any other group of population and also who were medically compromised were not to be considered for the study.
Methodology
The lateral cephalograms were traced on 0.003 inch matte acetate tracing paper with a 0.5mm diameter lead pencil using a radiographic illuminator. The matte acetate tracing paper (0.003”) was secured to the radiographic films on one side and using 0.5mm lead pencil the tracings of the film were done which included three cervical vertebrae namely the densodontoid process – C2, the body of third cervical vertebrae – C3 and the body of the fourth cervical vertebrae – C4.
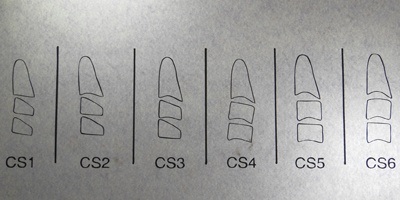
The CVM was evaluated using the method developed by Baccetti et al., [10], which assesses the maturational changes of the second, third and the fourth cervical vertebrae [Table/Fig-5]. This method makes use of both visual and cephalometric appraisals of morphological characteristics of the three cervical vertebrae that concerns two sets of variables that need to be checked for:
Different cervical vertebrae maturation stages and their interpretation.
| CERVICAL STAGING | INTERPRETATION |
|---|
| Cervical Stage 1 (CS1) | The lower borders of all the three vertebrae (C2-C4) are flat. The bodies of both C3 and C4 are trapezoid in shape (the superior border of the vertebral body is tapered from posterior to anterior).The peak in mandibular growth will occur on average two years after this stage. |
| Cervical Stage 2 (CS2) | A concavity is present at the lower border of C2 (in four of five cases, with the remaining subjects still showing a CS1). The bodies of both C3 and C4 are still trapezoid in shape.The peak in mandibular growth will occur on average one year after this stage. |
| Cervical Stage 3 (CS3) | Concavities at the lower borders of both C2 and C3 are present. The bodies of C3 and C4 may be either trapezoid or rectangular horizontal in shape.The peak in mandibular growth will occur during the year after this stage. |
| Cervical Stage 4 (CS4) | Concavities at the lower borders of C2, C3, and C4 now are present. The bodies of both C3 and C4 are rectangular horizontal in shape.The peak in mandibular growth has occurred within one or two years before this stage. |
| Cervical Stage 5 (CS5) | The concavities at the lower borders of C2, C3, and C4 still are present. At least one of the bodies of C3 and C4 is squared in shape. If not squared, the body of the other cervical vertebra still is rectangular horizontal.The peak in mandibular growth has ended at least one year before this stage. |
| Cervical Stage 6 (CS6) | The concavities at the lower borders of C2, C3, and C4 still are evident. At least one of the bodies of C3 and C4 is rectangular vertical in shape. If not rectangular vertical, the body of the other cervical vertebra is squared.The peak in mandibular growth has ended at least two years before this stage. |
The presence or absence of a growth related change in the vertebrae that is, a concavity at the inferior border of C2 (odontoid process), C3 and C4.
The change in shape of the body of the cervical vertebrae with the progressive ages, namely trapezoidal, rectangular horizontal, square and rectangular vertical. Accordingly the respective shapes observed in the lateral cephalogram were classified into six consecutive stages in CVM (CS1 to CS6).
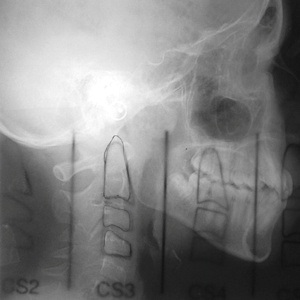
A custom made template [Table/Fig-6] was created out of lateral cephalograms of 12-year-old children who were a part of this study, each showing the different stages starting from CS1 to CS6.
Custom-made template that was prepared for the study.
It is necessary to mention here that, this template was used only for the assessment of the presence or absence of concavities in the lower borders of the vertebrae [Table/Fig-7], and not for assessing the change in their shape.
Use of the template to assess the vertebral changes in a particular case.
The statural height and body weight measured [Table/Fig-1,2] in the samples were compared with the chart provided by the ICMR [Table/Fig-3,4] [9]. Even though the World Health Organization (WHO) provided its standardized growth chart for children, our study preferred the use of ICMR chart as it was specific towards Indian children who present themselves as the samples for this study [9]. All radiographs were evaluated by the same operator and later verified by an independent evaluator to determine any inter-operator and intra-operator errors.
Results
The results showed that there was no statistically significant correlation between CVM stages and the weight noted in the total sample and the height in CS6 staging showed statistical significance [Table/Fig-8] in concordance to stages observed in CS1, CS2 and CS3 (p=0.047, p<0.050).
ANOVA for correlation between CVMI, height and weight in the total sample.
| | Sum ofSquares | df | Mean Square | F | Sig. |
|---|
| Height | BetweenGroups(CS1-CS6) | 836.224 | 5 | 167.245 | 2.353 | 0.047 |
| Within Groups | 6253.627 | 89 | 71.064 |
| Total | 7089.851 | 94 | |
| Weight | BetweenGroups(CS1-CS6) | 232.997 | 5 | 46.599 | 0.938 | 0.460 |
| Within Groups | 4371.037 | 89 | 49.671 |
| Total | 4604.035 | 94 | |
Statistical significance p<0.05
In girls, the heights showed statistical significance with the CVMI (p=0.012), exhibiting a progressive rise in the mean height from CS3 to CS6 which indicated a steady correlation of statural height with progressing maturity stages [Table/Fig-9]. There was significant correlation when comparing the heights in CS6 with that of Stages 1, 2 and 3(p=0.002, 0.008, 0.003).
ANOVA for correlation between CVMI, height and weight in girls.
| | Sum ofSquares | df | Mean Square | F | Sig. |
|---|
| Heighta | BetweenGroups(CS1-CS6) | 801.488 | 5 | 160.298 | 3.380 | 0.012 |
| Within Groups | 1991.825 | 42 | 47.424 |
| Total | 2793.313 | 47 | |
| Weighta | BetweenGroups(CS1-CS6) | 313.199 | 5 | 62.640 | 1.815 | 0.131 |
| Within Groups | 1449.254 | 42 | 34.506 |
| Total | 1762.453 | 47 | |
a.Sex=Girl; p<0.05 statistically significant.
[Table/Fig-9] shows the ANOVA results for mean heights and weights of girls with their respective CVMI stages. [Note: The groups mentioned in the table are the samples who belonged to different stages of cervical maturation (CS), who were then subdivided according to the stages that they belonged (ranging from CS1 to CS6) at the time of measurement for the sake of statistical purpose and they were then correlated with their respective height and weight]. This was done to analyse the correlation between an increased skeletal maturation to an increased physical built or vice versa. If for example, the subgroups belonging to CS5 or CS6 corresponded to an increase in height/weight measurements and similarly vice versa viz. a child showing CS1 or CS2 corresponding to decrease in height or weight in the samples belonging to those stages accordingly. In the present study we noticed that in the total sample, the children who belonged to CS6 category showed an increased height measurement. The ANOVA test was used so as to analyse the subtle variations as multiple variables were involved which are the height, weight and the CVM stage between the above mentioned groups and also within these groups.
The weights measured in both boys and girls did not have any significant correlation with the cervical vertebra maturational stages (p= 0.857 and 0.131).
The mean heights and weights were observed by the t-test and values obtained were then compared to with the ICMR chart [Table/Fig-10].
t-Test Mean height and weight of the boys and girls Group Statistics.
| Sex | N | Mean | Std.Deviation | Std.Error.Mean | p-value | t-value |
|---|
| Height | Boy | 46 | 143.6522 | 9.77063 | 1.44060 | 0.930 | 0.088 |
| Girl | 48 | 143.8125 | 7.70923 | 1.11273 |
| Weight | Boy | 46 | 38.6087 | 7.93159 | 1.16945 | 0.646 | 0.461 |
| Girl | 48 | 39.2813 | 6.12364 | 0.88387 |
The t-test was done to examine the mean height and weight observed in the boys and the girls sample to check for any variation.
The mean CVMI score observed in boys and girls were CS2 and CS3 respectively [Table/Fig-11].
T-Test Mean CVMI staging observed in boys and girls Group Statistics.
| Sex | N | Mean | Std.Deviation | Std.Error.Mean | p-value | t-value |
|---|
| CVMI Status | Boy | 46 | 2.1087 | 1.10007 | 0.16220 | 0.001 | 3.423 |
| Girl | 48 | 3.0208 | 1.45119 | 0.20946 |
The above given table shows the mean CVMI staging observed in the boys and girls respectively.
Discussion
The aim of the present study was to evaluate the concordance between three skeletal maturity indicators namely; cervical vertebrae maturation, statural height and body weight with the chronological age of 12 years as measured in the local population. Cervical vertebra development of the sample (CVMI) was evaluated by Franchi and Baccetti’s method [10].
The chronological age of all the samples taken was of 12 years. Previous studies associating chronological age with skeletal maturity were longitudinal in nature, thereby increasing the duration of the study. Hence, a study correlating chronological age had to be done in a cross-sectional manner and yet should be synchronous with the period of growth spurt of the children being analyzed.
The rationale for selecting the age 12 was that, while the girls generally reach their circum-pubertal peak by this age, the peak mandibular growth velocity in boys occurred at an average age of 14 years and the pre-pubertal growth minimum velocity started two years before this peak velocity, which meant around 12 years of age at an average according to a study done by Ball et al., [8]. Additionally, the fact that the existence of all permanent teeth (except the third molars) in the oral cavity by the age of 12, in a sense, marks a point of transition from late mixed dentition to early permanent dentition thus indicating an impending spurt in the growth of the individual.
The statural heights of the samples were measured and so was their body weight [Table/Fig-1,2]. These were considered significant in our study owing to the numerous studies that were done previously which clearly define them to be maturity indicators. Studies showing concordance between statural height and skeletal maturity levels were done by Franchi, Helsing, Mitani and Sato [5,11–13]. Similarly, increased body weight does have a seemingly positive influence on the maturity levels which has been shown by some of the recent studies correlating Body Mass Index (BMI) percentile and skeletal maturation [14,15].
The CVMI obtained from the lateral cephalogram involved the tracing of C2, C3 and C4 over a custom-made template [Table/Fig-6] that was created for this study as mentioned. This was used purely for the assessment of the presence or absence of concavity in the lower borders [Table/Fig-7] and not to determine the change in shape. This was owing to the fact that according to a study done by Nestman, Perinetty and Cericato et al., [16–18], they elucidated that whilst the changes in the lower border concavities were reproducible by multiple operators, the weakness of the CVM method lie, in part, from difficulty in classifying the vertebral bodies of C3 and C4 as trapezoidal, rectangular horizontal, square, or rectangular vertical.
In girls, the heights showed statistical significance with the CVMI [Table/Fig-9], exhibiting a progressive rise in the mean height from CS3 to CS6 which indicated a steady correlation of statural height with progressing maturity stages. This is in concordance with the study done by Franchi et al., [5]. The weights measured in both boys and girls did not have any significant correlation with the cervical vertebra maturational stages.
The mean height for the boys and girls mostly coincided with the optimal height and weight values as given by the ICMR, thus satisfying their criteria for optimal height and weight for children of age 12 (ICMR 1990) [9] [Table/Fig-3, 4,10].
The mean CVMI score observed in boys and girls were CS2 and CS3 respectively [Table/Fig-11], which was clearly suggestive of the fact that in our study, the girls had attained the stage of pubertal peak whilst the boys lay in the pre-pubertal stage of maturation at the chronological age of 12 on an average, which was synchronous with numerous studies that have been done before indicating that girls mature faster than boys at any given point in time during puberty [8].
The BMI was calculated in both boys as well as girls to analyse the number of samples falling under the obese category (BMI=30 and above). We observed that none of our samples had a BMI of 30 or above, hence, there was no concomitant correlation with the maturity levels. This corroborated with studies done by Giuca et al., and Mack et al., [14,15] showing a direct correlation with increased BMI towards advanced skeletal maturity levels in children.
The null hypothesis has been rejected partly owing to the positive concordance observed, between statural height and cervical vertebrae maturation stages and a lack of any significant concordance observed with respect to body weight and CVMI.
Limitation
The limitations of the study are that this study involved a single, specific group of population and hence, the results obtained through this study may not apply for all groups of people. Therefore, future studies must involve different cross sections and subjects of varied racial origin to analyse the subtle differences observed in their growth patterns.
Conclusion
The present study concludes that statural height as a variable has a definitive positive correlation in growing children, especially girls, on the higher scale of maturity as observed by the CVMI. This warrants an early intervention in terms of growth modification in these children. The next variable in question which is the body weight when in proportion to the statural height does not significantly alter the maturity levels, but an overweight child still needs to be attended to, with caution owing to the direct positive influence that increased BMI has on skeletal maturity. Lastly, CVMI as a skeletal maturity indicator seems to be very much reliable for the assessment of maturation alongside the above mentioned indicators viz. statural height and body weight, which also needs to be taken into account when one plans growth modification procedures.
(Source: Nutrient Requirements and Recommended Dietary Allowances for Indians, I.C.M.R. 1990) [9].
Statistical significance p<0.05
a.Sex=Girl; p<0.05 statistically significant.
The t-test was done to examine the mean height and weight observed in the boys and the girls sample to check for any variation.
The above given table shows the mean CVMI staging observed in the boys and girls respectively.