The World Health Organization has defined quality of life as human perception of their position in life taking into consideration the culture, values, goals, expectations, standards and their priorities. Therefore, the quality of life is subjective and cannot be observed by others. It is based on an understanding of the various aspects of life [1].
Most scientists concur that the concept of quality of life always involves several dimensions including; physical, psychological, social, symptoms of diseases and the relationship between these demission is really important [2]. Another scientist has believed that happiness and satisfaction is the main feature of the quality of life. In fact, these theorists recognize that people’s quality of life as a cognitive experience has shown to be associated with the “consent” of the important aspects of life and an emotional experience that is present with “happiness” [3]. Therefore, the individual’s quality of life is affected by their characteristics of the underlying social, cultural and environment [1,3].
There are several tools to measure quality of life, which include general and specific measurement tools [4–7]. The study of quality of life can be divided into two groups “produced theory” and “theory test.” The first group, attempt to clarify the concept of quality of life and the relationship between quality of life dimensions. While the second group, tested the assumptions that have been created in the first group in the target population. This creates the possibility of interoperability between the different groups [3,8].
Infertility can cause serious health and social problems. A study showed that infertility has a negative effect on the quality of life in infertile couples [9]. Another study reported that infertility affects a profound influence on the mental aspect. On the other hand, these disruptions can increase the duration of infertility [10].
Based on the results of studies, infertile women, especially in traditional societies are faced with the challenges of individual, familial, social, economical, depression and anxiety [11–13]. However, the emotional disorders and others adverse outcomes of infertile couples, can impact the treatment of this couple [14].
On the other hand, menopause is the end of the hope of motherhood. Menopausal women are experiencing some degree of shock, disbelief and feel sad [15]. Although the measurement of quality of life in infertile women plays an important role in the evaluation of health care service delivery systems, few studies were designed to evaluate the quality of life instrument in infertile women. Therefore, in the present study, we decided to design a valid and reliable instrument to assess quality of life in Iranian infertile women in postmenopausal period, to make a small step in the development of health care in this group.
Materials and Methods
This is a PhD thesis (Grant Number: 909279). In this study, we used a combination of both quantitative and qualitative research methods to create a valid quality of life instruments for Iranian infertile women in postmenopausal period. To access the instrument, we divided the process into three main stages including: instrument development, instrument validity and instrument reliability for 211 eligible participants.
Instrument Development
In the instrument development we used three main steps, including determining content domain, item generation and instrument construction [16]. Content domain is the content part related to the variables that is being measured [17]. In the present study, we used both the literature review and interviewing with the respondents for making content domain. The qualitative data collected in the interview with the respondents household with concept is a suitable method to determine instrument items [18–20]. Literature review is another method used for determining content domain [18].
In the second step of the instrument development, item generation developed based on the concept extracted from the content domain. In the third step, we did the instrument construction in which items were refined and organized in a suitable format and sequence. Therefore, the finalized items were collected in a usable form [21].
Instrument Validity
In the second stage of study instrument validity was done. Instrument was validated using face validity [22], content validity [23] and factor analysis [24].
Face Validity
The face validity answers this question whether an instrument apparently has validity for subjects, patients, and other participants. Therefore, determining the face validity should be considered as the first of instrument validity [25]. Both qualitative and quantitative methods were used to determine the face validity. In the quantitative determination, the level of difficulty, the relevancy and ambiguous of items were investigated by face to face interview with 10 experts. As well as, the researchers attempted to use the correct method for items. Use of the views of 10 experts and participants to check the quantitative face validity.
It will be asked to recognize the items they have for consideration as the most important for them. The grade of importance was a 5-point likert scale including very important (5), important (4), relatively important (3), slightly important (2), and unimportant. In quantities method, for calculation item impact score, the first is calculated percent of patients who scored 4 or 5 to item importance (frequency), and the mean importance score of item (importance) and then item impact score of instrument items was calculated by the following formula:
Item Impact Score = Frequency * Importance
If the item impact of an item is equal to or greater than 1.5 (which corresponds to a mean frequency of 50% and mean importance of 3 on the 5-point Likert scale), it is maintained in the instrument; otherwise, it is eliminated [26].
Content Validity
The content validity is one of the most important steps of instrument validity that used, the viewpoints of the panel of experts [27,28].
A combination of both quantitative and qualitative methods was used for content validity. In the qualitative content validity, content experts suggestion were adopted on observing grammar, using appropriate and correct terms, applying correct and suitable terms in items and suitable scoring [28].
However, in the quantitative content validity, used Content Validity Ratio (CVR). The CVR is an item statistic that is applied in the rejection or retention of specific items. In CVR 10 experts were asked to score each item from 1 to 3 in with a three-degree range of “not necessary, useful butnot essential, essential”. Greater levels of content validity represented that, greater numbers of experts agree. Lawshe (1975) provided CVR. Formula for CVR = (Ne − N/2)/ (N/2), in which the Ne presented the number of panelists indicating “essential” and N presented total number of panelists. The numeric value of content validity ratio is determined by Lawshe table.
Judgment on each item was made as follows:
When fewer than half of panelists stated “essential”, the CVR was negative.
When half of panelists stated “essential” and half do not, the CVR was 0.
When all of panelists stated “essential”, the CVR was computed to be 1.00 (it is adjusted to 0.99 for ease of manipulation).
When the number of panelists stated “essential” was more than half, but less than all, the CVR were between 0 and 0.99 [23,29]. Based on the Lawshe table, at least 62% CVR was determined as the content validity index for the present study.
Then a Content Validity Index (CVI) was computed for the instrument. The CVI is widely reported for content validity [30]. In this section we asked from experts to rate each instrument item in terms of clarity and its relevancy to the construct underlying study on a 4 point ordinal scale (1 = not relevant, 2 = somewhat relevant, 3 = quite relevant, 4 = highly relevant) (25). CVI was calculated both for I-CVIs and the scale-level (S-CVI). The I-CVI expressed the proportion of agreement on the relevancy of each item, which is between 0 and 1 [21].
Judgment on each item was made as follows:
If the I-CVI is higher than 79%, the item will be appropriate.
If it is between 70% and 79%, it needs revision.
If it is less than 70%, it is eliminated
The S-CVI was defined as “the proportion of total items judged content valid” [21] or “the proportion of items on an instrument that achieved a rating of 3 or 4 by the content experts” [17].
Factor Analysis
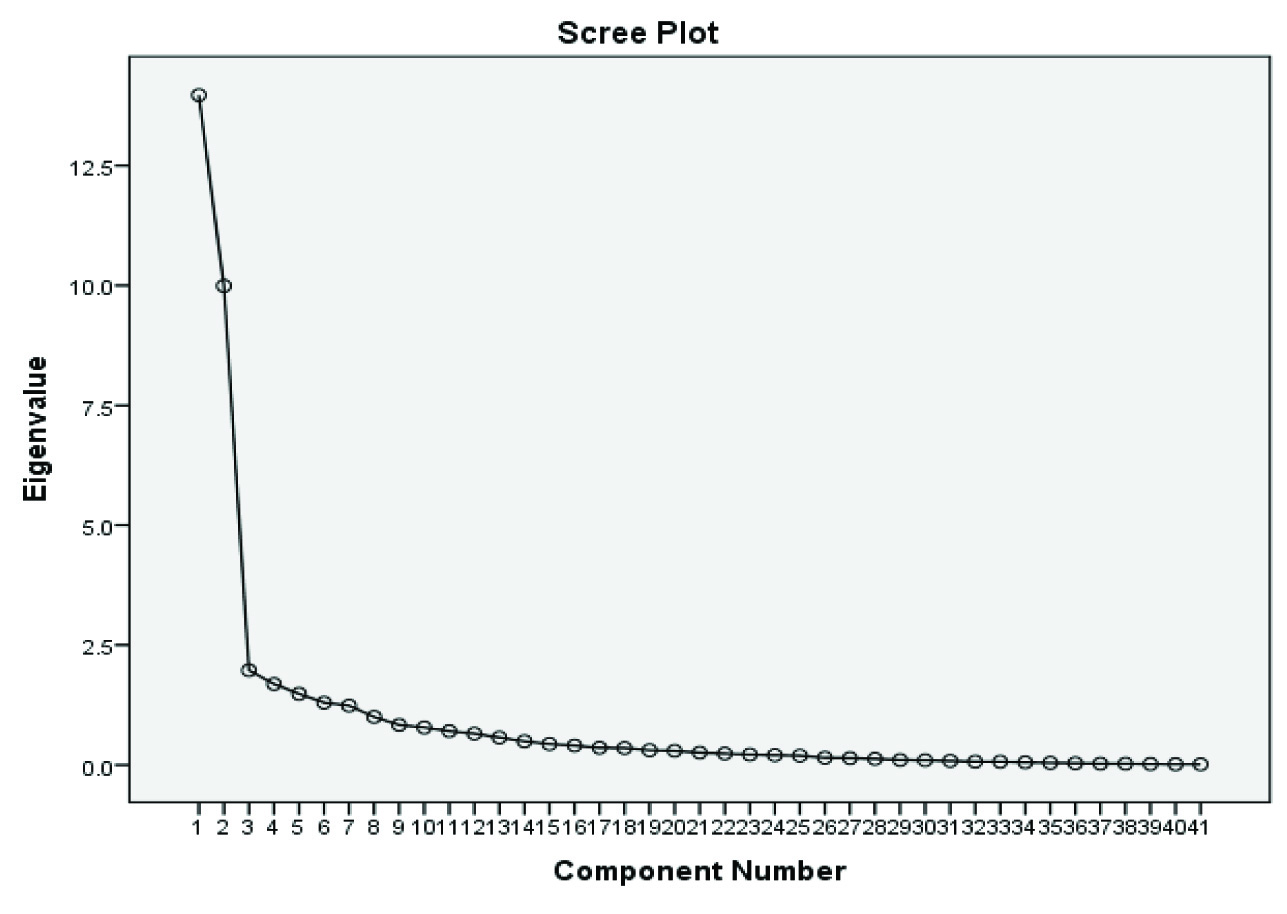
In the present study, we used factor analysis to determine the construct validity. Factor analysis was used to find groups of variables that had the highest correlation with each other. Factor analysis is a very important step in the design of new tools [31]. In the present study, the exploratory factor analysis was performed using sampling index Kaiser-Meyer-Olkin (KOM) and Cruet-Bartlett’s Test, principal component analysis and Varimax rotation. The Eigen Value and Scree Plot were used to determine the number of factors. A minimum 40% load requirement was considered to keep each factor extracted from factor analysis. Eigen Value more than 2 was considered.
Instrument Reliability
Finally, after determining the validity of items, the questionnaire of quality of life in infertile women in postmenopausal period was designed. Both internal consistency and test–retest reliability methods were used to confirm the reliability of the questionnaire. Cronbach’s alpha is the most common internal consistency measure, which is usually interpreted as the mean of all possible split-half coefficients [32]. The questionnaire was completed by 20 participants (except primary participants) and questionnaire internal consistency was determined using Cronbach’s alpha coefficient of 0.942. To investigate the questionnaire reliability the test–retest methods was used and questionnaire was completed by the same participants. Because the quality of life varies from time to time the questionnaire was completed after 10 days. Credibility, dependability, transferability and conformability of the data were checked for all qualitative data.
This study was undertaken with the approval of the Ethical Committee of the Ilam University of Medical Sciences. The aim of the study was described for all participants before the enrolment to the study.
Results
In the present study, the content domain of questionnaire we used was made by both, literature review and interviewing with the respondents participants. At this stage, was obtained 83 items in physical, psychological, religious, economic, social, sexual and social quality of life in infertile women during postmenopausal period, which indicated the quality of life (understanding of the situation in life, goals, expectations, communication needs with respect to the culture and value system) of infertile women during their postmenopausal life.
A 5 points Likert scoring was used to determine the participant’s level of attitude. So that considering the totally agree = 4, agree = 3, no comment =2, disagree=1 and strongly disagree= 0. Although some questions were assigned scores in reverse.
In the qualitative and quantitative face validity section, 25 items had item impact less than 1.5, therefore failure to obtain necessary score, they were excluded from the questionnaire.
In the content validity section, 17 items failure to obtain necessary score based on Lawshe formula. So were excluded from the questionnaire.
Factor analysis was done based on principal component analysis on 41 items. Items validity was determined using KMO index and Bartlett’s Sphericity test, on 41 Items. In this study KMO index values was 0.825 [Table/Fig-1].
Kaiser-Meyer-Olkin Measure and Bartlett’s Sphericity test of Sampling Adequacy of the questionnaire of the quality of life in infertile women during postmenopausal period.
| KMO and Bartlett’s Test |
|---|
| Kaiser-Meyer-Olkin Measure of Sampling Adequacy. | 0.835 |
| Bartlett’s Test of Sphericity | Approx. Chi-Square | 11116.250 |
| df | 820 |
| p- value | 0.000 |
Overall, 8 factors were extracted by factor analysis test. However, 67.38% of the total variance was explained by 4 factors, others 4 next factors explained the remaining 32.62% of the total variance. Totally, 34.01% of rotation variance was explained by first factor and 24.37% by second factor. The total variances explained by factors of questionnaire are presented in [Table/Fig-2,3]. In questionnaire internal consistency, 8 items had Cronbach’s alpha 0.942. The test–retest methods for questionnaire reliability a Cronbach’s alpha 0.978 was obtained.
The total variance explained by factors of the questionnaire of the quality of life in infertile women during postmenopausal period.
| Items | Initial Eigenvalues | Extraction Sums of Squared Loadings | Rotation Sums of Squared Loadings |
|---|
| Total | % of Variance | Cumulative % | Total | % of Variance | Cumulative % | Total | % of Variance | Cumulative % |
|---|
| 1 | 13.972 | 34.077 | 34.077 | 13.972 | 34.077 | 34.077 | 10.000 | 24.391 | 24.391 |
| 2 | 9.993 | 24.373 | 58.450 | 9.993 | 24.373 | 58.450 | 9.555 | 23.306 | 47.696 |
| 3 | 1.973 | 4.813 | 63.263 | 1.973 | 4.813 | 63.263 | 3.389 | 8.265 | 55.961 |
| 4 | 1.688 | 4.116 | 67.379 | 1.688 | 4.116 | 67.379 | 2.368 | 5.776 | 61.737 |
| 5 | 1.483 | 3.618 | 70.997 | 1.483 | 3.618 | 70.997 | 1.910 | 4.657 | 66.394 |
| 6 | 1.300 | 3.170 | 74.167 | 1.300 | 3.170 | 74.167 | 1.854 | 4.521 | 70.915 |
| 7 | 1.236 | 3.014 | 77.182 | 1.236 | 3.014 | 77.182 | 1.836 | 4.479 | 75.395 |
| 8 | 1.001 | 2.442 | 79.624 | 1.001 | 2.442 | 79.624 | 1.734 | 4.229 | 79.624 |
| 9 | .834 | 2.034 | 81.658 | | | | | | |
| 10 | .780 | 1.902 | 83.560 | | | | | | |
| 11 | .705 | 1.719 | 85.279 | | | | | | |
| 12 | .652 | 1.590 | 86.869 | | | | | | |
| 13 | .572 | 1.395 | 88.264 | | | | | | |
| 14 | .492 | 1.201 | 89.465 | | | | | | |
| 15 | .435 | 1.060 | 90.525 | | | | | | |
| 16 | .404 | .986 | 91.511 | | | | | | |
| 17 | .357 | .871 | 92.383 | | | | | | |
| 18 | .351 | .856 | 93.239 | | | | | | |
| 19 | .306 | .747 | 93.986 | | | | | | |
| 20 | .294 | .718 | 94.704 | | | | | | |
| 21 | .257 | .628 | 95.331 | | | | | | |
| 22 | .236 | .574 | 95.906 | | | | | | |
| 23 | .215 | .524 | 96.429 | | | | | | |
| 24 | .202 | .493 | 96.923 | | | | | | |
| 25 | .193 | .470 | 97.392 | | | | | | |
| 26 | .149 | .364 | 97.756 | | | | | | |
| 27 | .142 | .346 | 98.102 | | | | | | |
| 28 | .126 | .307 | 98.409 | | | | | | |
| 29 | .103 | .250 | 98.660 | | | | | | |
| 30 | .098 | .238 | 98.898 | | | | | | |
| 31 | .085 | .207 | 99.105 | | | | | | |
| 32 | .068 | .166 | 99.271 | | | | | | |
| 33 | .066 | .162 | 99.432 | | | | | | |
| 34 | .054 | .131 | 99.563 | | | | | | |
| 35 | .043 | .104 | 99.667 | | | | | | |
| 36 | .037 | .091 | 99.758 | | | | | | |
| 37 | .028 | .068 | 99.826 | | | | | | |
| 38 | .025 | .062 | 99.887 | | | | | | |
| 39 | .019 | .045 | 99.933 | | | | | | |
| 40 | .014 | .035 | 99.968 | | | | | | |
| 41 | .013 | .032 | 100.000 | | | | | | |
Extraction Method: Principal Component Analysis.
The Scree Plot of the questionnaire of the quality of life in infertile women during postmenopausal period.
Based on the rotation matrix components, the first factor was composed of 14 items; the second factor was composed of 16 items. The third and fourth factors have 4 and 3 items, respectively [Table/Fig-4]. Factors are named as socio-economic, mental, religious beliefs and physical factors, respectively.
The results of the final four factor solution of the quality of life in infertile women during postmenopausal period to the Principal Component Analysis with Varimax rotation and the internal consistency of each factor.
| Factors name | Items | Factor Loadings | α |
|---|
| Socio-economic | 1 | I had better physical health, if my treatment cost f was provided | 0.905 | 0.953 |
| 2 | My life is difficult because of the enormous costs that I got paid for infertility treatment | 0.811 |
| 3 | Due to financial problems, I had not treated | 0.795 |
| 4 | Law has not a financial support for me | 0.769 |
| 5 | My husband has pity relationship with me | 0.757 |
| 6 | Due to fear of the judgment of others, I do not say the truth about my infertility | 0.743 |
| 7 | I am withdrawn and isolated, and do not wish to participate in together | 0.742 |
| 8 | My life situation was better, if I had a child’s adoption | 0.741 |
| 9 | When I’m working, I less think about my infertility | 0.732 |
| 10 | I get teased by my family and relatives | 0.716 |
| 11 | I get pity by my family and relatives | 0.702 |
| 12 | I support by my husband | 0.668 |
| 13 | I support by my family and friends | 0.590 |
| Mental health | 1 | I feel disheartened | 0.902 | 0.950 |
| 2 | I feel anxious | 0.897 |
| 3 | I am aggressive when I thought about my infertility | 0.865 |
| 4 | I have no desire to perform my tasks | 0.860 |
| 5 | I feel, I crying faster than before | 0.835 |
| 6 | I think is terrible my future | 0.829 |
| 7 | I feel is low my physical strength | 0.778 |
| 8 | Hope in God help me to continue my life as well | 0.683 |
| 9 | I’m afraid of dying alone | 0.634 |
| 10 | Because of my infertility, I jealous of fertile women | 0.631 |
| 11 | I feel is low my sexual desire | 0.619 |
| 12 | I feel my body has a major defect | 0.572 |
| 13 | After the anger and turmoil, I hardly feel to calm | 0.560 |
| 14 | I feel my body is old and worn out | 0.541 |
| 15 | I am tolerant to others’ judgment | 0.509 |
| 16 | I love to hurt others | 0.475 |
| Religiousness | 1 | I have accepted the conditions that God put for me | 0.789 | 0.805 |
| 2 | In my view, the motherhood experience is main purpose of the women’s creation | 0.783 |
| 3 | I think, without the maternal experience, the life is meaningless | 0.606 |
| 4 | Religious practices helps me to relax myself | 0.574 |
| 5 | I think child are the meaning of a woman’s life | 0.484 |
| Physical health | 1 | My physical health problems are more than fertile women during their postmenopausal period | 0.766 | 0.822 |
| 2 | Because of the treatment of infertility, my health has serious problems | 0.752 |
| 3 | I am getting patients sooner than others | 0.743 |
Discussion
Previous studies reported the relationship between infertility, psychological and mental disorders [33–36]. Search in databases indicated that lot of different activities have been carried out so far on making a tool to evaluate quality of life. These activities have more growth, circumstances, from 2003 onwards [37]. The Quality of Well-Being Scale-Self Administered, version 1.04 evaluated the impact of infertility on couples quality of life in social and self-care activities, physical activity, and mobility dimensions [38]. However, the SF-36 reported the individuals quality of life in eight demission including; physical functioning, vitality, physical role limitation, body pain, mental health, change in health, emotional role limitation, health perception and the social functioning [39]. The Quality of Life Questionnaire-Core (QLQ) measure the quality of life in physical, role, cognitive, emotional and social decisions [40].
Looking at these studies, we find that most of the instruments used to assess quality of life of infertile couples of reproductive age. When we consider factors such as age and hope the treatment have important impact on the quality of life, it seems reasonable to think the difference will be in the quality of life of infertile couples during and end of the reproductive age. On the other hand, although aging can reduce the fertility rate in men, but the onset of menopause period, express the end of hope for treatment in infertile women. Thus we needed to check the quality of life in this particular group.
In the present study, we tried to produce the perfect tool to assess the quality of life of infertile women during their postmenopausal period. According to the results of the current study, the women’s quality of life is based on four main factors including; the socio-economic, mental, religious beliefs and physical factors. All participants in our study were Muslims. It is known that motherhood is very valuable concept among Muslims. In a qualitative study, reviews the living experience among infertile Muslim women, the results showed that the infertility has important effects on the physical, emotional, social, and spiritual health of infertile Muslim women [41].
Although there are famous questionnaires to assess quality of life during menopause [42–44], the use of these questionnaires is encountered by a few points. The first point, in most of the questionnaires, has been studied only physical and mental aspects of quality of life. The second point, as we said earlier, there is a difference in the quality of life among women who had experienced motherhood and women who had not experienced motherhood.
Conclusion
Therefore, we recommend the use of present questionnaire as a valid tool to evaluate the quality of life in infertile women during postmenopausal period.
Extraction Method: Principal Component Analysis.