In the past decade Bio-Impedance Analysis (BIA) has emerged out as a non-invasive indirect method for analysis of body composition. It provides indirect estimate of Total Body Water (TBW) on the basis of which it estimates free fat mass, total body fat, body cell mass, etc [1–5]. In this analysis a standard alternating current (<1mA at 50kHz frequency) passes through the body, which is being opposed due to resistance and reactance offered by the tissues, cell membranes, tissue interfaces and by the ionic and non-ionic components of different body fluids. As a result the current faces opposition on its course in the body. The degree of opposition determines the impedance. BIA measures this impedance i.e. frequency dependant opposition of current flow. It is a function of reactance and resistance [3,6]. Water and electrolytes are the primary conductors of current in the body. They are mainly contained in the fat free mass so it has low resistance as compared to body fat mass through which current is not conducted readily [3,6,7]. The living cell behaves like a tiny capacitor which stores the current and causes a delay in its flow. This capacitive resistance is called reactance. It is dependent on composition, function and integrity of the body cell mass [2,4,6,8]. As a result of this capacitance the administered current lags behind the voltage since it flows predominantly through materials with lower resistance i.e. fat free mass and creates a phase shift. Geometrically it is quantified as angular transformation of the ratio of reactance versus resistance represented by Phase Angle (PhA). Mathematically, calculated as the arc tangent value of the ratio of reactance versus resistance [1,5].
Research in humans has shown that PhA has a linear relationship with cellular health. It is a sensitive index of body cell mass and electrical integrity of vital cell membranes [1,3,8]. It is very useful non invasive tool to predict nutritional status, TBW and its distribution in extra and intra cellular spaces both in health and diseased conditions [5,9–11].
As it assess the functionality and integrity of the individual cell unlike conventional tools of nutritional assessment relying on weight and height of subject. Thus it is superior to serum and anthropometric nutritional indicators in assessing the clinical outcome of malnutrition in number of diseases like HIV infection, liver cirrhosis, lung and colorectal cancers, bacteraemia, sepsis, etc [1,9,10,12]. Lower PhA values are obtained in such conditions which remain on lower side if the disease progresses further [1,4,13]. Studies in the past demonstrated that values below the range of 4.4 to 5.4 degrees indicate malnutrition and poor survival [1,13,14]. These lower values are suggestive of cell death or decreased cell integrity whereas reverse is suggestive of large number of intact cell membranes as seen in healthy people [1,13].
In spite of prognostic potentials of PhA, it has limited usefulness in clinical practice and in population studies because of non-availability of normal population reference limits for comparison. The values of PhA reported from different countries ranges from 4.4-10.4 degrees but they were not stratified according to the anthropometric parameters [1]. Their applicability to general population is limited as PhA values differ from age, sex, race, body composition, nutrition and hydration of the subject [2,13].
Keeping the above facts into consideration, probably this is the first study from central India which aims to evaluate anthropometric predictors of PhA in healthy subjects.
MATERIALS AND METHODS
A cross-sectional observational study was conducted on 85 healthy medical students of MBBS 1st year in the age group of 17-24 years.
Ethical clearance from the intuitional ethical committee was obtained prior to study. Informed written consent from the participants recruited for study was also obtained.
Personal data was recorded in a specific format and anthropometric measurements were done as per the standard protocol laid down by World Health Organization (WHO). Weight was recorded in light clothing on a digital scale nearest to 0.1Kg and standing height was measured by wall mounted stadiometer to the nearest 0.1cms.
Bio-impedance analysis was made according to standard protocol [13] on an advanced multi frequency whole body BIA analyser Tanita MC 180 MA, (Tanita Corporation, Tokoyo-Japan). The instrument is equipped with eight pairs of tactile electrodes which are incorporated in steel foot pad and in hand grips. The foot pad of the analyser has two electrodes for each foot, similarly two electrodes are placed in each of the handgrips [3,15]. An electrical signal is sent through the body via footplates and hand held electrodes, housed in a single stand-alone unit and the voltage is measured at the ball of the thumbs on both hands and at the heels of both feet [Table/Fig-1]. This arrangement eliminates the variations in electrode placement which is commonly associated with conventional method of BIA measurement. Thus results obtained by the instrument are accurate, reproducible and are highly correlated with traditional impedance device [15].
Electrode placement and standard positioning for BIA measurement.
(Figure source: Tanita MC 180MA instruction manual, Tanita corp Tokyo Japan).
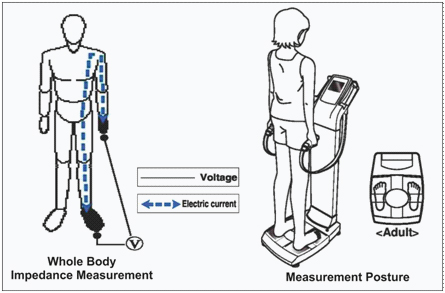
According to manufacturer’s instructions standard positioning of the subject was maintained for BIA measurement. The subject was asked to stand in bare feet on the metal foot plate of analyser, gently holding the hand grip with the arms straight and hung down in neutral standing position, without skin to skin contact [Table/Fig-1]. A high frequency electric current (90μA at 50 KHz) is supplied and values of Resistance (R) and Reactance (xc) were measured between hand and feet [7] [Table/Fig-1]. The inbuilt software calculates phase angle by the formula: Phase angle (PhA) = Reactance (xc)/Resistance (R)* (180/π) [1,7]. Same instrument was used throughout the study and was timely checked for accuracy.
BIA measurement are affected by numerous variables such as body position, hydration status, consumption of food and beverages, ambient air, skin temperature, recent physical activity, and conductance of the examining table [3,13]. In order to control these variables the study subjects were informed about the test protocol and were instructed to come with their bladder empty and should avoid, fluid, food and vigorous physical activity prior to recording.
The subjects with acute and chronic illness, signs of dehydration, menstruating females, subjects with metallic implants, and those using alcohol/diuretics were excluded from the study. Out of the 100 students admitted in the MBBS 1st, 85 students fulfilling the above criteria were included in the study.
Statistical Analysis
Statistical analysis was performed on SPSS version 17.0. Continuous variables were expressed as mean ± standard deviation (or range) while non-continuous are expressed as number of occurrences and percentage. Univariate logistic regression model was used to find out significant predictors of PhA. In the next step all the significant predictors were entered in a multivariate logistic regression (forward-Wald) model to determine the independent predictors of phase angle. A value of p<0.05 was considered significant while between p<0.01 and p<0.0001 as strongly significant.
Results
A total of 85 healthy subjects were studied. The characteristics of study subjects are shown in the [Table/Fig-2]. Mean weight, height, and muscle mass % is significantly higher (p<0.001) in male subjects, as compared to females. However, the values of total fat % is significantly higher in females but BMI and visceral fat percent did not differ significantly between the two groups.
Characteristics of study population.
| Characteristics(N=85) | Entire series | Male (N=32) | Female (N=53) | t-value* | p-value |
|---|
| Mean ± SD | Mean ± SD | Mean ± SD |
|---|
| Weight (kg) | 62.68±15.70 | 69.62±14.4 | 58.44±15.06 | 3.42 | <0.001 |
| Height (cm) | 166.21±9.06 | 174.20±7.10 | 161.3±6.191 | 8.91 | <0.001 |
| BMI (kg/m2) | 22.54±4.61 | 22.80±3.83 | 22.38±5.051 | 0.41 | >0.05 |
| TotalFat % | 28.32±9.47 | 22.03±6.33 | 32.17±9.03 | 5.65 | <0.001 |
| VisceralFat % | 5.06±4.02 | 5.91±3.78 | 4.54±4.11 | 1.56 | >0.05 |
| MuscleMass % | 67.48±9.38 | 74.05±6.23 | 63.46±8.72 | 6.59 | <0.001 |
| Phase angle(Degree) | 5.65±0.59 | 6.10±0.3 | 5.38±0.5 | 6.81 | <0.001 |
*Unpaired t-test for comparison between male and female subjects.
Over all mean of the PhA value is found to be 5.65±0.59°. A highly significant (p<0.001) gender difference in the mean PhA value was also observed [Table/Fig-2].
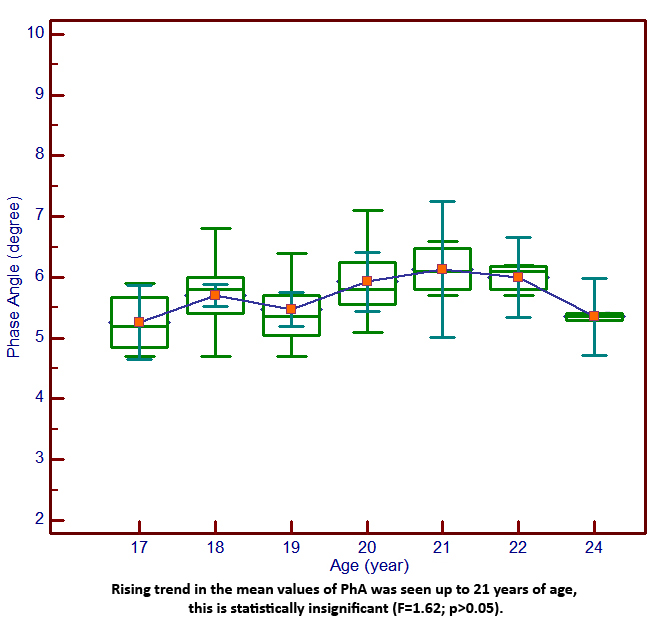
Phase angle values, stratified by age, showed an increasing trend up to the age of 21 years, though statistically not significant [Table/Fig-3].
Box and Whiskar diagram showing mean Phase angle values for different ages with 95% confidance interwal.
In univariate logistic regression analysis weight (p<0.002) and height (p<0.003) emerged as strong significant predictors of PhA, while muscle mass (p<0.03) and visceral fat (p<0.05) predicted it significantly. However, influence of age, gender and BMI was not significant [Table/Fig-4]. On multivariate regression analysis strongest impact of height (p<0.001) was observed on PhA followed by weight (p<0.002), muscle mass (p<0.002) and visceral fat (p<0.02) [Table/Fig-5].
Univariate logistic regression model to asses potential predictors of PhA.
| Variable | β | Std. Error | p-value | Odds ratio |
|---|
| Age (year) | -0.194 | 0.229 | >0.05 | 0.823 |
| Weight (kg)) | 0.477 | 0.154 | <0.002** | 1.61 |
| Height (cm) | -0.385 | 0.128 | <0.003** | 0.680 |
| Body Fat % | -0.121 | 0.192 | >0.05 | 0.886 |
| Muscle Mass % | 0.493 | 0.217 | <0.03* | 1.637 |
| Sex | -0.251 | 1.541 | >0.05 | 0.778 |
| Visceral Fat % | 4.112 | 2.103 | <0.05 | 61.055 |
| BMI | Normal | 0.740 | 1.270 | >0.05 | 2.095 |
| Obese | -0.777 | 2.218 | >0.05 | 0.460 |
**The test variable is highly significant at the 0.002 and 0.003 levels of significance
The individual full logistic regression model at stage-I for prediction of phase angle is described by Log odds of phase angle (degree)=5.377-0.194×age+0.477×weight-0.385×height-0.121×fat%+0.493×muscle mass-0.251× sex (1 if male)+0.740×body mass index(1 if normal)-0.777×body mass index (1 if obese)+4.112×visceral fat (1 if normal) (β- Regression coefficient).
Multivariate logistic regression (Forward-Wald) analysis to assess significant independent predictor of PhA.
| Variable | β | Std.Error | p-value | Oddsratio | 95% CI |
|---|
| Upper | Lower |
|---|
| Weight | -0.388 | 0.100 | <0.002** | 0.679 | 0.558 | 0.826 |
| Height | -0.527 | 0.130 | <0.001** | 0.591 | 0.458 | 0.762 |
| Muscle Mass | 0.308 | 0.099 | <0.002** | 1.361 | 1.121 | 1.653 |
| Visceral Fat | -4.054 | 1.779 | <0.02* | 0.017 | 0.001 | 0.568 |
**The test variable is significant at the 0.02 level of significance. ** The test variable is highly significant at the 0.001 and 0.002 levels of significance. [CI-Confidence Interval] (β- Regression coefficient).
Discussion
The present study was carried out to evaluate predictors of phase angle on young apparently healthy individuals. The estimated value of mean PhA in our study group is 5.65±0.59° [Table/Fig-2]. It is comparatively lower to the values reported from European and American populations, indicating effect of race or ethnicity on PhA [1,2,8,13,14,16–19].
The study demonstrated a gender difference in the values of PhA. As depicted in [Table/Fig-2], the mean PhA values of males were significantly (p<0.001) higher than females. Similar findings were observed in other studies carried out on large populations comprising of healthy as well as diseased subjects [8,12,16–19]. The higher values in males might be due to the higher amount of Fat Free Mass (FFM) relative to body weight in them decreasing whole body resistance [12,19]. However in some of the studies, such gender difference was not observed [1,4], which might be due to small sample size and inclusion of older and diseased subjects in these studies [1,4,8].
A negative correlation of PhA with age was reported in some of the literature studied [8,12,14,16] however in some other studies such association was not observed [1,20]. In the present study PhA values stratified by age were generated and presented in [Table/Fig-3]. A rising trend in the mean values of PhA was found with age up to 21 years, which was statistically not significant.
Selberg et al., in their study had classified PhA >5.4° as normal [1]. In the present study the mean value of PhA is 5.6°, which is very close to the reference values suggested in the studies carried out on healthy subjects [9,13,18,19], and it is higher than the reference values of PhA derived in diseases like pancreatic cancer (5.0°), malnutrition & inflammation (4.91°), end stage renal disease (4.54°), acute lymphoblastic leukaemia (5.3°) [13,16,18,20]. Subjects with malnutrition or restrictive eating disorders like anorexia nervosa and bulimia nervosa also have lower PhA values [21–23].
These lower values of PhA indicates an increase of extracellular water and/or a decrease in body cell mass [22], inability of the cell to store energy due to its breakdown or loss of its selective permeability due to diseases. The net result is reduced functionality or survival time in these patients [1,2,10].
In logistic regression analysis height exerted largest impact on PhA followed by body weight and muscle mass [Table/Fig-4,5]. During our extensive literature search we came across very few studies that have evaluated such relationships and our findings are in agreement with their findings [1,20,21]. Since height and weight are representatives of somatic development reflecting skeletal and muscular growth and collectively they increase percentage of FFM and thus influence resistance and PhA [17]. Moreover, mean height is significantly more in boys which add proportionately more FFM in them producing higher PhA values than the girls of corresponding height [Table/Fig-2].
Influence of age, gender, and BMI have been reported as established predictors of PhA [1,8,17,18]. However, in few studies a weak influence of BMI on PhA was observed [2,21]. In the present study no statistically significant correlation was observed between PhA and BMI (r = 0.14).
These variations clearly indicate that PhA values and its predictors differ among populations and can be further influenced by age group studied and the impedance device used for recording, making its comparison difficult [8].
The present study concludes that reference value of phase angle of study population is 5.6 which are lower than the European norms. Moreover, it is strongly influenced by height, weight and muscle mass. Therefore, established western norms of PhA should not be applicable on Indian population as Indian population comprises of diverse ethnicity with a different body composition and dietary habits.
BIA is a rapid, simple, less expensive and non invasive procedure with good ranking consistency. It gives body composition comparable with other accurate methods like Dual-energy X-ray Absorptiometery (DXA) and Hydrostatic Weighing. Its ability to measure Basal Metabolic Rate (BMR) and to discern between different forms of underweight, makes it superior clinical tool as compared to anthropometric parameters and BMI particularly in deciding treatment strategies in malnutrition and restrictive eating disorders. By providing information of overall metabolic well being of body, it is very useful for the clinician in instituting early interventions whenever there is any derangement in body compositions due to disease process [15,23,24].
Keeping all into consideration we recommend to develop population specific reference limits of BIA phase angle. However, while formulating the reference data height, weight and muscle mass should also be taken into consideration. Present study has showed us an insight for further research on a larger data base to develop countrywide reference values of phase angle.
Limitations
The results of the present study cannot be extrapolated to other population groups due to small sample size of a particular ethnic group and differences in the algorithms used by different manufacturers of bioimpedance machines for BIA measurements. Further the BIA values get affected by variables like fluid and food intake prior to measurements. In the present study we relied on the information furnished by the participants thus strict check on these variables might not be achieved fully.
Conclusion
The estimated mean values of PhA in our study is comparatively lower to the values reported from European and American populations, necessitating to develop Indian population specific reference limits of PhA. The findings of study suggests that PhA values differ across anthropometric and body composition categories, thus height, weight and muscle mass should also be taken into consideration while formulating these values.
*Unpaired t-test for comparison between male and female subjects.
**The test variable is highly significant at the 0.002 and 0.003 levels of significance
The individual full logistic regression model at stage-I for prediction of phase angle is described by Log odds of phase angle (degree)=5.377-0.194×age+0.477×weight-0.385×height-0.121×fat%+0.493×muscle mass-0.251× sex (1 if male)+0.740×body mass index(1 if normal)-0.777×body mass index (1 if obese)+4.112×visceral fat (1 if normal) (β- Regression coefficient).
**The test variable is significant at the 0.02 level of significance. ** The test variable is highly significant at the 0.001 and 0.002 levels of significance. [CI-Confidence Interval] (β- Regression coefficient).