Owing to superior soft tissue contrast capability and non involvement of any biological risk to the patient, MRI is the imaging modality of choice in local assessment of oral cavity [5–7]. The choice of appropriate treatment for patients with oral cancer depends largely on accurate pretreatment staging. Apart from clinical examinations, pretherapeutic cross-sectional imaging assessment is a useful tool and should be part of the standard care for most head and neck squamous cell carcinomas now-a-days.
The presence of cervical lymph node metastases is the most important prognostic factor for survival [8–10]. Parameters used by conventional imaging techniques are shape, size, extracapsular spread and an abnormal inner architecture. The size is certainly the most used criterion for the diagnosis, whereas the presence of central necrosis is the most reliable sign of malignancy [11]. These parameters are not enough to discriminate benign from malignant lesions.
To characterize and stage these malignancies, along with anatomical MRI, Diffusion weighted MRI (DWI or DW-MRI) has recently become the main area of interest as recent studies [12–14] have shown it to be superior in detecting nodal metastasis. Diffusion-Weighted MR Imaging (DWI) analyse intercellular water motion: every change in the water protons movement produces a variation of signal intensity in diffusion-weighted sequences and as a consequence on ADC maps [15].
This study evaluated the squamous cell carcinomas of the oral cavity (tongue and gingivo-buccal complex) on the basis of their appearance, soft tissue extent, depth of tumour invasion and staging and assessed the accuracy of MRI in the detection of cervical lymph nodal metastasis on the basis of ADC values on diffusion weighted MR sequence.
Materials and Methods
This prospective study was conducted in Acharya Vinobha Bhave Rural Hospital Sawangi (Meghe), Maharashtra, India, from July 2013 to August 2015. This was certified by ethical department of the university. All biopsy proven cases of squamous cell carcinomas of tongue and gingivo-buccal region underwent MRI. Claustrophobic, patients with metallic implants, other cancers of the oral cavity, MR staging greater than T4a and patients not willing for MRI were excluded.
MR imaging was performed on consecutive patients with tongue and/or gingivo-buccal squamous cell carcinoma with enlarged neck nodes following appropriate consent. Our study was performed on 61 patients (16 females and 45 males with an average age of 49 years) with enlarged neck nodes. All 61 patients were at or below stage IVa according to TNM staging classification and were operated thereafter and postoperative samples were then sent for histopathological examination.
MR Technique
All the studies were performed by 1.5-T superconductive scanner (BRIVO MR 355 1.5 TESLA GE MRI). The patient was placed in supine position on the MRI table and head coil was applied. Sequences of 4mm thickness with 1mm intersection gap and 256x256 matrix were used with 240mm FOV.
Routine T1WI [Axial and coronal spin echo T1 W(TR, 500-600ms;TE,7-10ms)], T2WI [Axial, coronal and sagittal fast spin echo T2 W(TR,3000-4000 ms;TE,90-100ms)], Coronal Short Tau Inversion Recover (STIR) (inversion time, 150ms) sequences, axial diffusion-weighted sequence (b factor of 0.500 and 1000s/mm2 per axis) followed by post contrast axial T1W sequence were performed.
Image Analysis
Depth of tumour invasion
Axial gadolinium-enhanced T1-weighted sequence was used to measure depth of invasion for tongue and buccal sub-sites where tumours lie vertically and hence, reflected in a medial to lateral dimension.
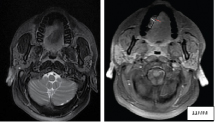
A horizontal line joining the two tumour–mucosa junctions was drawn as a reference line [Table/Fig-1,2a,b].
(a) T2 weighted MR image heterogeneously hyperintense lesion-right lateral aspect of tongue. (b) Calculating depth of invasion (red line) in right lateral border of carcinoma tongue after drawing reference line (black line). White line represents exophytic mass which is ignored.
(a) T2 weighted MR image showing mass lesion in the left gingivo-buccal region. (b) Post contrast T1 weighted MR image shows similar lesion appearing heterogeneously hyperintense. Hypointense areas are suggestive of necrotic component. Depth of invasion is calculated by drawing line (White line) perpendicular to relerence line (black line).
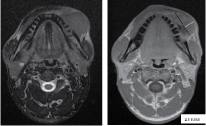
Depth of invasion was measured by drawing perpendicular lines from the reference line to the point of maximal tumour projection and invasion and then calculated the greatest radiologically determined tumour thickness was calculated by adding these two parameters.
If the tumour was ulcerative, the reference line was determined in the same way to be considered as the presumed original surface level, exophytic lesions were ignored and length measurement was simplified to represent invasion ability.
Size
Axial, coronal T2WI and post contrast T1WI were used for measuring the size of lesion. The lesion appears slightly hyperintense on T2WI when compared with T1W images which appears isointense to surrounding mucosa in which case lesion is difficult to identify. Maximum three dimensional sizes were taken on axial and coronal images. Lesion was staged for size (T) under TNM staging criteria of carcinoma oral cavity.
Lymph nodal metastasis
Before diffusion-weighted MR imaging, T1-weighted and T2-weighted fast spin echo images were obtained in the transverse plane. Subsequently, diffusion-weighted MR images were obtained at the same levels where the largest transverse section of the lesion was identified on MR images, obtained before administration of contrast material.
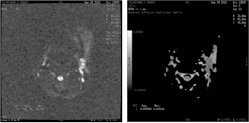
The signal intensity of the lesion was measured with an electronic cursor to define the Region of Interest (ROI) in each patient. The ADC value was automatically reconstructed by a standard software imager in the main console. The whole-node ADC value was obtained drawing a Region of Interest (ROI) [Table/Fig-3a,b] covering all the pathologic node in all sections in which it was present.
(a) Axial DWI shows enlarged left upper internal jugular lymph node showing restricted diffusion. (b) Measuring ADC values within region of interest (circle). Malignant metastatic lymph node.
Obvious cystic portions and calcified areas were avoided to perform diffusion-weighted MR imaging. Special attention was paid to the image distortion caused by susceptibility artifacts and to the severity of chemical shift artifacts and ghosts in the phase-encoding direction.
Statistical Analysis
Statistical analysis was done by using descriptive and inferential statistics using Chisquare test, Pearsons Correlation Coefficient, Kappa values, Odd’s Ratio and Binary Classification i.e., Sensitivity, Specificity, PPV, NPV and accuracy.
Results
Buccal mucosa was the most frequently involved site, accounting for 52.46% cases, followed by tongue 31.15% and gingivo-buccal sulcus in 16.39% cases. Clinical and MRI T stage when compared pathologically results in 63.94% and 81.65% accuracy rate respectively [Table/Fig-4a,b]. Average depth of invasion calculated on MRI was 8.47mm and by histopath was 6.85mm. Pearsons correlation coefficient was 0.988. Shrinkage factor was 0.8 in the present study [Table/Fig-5a,b].
Correlation between clinical and MRI vs pathological T stage.
| | Pathological Data | Total | χ2-value |
|---|
| T1 | T2 | T3 | T4 |
|---|
| Clinical Data | T1 | 0 | 0 | 0 | 0 | 0 | 8.06p=0.23, NS |
| T2 | 4 | 12 | 5 | 13 | 34 |
| T3 | 0 | 3 | 2 | 6 | 11 |
| T4 | 0 | 1 | 6 | 9 | 16 |
| Total | 4 | 16 | 13 | 28 | 61 |
| MRI Data | T1 | 4 | 1 | 0 | 0 | 5 | 117.20p=0.001S |
| T2 | 0 | 15 | 3 | 0 | 18 |
| T3 | 0 | 0 | 7 | 2 | 9 |
| T4 | 0 | 0 | 3 | 26 | 29 |
| Total | 4 | 16 | 13 | 28 | 61 |
The kappa value for clinical and MRI data.
| Kappa | Reliability |
|---|
| Clinical Data | 0.47 | 63.94% |
| MRI Data | 0.69 | 81.65% |
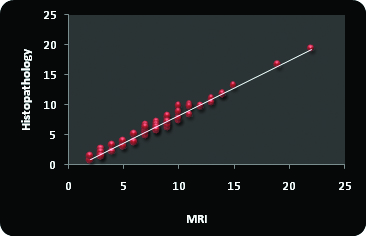
Comparison of depth of tumour invasion on MRI vs histopathology pearson’s correlation coefficient.
| Mean | Std. Deviation | N | Correlation R | p-value |
|---|
| MRI | 8.47 | 3.94 | 61 | 0.988 | 0.0001S,p<0.05 |
| Histopathology | 6.85 | 3.66 | 61 |
| Shrinkage Factor | 0.80 | | | | |
Comparison of depth of tumour invasion on MRI vs histopathology pearson’s correlation coefficient.
A 71% of patients with depth of invasion greater than 9mm showed evidence of cervical lymph nodal metastasis at one or another levels while 56% cases with depth greater than 3mm but less than 9mm shows cervical lymph nodal metastasis. Only 12% patient showed cervical lymph nodal metastasis in which thickness was less than 3mm [Table/Fig-6a,b].
Percentage of cases positive for cervical malignant metastatic lymph nodes according to depth of tumour invasion.
| Depth of tumour (Range) | No of cases | Positive Lymph Node |
|---|
| ≤3 mm | 8 | 1(12%) |
| 3-9 mm | 32 | 18(56%) |
| >9 mm | 21 | 15(71%) |
| Total | 61 | 34(55.73%) |
Cervical lymph node metastasis was found in 34 cases out of 61 cases on DWI with the most frequent involvement of level Ib lymph nodes. The mean ADC value for malignant and benign lymph nodes was 0.84 ± 0.15x10⁻³ mm2/s and 1.23 ± 0.12 x10⁻³ mm2/s respectively. Cut off value to discriminate between malignant and benign lymph nodes was 1.39 X10⁻³ mm2/s in the present study. Sensitivity, specificity and accuracy of DWI in predicting cervical lymph nodal metastasis was 94.44%, 96% and 95.08% respectively when compared histopathologically.
Discussion
The Oral Squamous Cell Carcinoma (OSCC) is one of the rapidly growing oral cancers in the literature of oncology and it is the 6th most common cancer in the world. It is more common in South Asian countries specially India and Sri Lanka. Tobacco and heavy alcohol is the predominant cause of oral cancers. Tobacco alone covers 90% of all oral cancers. The five year survival rate of oral cancer is 68% in early stage and 27% in the late stage [16].
The risk of developing oral cancer increases with age and the majority of cases occur in people aged 4th to 6th decade of life. In the present study, it was observed that in patients with OSCC the mean age was 49.68 years and the most commonly involved age group was 40-49 years accounting for 32.79% followed by age group of 60-69 years (24.59%).
Correct preoperative staging is fundamental for proper therapeutic planning. Clinical and MRI T-staging were done preoperatively and was compared with the postoperative histopathological staging. When clinical T staging was compared with histopathological data, overestimation of T2 lesion was observed while there was underestimation of T4 lesions. The accuracy rate for clinical staging was calculated and found out to be 63.94% (k-0.47). However, accuracy rate for T staging based on MRI examination when compared with histopathological examination came out to be 81.65% (k-0.69). MRI over estimated three cases of T1 and T2 staging and one case of T4 while underestimated four cases of T3 staging. Similar accuracy of clinical and MRI was also seen in a study done by Vidri A et al., predicting T stage accuracy of both clinical and MRI examination to be 62% and 82%, respectively [17]. Similar observation of better accuracy of MRI in staging the primary tumour of oral cavity were also assessed by Rogério Ribeiro de Paiva et al., Siriporn Hirunpat and Cherng-Gueih et al., [18–20].
Literature reveals that, of all the prognostic parameters that have been evaluated, tumour thickness and depth of invasion have emerged as the best predictors for cervical nodal metastasis. As stated by Moore et al., depth of invasion and tumour thickness are not the same, and a distinction has to be made, even though many authors use these two terms synonymously [21]. ’’Depth of invasion’’ means the extent of cancer growth into the tissue beneath an epithelial surface. Depth of invasion (tumour thickness) cannot be assessed clinically. There is a significant role of imaging in predicting depth of tumour invasion. Various studies showed the role of MRI in predicting depth of tumour invasion. According to Tetsumura A et al., Iwai et al., Paul Lam et al., radiologic tumour thickness as measured on contrast-enhanced T1-weighted images had significant correlation with histologic tumour thickness [22–24]. This study showed the similar findings with a mean radiological tumour thickness of 8.47mm and histological tumour thickness of 6.85mm. The Pearson’s Correlation Coefficient(R) was calculated and its value came out to be 0.988 (p<0.0001). Paul Lam et al., showed almost similar Pearson’s Correlation Coefficient value (R) 0.938 [24].
In the present study, MRI showed slightly greater thickness when compared to histological thickness. The possible cause of the discrepancy between the histologic and radiologic thicknesses may be due to the shrinkage of specimen during formalin fixation despite the immediate stretching and pinning of specimen on a foam board. Shrinkage factor of 0.8 was calculated after comparing MRI and histopathological depth of invasion.
The detection of cervical nodes metastasis is very important for the prognosis and the treatment of head and neck tumours. Till today the parameters used by conventional imaging techniques are shape, size, extracapsular spread and an abnormal inner architecture. The size is certainly the most used criterion for the diagnosis, whereas the presence of central necrosis is the most reliable sign of malignancy [25]. Nevertheless several reports showed that these parameters are not enough to discriminate benign from malignant lesions [26–28].
In this study, diffusion weighted sequence was done in all patients before administration of contrast. ADC value was calculated in every enlarged lymph nodes. These lymph nodes were then examined histopathologically. We found that 34 (55.73%) out of 61 patients showed lymph node metastasis to various levels. Out of these 34 patients, 17(50%) cases were positive for lymph node metastasis had their primary lesion over buccal mucosa, followed by tongue {12 cases (35.29%)}, gingivo-buccal sulcus {5 cases (14.70%)}.
Lymph nodes which showed restricted diffusion, there ADCs value ranged from 0.5 to 1.2(x10-3 mm2/s) while 27 cases did not show restricted diffusion and there ADCs values ranged from 0.9 to 1.4 (x10-3 mm2/s). The mean value was calculated for lymph nodes which came out to be 0.84±0.15x10⁻³ mm2/s and 1.23±0.12 x10⁻³ mm2/s, less than the mean values for benign lymph nodes.
After averaging both the mean values, cut off ADC value was calculated. The suggested cut-off point to discriminate between malignant and benign lymph nodes was 1.038 x10⁻³ mm2/s in the present study. Approximately similar value of ADC was also found in study by Anna Perrone et al., (1.03 x10⁻³ mm2/s), J Si et al., (0.887 x10⁻³ mm2/s) [12,13]. All these studies showed low threshold ADC value for malignant lymph nodes and higher for benign lymph nodes. However, Misa Sumi et al., showed exactly opposite result in his study ADC was significantly greater in metastatic lymph nodes (0.410 ± 0.105 x10⁻³ mm2/s, p < .01) than in benign lymphadenopathy (0.302 ± 0.062 x10⁻³ mm2/s) [14].
In the present study, 36 out of 61 postoperative patients were histopathology positive for lymph nodal metastasis. There were two cases which were not identified on MRI examination (one of them was at level V) and one case which was false-positive for metastasis but was histopathologically benign.
Level I was the most involved group for metastasis showing restricted diffusion in 29 cases however postoperative histopathological findings showed 31 cases out of 61 cases which were positive for metastasis at the same level. This was in accordance with the Jochen A Werner et al., who stated that, the dense lymphatic system of the gingiva-buccal complex drains primarily into the submandibular lymph node through 8 to 10 collectors that extend through the buccal muscle [28]. Essig H et al., found that incidence of lymph node metastasis in level I was high as compared to other levels of lymph node from carcinoma of the buccal mucosa [29].
In the present study,14 cases showed restricted diffusion at level II. On histopathological examination, a total of 19 cases showed level II positive for malignancy. This difference can be explained on the basis of image distortion caused by susceptibility artifacts and to the severity of chemical shift artifacts and ghosts in the phase-encoding direction. Level III and IV were the least involved lymph nodes. We did not find any case positive for level V in our study.
In the present study, sensitivity, specificity and accuracy for detecting cervical lymph node metastasis by DWI/ADC values on MRI was 94.44% (81.34-99.32%), 96% (79.65-99.90%) and 95.08% and positive and negative predictive value were 97.14% (85.08-99.93%) and 92.31% (74.87-99.05%) respectively.
Prediction of lymph nodal metastasis was done based on radiological depth of invasion calculated on contrast enhanced T1-weighted images and then was compared with the histopathological nodal status. The lymph nodal metastasis was divided according to proposed tumour thickness staging classifications. These included Stage I (tumour</=3mm), Stage II (>3mm but <9mm) and stage III (> 9mm). Only 34 patients out of 61 patients showed metastasis to the cervical lymph nodes according to radiological tumour thickness. A total of eight cases showed depth of invasion </= 3mm (Stage I), out of which one patient (12%) showed metastatic cervical lymphadenopathy, 32 cases showed tumour thickness between 3mm and 9mm, out of which 18 patients (56%) were positive for metastasis. Twenty one cases showed tumour thickness >9mm in which 15 (71%) were positive for metastatic lymphadenopathy. This result shows similar agreement with Anthony Po Wing Yuen et al., [30]. According to them tumour of up to 3mm thickness has 10% nodal metastasis, tumour thickness of more than 3mm and upto 9mm has 50% nodal metastasis, tumour of more than 9 mm has 65% node metastasis. However, Paul Lam et al., uses similar tumour thickness staging classification and found 9% for stage I, 21% for Stage II and 45% for Stage III [24].
In the present study, the depth of tumour invasion was directly proportional to the cervical lymph node metastasis. The statistically significant value is indicative of progressive increase in lymph node metastasis with increase in the depth of tumour invasion. The probable reason could be that the thick tumours, which invade more deeply, have access to wider lymphatics in which tumour emboli can form more readily than in the small-caliber lymphatics of superficial areas.
Limitation
Contrast examination was mandatory for measuring exact depth of invasion, as surrounding oedema and necrotic component can not be differentiated without contrast.13 such cases were identified in the present study whom no contrast study was performed. These cases were than excluded from the study.
There were many patients with tumour staging larger than T4a which makes them inoperable, hence the sample size was reduced.
Various artifacts were seen, mostly in older age groups due to motion and dental filling magnetic susceptibility artifact with field distortion. Such artifacts sometimes leads to false interpretation of images.
Conclusion
MRI assessment of tumour staging augments clinical findings to plan appropriate therapy. Depth of invasion in oral malignancies can be measured reliably on MRI which helps in predicting cervical lymph nodal metastasis which can be used as an important supportive tool in deciding type of neck dissection and prognosis of patient. Benign or malignant cervical lymph nodes can be differentiated on diffusion-weighted imaging of MRI on the basis of their ADC values concluding that diffusion imaging could be considered an important supportive tool for detecting malignancy in enlarged cervical lymph nodes.