Hippocrates who lived 2,4000 years ago understood that there is direct connection between the places we live and its impact on personal health and he concluded that health depends on the air we breathe, the water we drink and the environment in which we live [1]. Spatio-ecological studies and demographic studies of disease provide a framework to study people’s lifestyles and how it affects health [2]. As a part of the health initiatives, the government aims to improve the health disparities, integrate communication and health and use information technology as a priority to elevate community health.
Geographic Information System (GIS) is an advanced information system with capabilities of capturing, storing, analysing, managing and presenting spatially referenced data (linked to location). The ability to overlay data layers allows for interpretation beyond that seen with traditional research and statistical methods [3,4]. GIS is used to empirically measure and visually identify and explore spatial relationships of health and health variables. It provides a dynamic link between databases and maps so that data updates are automatically reflected maps. Both the visual impact and the data analysis provided by GIS’s are advantageous and hence support their use [5,6]. In spatial disease mapping, public health practitioner can use GIS produced maps as a spatial visualization tool and effectively reveal geographic phenomenon which might otherwise remain undiscovered in tabular form and can transfer the information to health managers, policy makers for effective planning [4,5].
Cancer is an important public health issue not only in developed countries but also in developing countries. Breast Cancer has been the leading cause of cancer among women in both developed and developing countries [7,8]. A fourfold increase in breast cancer incidences has been observed from the year 1980 to 2010 in both developed and developing countries [9]. Diseases like cancer that occur globally have variation both spatially and temporally in terms of incidence, prevalence, severity, loss of DALY’s and mortality [10]
According to the GLOBOCAN 2012 estimates, in India, the incidence of female breast cancer was 25.8 per 1,00,000 population, mortality of female breast cancer was 12.7 per 1,00,000 population and 5 year prevalence rate of female breast cancer was 92.6 per 1,00,000 population [11]. Breast Cancer management is heterogeneous in character and requires multi-disciplinary approach. The information on the epidemiology of breast cancer in India using GIS is very limited except for few reports. Through the advances of GIS and statistical methods in spatial epidemiology, health and population data have started to be examined together and research on spatial variation of disease risk is possible.
In the present paper, we have tried to demonstrate how Geographic Information System (GIS) can be used to understand Breast cancer incidences through Spatial visualization and temporal trends of breast cancer in southern part of Karnataka using thematic mapping techniques
Materials and Methods
Study Area
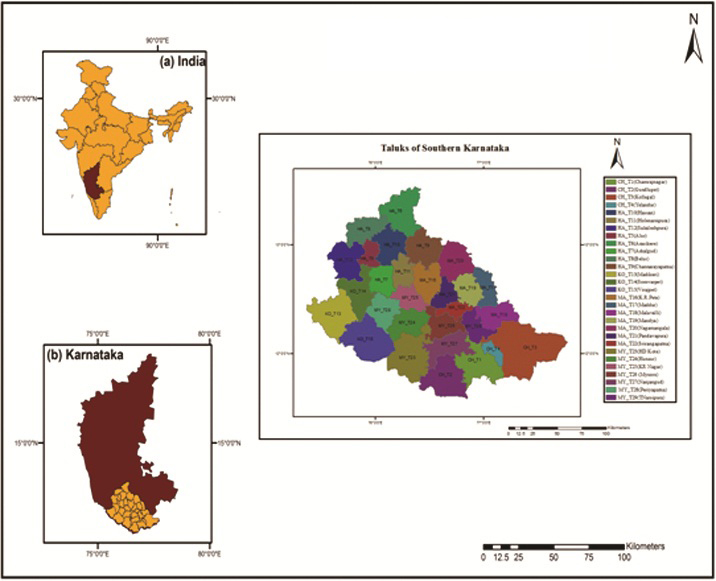
The present study is carried out as a Taluk based study in Southern Karnataka (Mysore and its adjoining districts like Mandya, Hassan, Kodagu, Chamrajnagar- comprising of 29 taluks).
Geographical Location
The Geographic extent of the study area is from 11°34′48″N to 13°32′40″N latitude and 75°22′3.7″E to 77°46′25″E longitude covering an area of 27,852 square km [12].
As per the 2011 census, the total population of the study area is 81,58,841, which is comprised of 40,82,047 males and 40,68,265 females. Average literacy rate in the region ranges from 60 to 80% i.e. lowest in Chamrajnagar and highest in Mysore urban region. The majority of the people in the study area are engaged in agricultural activities. Mandya district is the most prosperous agricultural region with paddy and sugarcane crops and coffee plantations are popular in Kodagu region [13].
Recently, significant number of industrial areas is established in and around Mysore and it has emerged as one the largest growing economic district of Karnataka other than Bangalore. Mysore has been recognised as one of the tier II cities and Special Economic Zone [14]. This has resulted in the rapid urbanization in and around. Mysore and the rural population are influenced by this changing lifestyle. Location of the study area with 29 taluks with their respective codes for the five southern districts of Karnataka is depicted in [Table/Fig-1].
Location of the study area.
Data
Breast cancer Data: A total of 1090 breast cancer case records with attribute information such as age, sex, address, education, marital status, religion, occupation, income parity and clinical information (pathological and treatment details) was collected for the year 2007-2012. These data were further segregated taluk wise for the 29 taluks and geo-coded using the address of the patient, creating a point map. The descriptive analysis of the demographic and clinical pattern of these data is already published by the authors [15]. In the current study the authors present the spatial and temporal analysis of the breast cancer data using GIS.
Spatial Data: Toposheets obtained from Survey of India for the study area, with numbers of 48 O, 48 N, 48 K, 49 M, 57 A, 57 C, 57 D, 57 F, 57 G, 57 H, 57 K, 57 L, 58 A, and 58 E covering the southern districts of Karnataka were used as a baseline for spatial data [12].
Ethical Considerations: Institutional Human Ethics Committee of JSS Medical College approved the study. Necessary permission were obtained from Bharath Hospital and Institute of Oncology, BHIO, Mysore and JSS Hospital prior to the study to access the medical records.
Data Analysis
Arc GIS 10.2 software was used to prepare thematic map of breast cancer cases. The Taluk wise aggregated breast cancer incidence from the year 2007 to 2011 was then attributed into polygon map [Table/Fig-1] representing taluks which is considered as the base map of the study. Natural Break data classification technique [16] was used to classify breast cancer incidence data and breast cancer incidences were classified as low, moderate, high and very high.
Results
To study the spatio-temporal pattern of Breast cancer in southern districts of Karnataka, to approaches were adopted.
(i) Spatial Distribution of Breast cancer incidences by a point map.
(ii) Temporal distribution of breast cancer incidences by thematic maps for the study period of 2007 -2011, individually.
Spatial distribution of breast cancer incidences using thematic mapping methods
Thematic mapping is a process of using graphical properties and values, such as size, colour, to represent data on a map. For the present study natural break classification method is adopted for thematic mapping. An overall thematic map of breast cancer incidence in southern Karnataka (2007-2012) is prepared and presented as [Table/Fig-2].
Overall taluk wise breast cancer incidences in southern karnataka (2007-2012).
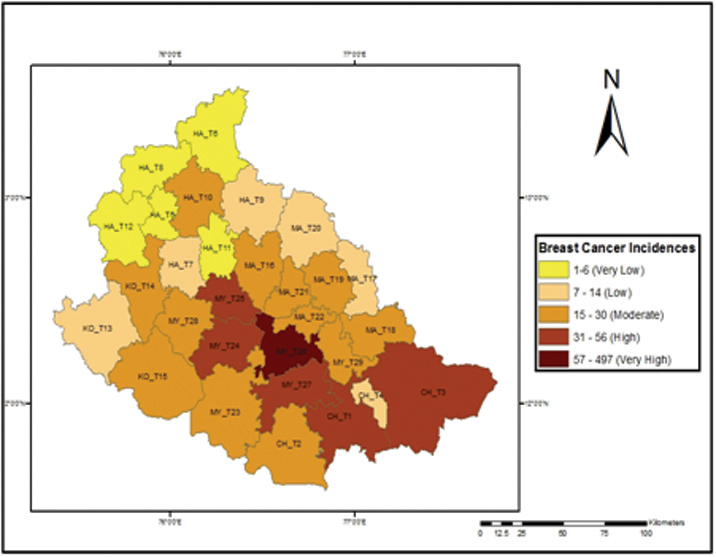
From the map [Table/Fig-2], it is observed that the MY_26 Mysore taluk has recorded the highest breast cancer incidences than the rest. High incidences were reported in MY_ T24 (Hunsur), MY_ T25 (KR Nagar), MY_27 (Nanjangud), CH_T1 (Chamrajnagar) and CH-T2 (Gundlupet). The remaining taluks show low and moderate incidences of breast cancer. From the results, it is inferred that only 6 taluks out of the 29 taluks in our study area have increased breast cancer incidences. Moderate incidences were present in taluks adjacent to very high and high incidence taluks. Low incidences are reported in taluks which are designated as forest and tribal areas. From the results, it is observed that 20% of the taluks are areas of concern and the remaining 80% do require minimal attention towards breast cancer control.
The point map of breast cancer cases with detailed information regarding the patients was superimposed on the taluk map to represent the disease distribution [Table/Fig-3].
Spatial distribution of breast cancer incidences in Southern Karnataka.
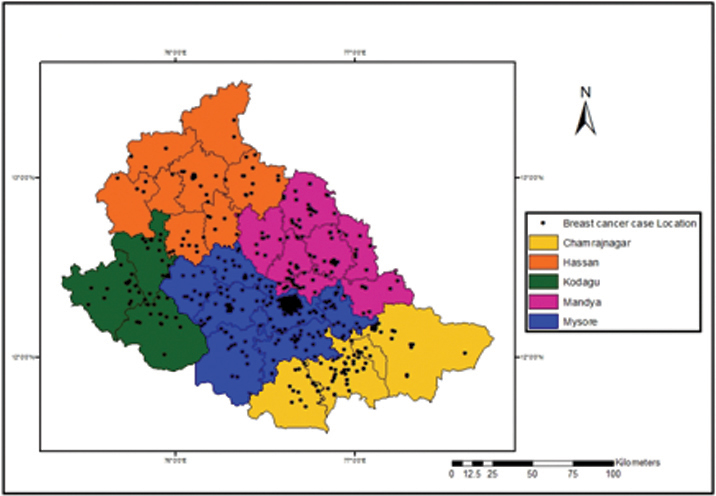
The visual understanding of the map denotes clustering of cases in urban regions (Mysore) and sparse distribution of the cases in the outer or peripheral regions of the study area. Also, small clusters are observed in the map which may be district or taluk headquarters.
However, the maps in [Table/Fig-2,3] are an overall representation of the disease situation in the study area and hence a temporal perspective has to be introduced so as to identify the spread or diffusion of the disease year wise.
Female Population at risk in southern districts of Karnataka
For breast cancer, the population at risk was mainly the female population, though negligible cases of breast cancer are also observed in males. The female population data of the 29 taluks used for the preparation of the thematic map which is presented as [Table/Fig-4].
Female population distribution in southern Karnataka.
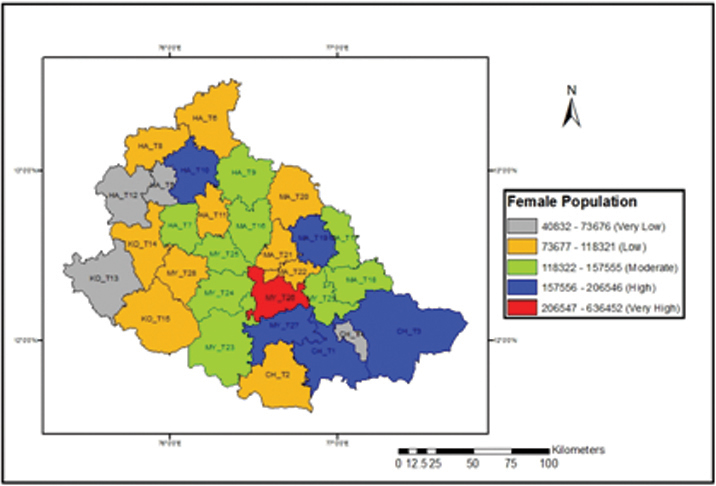
From the map [Table/Fig-4], it was observed that Mysore (MY_T26) taluk has maximum female population and the regions with high female population also include Nanjangud (MY_T27), Chamrajnagar (CH_T1), Kollegal (CH_T3), Mandya (MA_16) and Hassan (HA_10). The other 23 taluks had moderate or low female population. A comparison was done to observe the maximum cases in relation to maximum population and it was observed that only in urban centre the relationship existed, whereas in the other regions, the cases varied irrespective of the female population. Therefore, an approach using incidences based on population was used to determine the exact susceptibility in study region so as to plan for future interventions.
Incidence Rate of Breast Cancer
As mentioned above, to identify the exact affected female population among the overall population “an incidence rate” was calculated and used as a factor for thematic mapping. The breast cancer incidence rate was calculated using the following formula (Equation 1) for each taluk in the study area
Incidence Rate

The calculated incidence rate was used to prepare a thematic map of incidence rate for southern Karnataka region [Table/Fig-5].
Breast Cancer incidence rate in Southern Karnataka.
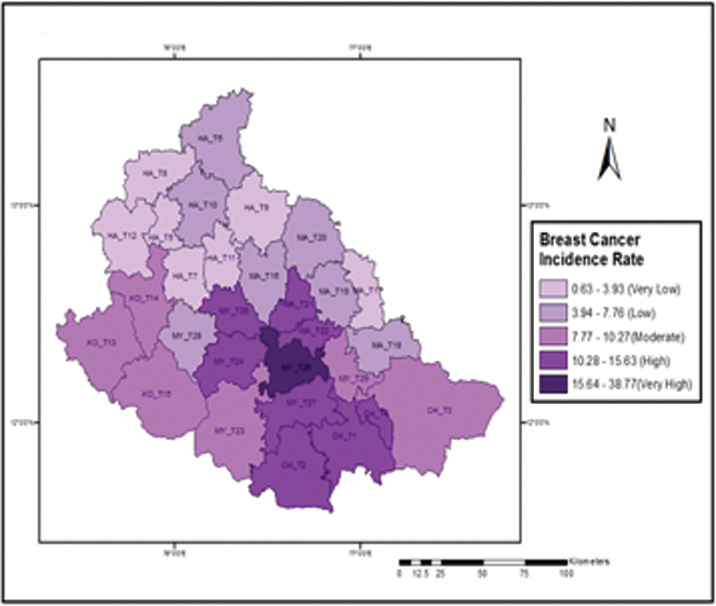
The incidence rate was found to be very high in Mysore taluk (MY_T26), whereas low incidence rate was observed in Alur (HA_T5), Arkalgud (HA_T7), Belur(HA_T8), Channarayapatna(HA_T9), Holenarsipura (HA_T11) Sakaleshpur (HA_T12) and Maddur (MA_T17) taluks. The remaining taluks had moderate incidence rate of breast cancer.
Temporal trends of Breast Cancer Incidences in southern Karnataka
Spatial analysis coupled with time trends give a better understanding of the disease, in terms of period of exposure, period of disease and time of death. Through this, the population at risk can be evaluated for exposure and treatment before and after diseases to prolong their survival. In recent years all disease assessments are viewed in temporal patterns to understand the nature and viability of the disease especially when multiple factors like environment, socio-economic conditions, hereditary etc. are involved.
The district wise temporal trends of breast cancer for the study area during the study period are presented in [Table/Fig-6] to identify the increase and decrease of cases. Overall a gradual increase in cases in all the districts was observed except Hassan district which observed a decrease in 2008 and displayed an immediate increase in the successive years.
Temporal Distribution of Breast Cancer Incidence in Southern Districts of Karnataka (2007-2012).
| Sl. No | District | 2007 | 2008 | 2009 | 2010 | 2011 | 2012 | Total |
|---|
| 1 | Chamrajnagar | 13 (9.7) | 25(18.6) | 28(22.3) | 24 (17.9) | 33(24.6) | 11 (8.2) | 134 |
| 2 | Hassan | 12(18.1) | 4(6.06) | 15 (22.7) | 17 (25.7) | 17 (25.7) | 1(1.5) | 66 |
| 3 | Kodagu | 10(19.2) | 4 (6.05) | 14(21.2) | 11(16.6) | 13(19.6) | 0(0.0) | 52 |
| 4 | Mandya | 17(12.5) | 20(14.7) | 36(26.4) | 25(18.3) | 26(19.3) | 12(8.8) | 136 |
| 5 | Mysore | 99 (14.1) | 108(15.3) | 156(22.2) | 165(23.5) | 155(22.07) | 19 (2.7) | 702 |
| Total | 151 | 161 | 249 | 242 | 244 | 43 | 1090 |
To further understand the successive temporal changes over time (year), spatial and temporal integration of the data was performed. The thematic maps for the Breast cancer Incidence taluk wise for each year during the study period were prepared and presented as Maps (in [Table/Fig-7] to understand significant temporal changes in the study area. The number of breast cancer case records collected for the year 2012 was very less and incomplete and hence it is not included in the preparation of the temporal thematic map for the year 2012.
Temporal trends of breast cancer incidences (2007-2011).
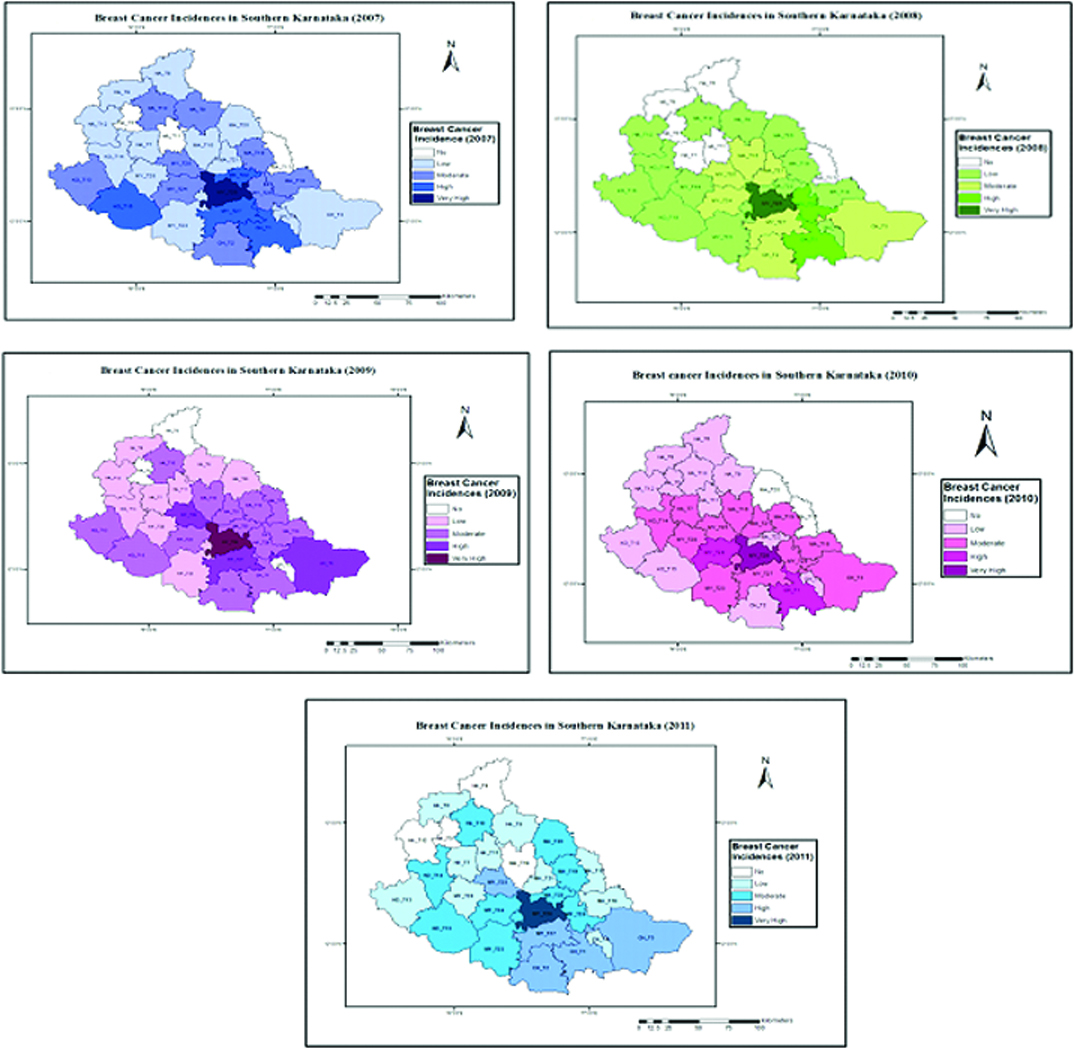
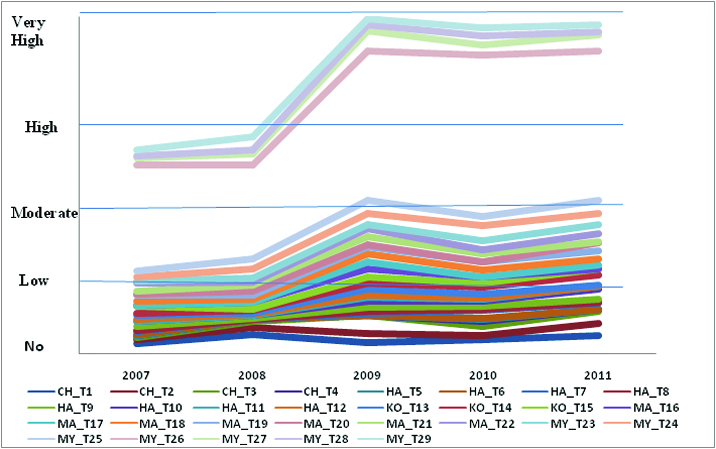
The temporal maps prepared for the study from 2007 to 2011 were compared to identify the temporal pattern and is illustrated in [Table/Fig-8]. In 2007, Mysore Taluk showed very high incidence level and the same was observed throughout the study period. Taluks which have high and moderate intensities seem to be fluctuating. However, 25 taluks do not fall into very high category during the study period. Some of the Taluks such Gundlupet (CH_T2), K R Nagar (MY_T25), Kollegal (CH_T3) have been observed to enter high intensity category during the year 2011 from moderate intensity. It is also observed that Nanjangud (MY_T27) is in high category throughout the study period which might be due to its proximity to Mysore urban. Specific variations were not observed in low and no intensity zones. However, slight fluctuation were noted which may be due to mobility. Movement of population to urban areas for seeking better medical care. However, Alur taluk remains as a no intensity zone throughout the study period.
Cumulative graph of Taluk Wise Temporal Variation of Breast cancer from 2007 to 2011.
Discussion
Mapping of spatial and temporal distributions of disease is directly related to human interventions. Through this method, a scientific approach into the processes that promote the temporal fluctuation of disease can be evolved. The advancement of GIS technology makes it ever easier to connect spatially referenced physical and social phenomenon to population pattern of health and disease on a time scale.
National Cancer Registry Program of ICMR for the first time in India tried to map cancer patterns in India and Cancer e-atlas was developed for the year 2001-2002 [17].
In this present study, the spatial and temporal analysis using GIS has shown that breast cancer clustering is highest in urban areas and random distribution of breast cancer cases in the rural areas. Such analysis are not possible with routine statistical analyses Moreover, temporal mapping shows the direction of the disease spread in terms of towards-urban-agglomeration or towards-rural-regions or both. It also helps us to understand the growth of urban facilities and lifestyles and their penetration into rural regions.
Spatio-temporal analysis of breast cancer data may help identify new exposure hypotheses that warrant future epidemiologic investigations with detailed exposure models. The current analyses illustrate the usefulness of spatial and temporal analyses to visualize cancer risk, adjust for known confounders, and test for the statistical significance of location and time. Temporal analysis of cancer conducted by Papoila et al., has focused primarily on the detection of cluster and occurrence of diseases at particular periods [18]. Recently cancer maps for Western region of Coimbatore were prepared by Valarmathi et al. and models such as time trend analysis were incorporated into maps [19]. Vieria et al., applied generalized additive models for the spatio-temporal analysis of breast cancer in Upper Cape Cod, Massachusetts [20]. In a study by Bonyah et al., adopted area to point kriging technique to identify breast cancer incidence cluster in women above 40 years and below 40 years in Ashanthi region [21]. Lastly researchers, also have emphasized that developing cancer atlases using GIS are useful tool for assessing and quantifying geographic inequalities, which can also assist to focus research efforts in investigating the observed inequalities of cancer incidences [22].
Limitations
As there is neither a population nor a hospital based cancer registry in the study area, the data for the present study was obtained from a tertiary cancer care hospital in the study area and cancer data was not available from government PHC’s and hospitals.
Inspite of these limitations, advancement of GIS Technology makes it easier to connect spatially referenced physical and social phenomenon to population pattern of health and disease on a time scale and thus provide a decision supporting system for cancer care, information for cancer control interventionist and geo-demographic data for control and prevention activities and for public health professionals
Conclusion
Analysis of Breast Cancer in southern Karnataka using GIS has revealed that urban areas of Mysore has the highest risk of breast cancer and the temporal trends reveal that even rural areas with moderate risk are moving towards high risk areas. The resultant GIS based map of our study provides deep insight into breast cancer data rather than report results of statistical hypotheses tests and thus emphasising the need for establishment of GIS based hospital and population Cancer Registries.