Control of childhood blindness is one of the priorities of World Health Organization’s ‘VISION 2020 — The Right to Sight program’ [1]. There are several reasons for this. Firstly, the children who are born blind or who become blind during childhood have much more number of blind years than an adult who becomes blind later on. Secondly, many of the causes of blindness in children are either preventable or treatable. Uncorrected vision problems in children can worsen over time and result in permanent loss of vision. Thirdly, many of the causes of childhood blindness are also associated with child mortality (e.g. premature birth, measles, congenital rubella, vitamin A deficiency, and meningitis). Thus timely detection of these conditions can contribute to higher chances of child survival [1].
There are about 1.4 million blind children worldwide out of which two thirds live in developing countries. The causes of childhood blindness vary according to region, levels of socioeconomic development and health care provision [2]. The prevalence of childhood blindness in India was reported to be 0.17% [3]. Population-based studies from India reported a prevalence of uncorrected visual acuity of 2.7% and 6.4% among children aged 7-15 years in rural and urban population respectively. The prevalence of best corrected visual acuity of 20/40 or worse was reported to be 0.78% and 0.81% in rural and urban population respectively [4,5].
Childhood blindness can hinder education, personality development and career opportunities, in addition to causing an economic burden on the society. Childhood blindness due to various avoidable and treatable causes in any population suggests that eye care services in that population are inadequate [4]. For all these reasons, it is imperative that effective strategies be developed to eliminate avoidable and treatable causes of childhood blindness. Strategies to address eye health of children during the early years of life have therefore focused on school eye health programs. School eye screening program is the second largest program of the National Program for Control of Blindness in India after cataract surgery [6,7]. Vision screening of children in schools has traditionally been done by ophthalmic assistants and ophthalmologists. There is a huge deficit of trained eye care personals. There is one ophthalmologist per 20,000 population in urban and per 200,000 population in rural areas in India. Similarly there is one ophthalmic assistant per 200,000 population [8]. Significant proportion of rural population does not have access to quality eye care services as majority of ophthalmologists are concentrated in urban areas [9].
Taking these aspects into consideration, innovative community based strategies are required to provide quality services to the underserved sections of the community. Introducing teachers as the first component of school eye screening program especially in rural areas can lead to effective utilization of existing resources and early detection of potentially blinding disorders in children. Involving teachers in vision screening will save enormous amount of time and energy of the eye care staff, reduce their work load and provide a wider coverage of eye care services. We present here our experience of vision screening of the school children by their teachers, thus exploring the possibility of introducing teachers as the first level vision screeners to eliminate childhood blindness.
Materials and Methods
The project of vision screening of school going children by their teachers was started by the Department of Ophthalmology of our hospital with the support of Orbis International. The government and semi government schools in the Ludhiana district were covered in the first phase of this project. The list of the schools was taken from the District Education Office and the schools were randomly selected. The permission to conduct the vision screening in the schools was also taken from the District Education Officer. The Principal of each school was requested to nominate 1 or 2 teachers, depending upon the total number of students in that school. The selected teachers underwent a teachers training program organized by the department. A total of 7 teacher training programs, each of one day duration, were conducted. The teachers attended theory lectures covering topics on magnitude of childhood blindness, importance of early detection of vision problems in children, the role of teachers in early detection of childhood eye diseases and methodology of vision screening of school children by their teachers in the schools. The process of vision assessment was then practically demonstrated by the trained optometrists and steps involved were explained in detail. Subsequently, each teacher repeated the whole procedure in front of the staff in order to confirm that they understood the procedure completely and also to clear their doubts, if any. They were provided with necessary kits containing vision screening chart, 6m measuring tape, forms (A, B & C as shown in [Table/Fig-1]) for detailed recording of vision screening of the school children and educational material. The vision screening chart was white in colour, with 4 black ‘E’ optotypes of size equivalent to 6/9 of the Snellen’s visual acuity chart. The chart had to be read at a distance of 6m in proper daylight illumination. The height at which the chart had to be hung was adjusted according to the height of the child. Each eye had to be tested individually. For each eye, the child had to indicate the direction of the open end of the ‘E’. If the child identified all the four ‘E’ optotypes correctly with each eye, he/she was labelled as ‘normal’. If any one of the four ‘E’ optotypes was incorrectly identified by either of the eye, the child was labelled as ‘low vision’.
Form A, Form B and Form C.

The teachers were given a period of 7-10 days to conduct vision screening of all the children up to the age of 16 years in their respective schools. Teachers recorded the detailed data including name, age, gender and the visual status (normal or low vision) of all the children screened on form A. The detailed data of children identified as low vision by the teachers was recorded on form B. The parents of the children with low vision were intimated about the date of visit of the doctors to the school by sending form C in their diaries, to decrease the number of absentees on that particular date.
Subsequently an ophthalmology team from the department including an ophthalmologist, an optometrist and an ophthalmic technician visited these schools on the scheduled date. All the children identified as low vision by the teachers were re-examined by the team. The eye examination included recording of visual acuity using standard Snellen’s visual acuity chart [10], torch light examination and fundus examination with direct ophthalmoscope. The detailed data regarding the visual status of the children was recorded on form B by the team. The detailed data included the visual acuity of the child and the cause of visual impairment in that child. Refraction of the children with refractive errors was done in the school premises and spectacles were prescribed. Treatment and prescription for certain ocular diseases was provided in the school itself. Any child who required further evaluation was given a referral form and was referred to the base hospital.
Children identified with abnormalities by the teacher and confirmed to have abnormalities by the ophthalmology team were considered as true positives. Children identified with abnormalities by the teacher but confirmed to have no abnormality by the ophthalmology team were considered as false positives [Table/Fig-2].
Flowchart representing the methodology adopted for sampling in the phase 1 and 2 of program.

To assess the true negatives and false negatives, we conducted the second phase of the project. In this phase we covered 5 government schools whose teachers were trained under the teacher training program. In addition to the methodology followed in phase 1, approximately 1% of children who were identified as normal by the school teachers were included for examination by the ophthalmology team. These children were identified using a simple random sampling technique without replacement.
Children identified as normal by the teacher but found to have abnormalities by the ophthalmology team were considered as false negatives. Children identified as normal by the teacher and confirmed to have no abnormality by the ophthalmology team were considered as true negatives [Table/Fig-2].
The data from the forms A and B received from each school was entered into a computer in an MS-Office Excel worksheet. Data on true positives and false positives was derived from the group of the children identified as having low vision by the teacher. Data on true negatives and false negatives was derived from the group of the children identified as normal by the teacher. The final data was analyzed to assess the effectiveness of the method of vision screening of school children by teachers.
Also, a data analysis regarding the percentage of various causes of visual impairment in the children screened in these schools was done.
Results
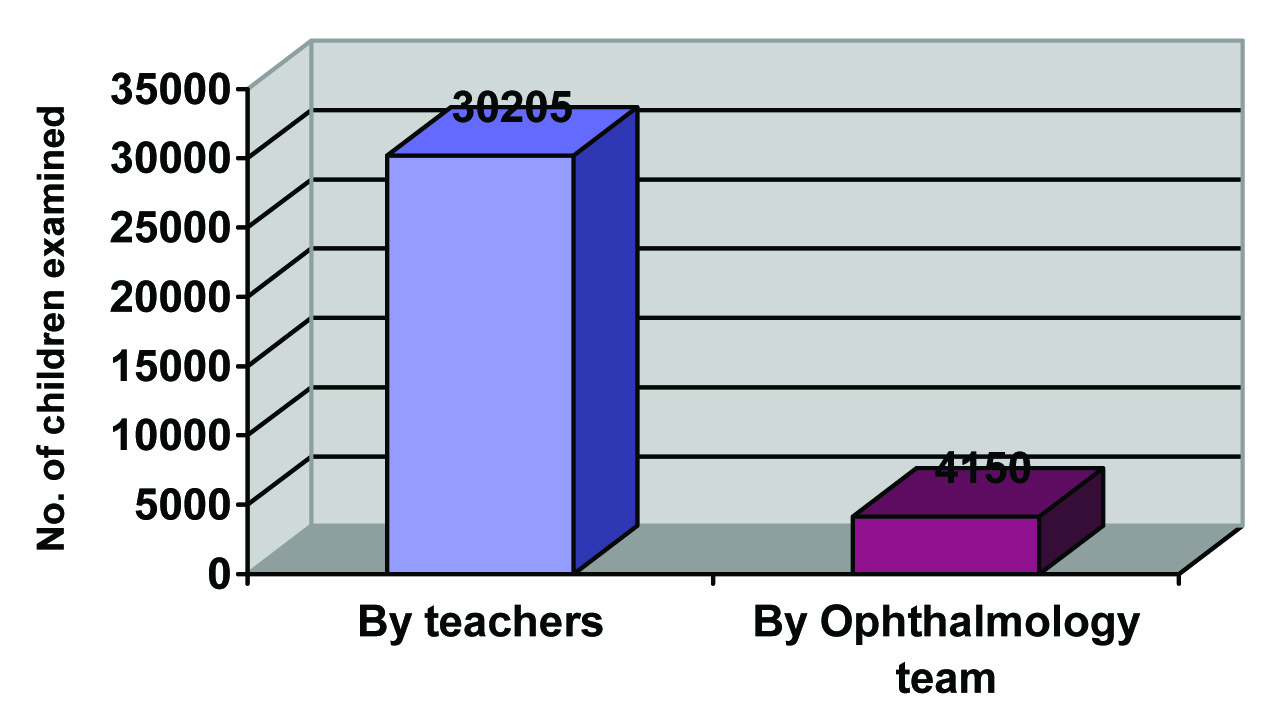
In the first phase of the project, 166 schools in Ludhiana district were covered. A total of 253 teachers from these schools were trained in vision screening through teacher’s training programme. The project enrolled 30,298 school going children up to the age of 16 years. Out of these, 30,205 children (52.3% males and 47.7% females) were screened by the teachers providing a coverage of 99.7%. The teachers identified 4523 (14.97%) children with eye problems, who needed evaluation by an ophthalmologist. These included 47.9% males and 52.1% females. The ophthalmologist and his team examined 4150 children (47.9% males and 52.1% females) in their schools. Thus the team was able to examine 91.75% of the children identified to have eye problems by the teachers. Also, the team had to examine only 13.69% of the total children enrolled in the project [Table/Fig-3]. The detailed data of vision screening of the school children is given in [Table/Fig-4].
Comparison of the number of children examined by teachers and the ophthalmology team
Detailed data of vision screening of school children in the first phase of the project.
| Categories | Males | Females | Total |
|---|
| Total no. of children enrolled in the study | 15837(52.3%) | 14461(47.7%) | 30298 |
| Total no. of children screened by trained teachers | 15787(52.3%) | 14418(47.7%) | 30205 |
| Children identified with eye problems by the teachers | 2167(47.9%) | 2356(52.1%) | 4523 |
| Total no: of children examined by ophthalmologist | 1986(47.9%) | 2164(52.1%) | 4150 |
| Total no: of children absent on the day of examination by ophthalmologist | 181(48.5%) | 192(51.5%) | 373 |
| Children identified with eye problems after confirmatory screening by ophthalmologist | 1003(46.9%) | 1134(53.1%) | 2137 |
| Children referred to the base hospital | 174(44.5%) | 217(55.5%) | 391 |
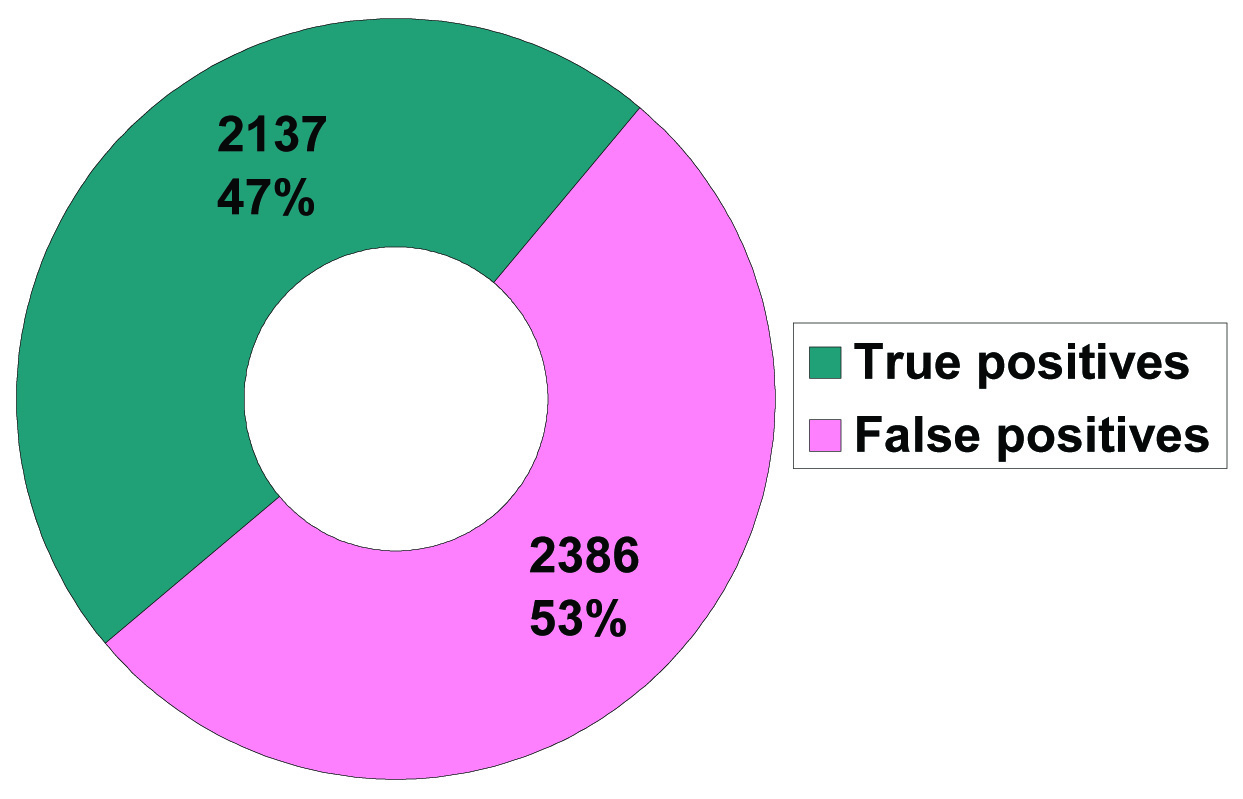
The team was not able to examine 373 children (8.24%) as they were absent from the school on the day of the visit by the team. The team confirmed eye problems in 2137 children (7.05% of the total children enrolled for the study). Thus the teachers were able to identify the eye problems correctly (signifying true positives) in 47.25% children, remaining 52.75% being false positives [Table/Fig-5].
Children identified as true positives and false positives, after examination by the ophthalmology team in phase 1 of the project
Out of the 2137 children identified as true positives, 78.9% were diagnosed to have refractive errors, 11.9% had allergic conjunctivitis, 2.8% had strabismus, 1.15 had Vitamin A deficiency, 0.8% had amblyopia and 0.1% had paediatric cataract [Table/Fig-6].
Diagnosis of children identified as true positives in the study.
| Type of ocular disorder | Males | Females | Total:2137 |
|---|
| Refractive errors | 759 | 927 | 1686 (78.9%) |
| Allergic conjunctivitis | 138 | 118 | 256 (11.9%) |
| Strabismus | 34 | 25 | 59 (2.8%) |
| Vitamin A deficiency | 12 | 11 | 23 (1.1%) |
| Amblyopia | 9 | 8 | 17 (0.8%) |
| Cataract | 1 | 1 | 2 (0.1%) |
| Others | 50 | 44 | 94 (4.4%) |
Spectacles were prescribed to 1581 children in their schools, out of which 651 spectacles were given free of cost to the poor children. A total of 391 children were referred to the base hospital for further evaluation.
In the second phase of the project, 6 teachers from 5 schools in Ludhiana were trained under the teacher’s training programme. The detailed data of vision screening of the school children done in this phase is given in the [Table/Fig-7].
Detailed data of vision screening of school children in the second phase of the project.
| Categories | Males | Females | Total |
|---|
| Total no. of children enrolled in the study | 294(44.3%) | 370(55.7%) | 664 |
| Total no. of children screened by trained teachers | 294(44.3%) | 370(55.7%) | 664 |
| Children identified with eye problems by the teachers | 80(65.6%) | 42(34.4%) | 122 |
| Total no: of children examined by ophthalmologist | 68(64.2%) | 38(35.8%) | 106 |
| Total no: of children absent on the day of examination by ophthalmologist | 12(75%) | 4(25%) | 16 |
| Children identified with eye problems after confirmatory screening by ophthalmologist | 25(51.1%) | 24(48.9%) | 49 |
| Children referred to the base hospital | 4(33.3%) | 8(66.7%) | 12 |
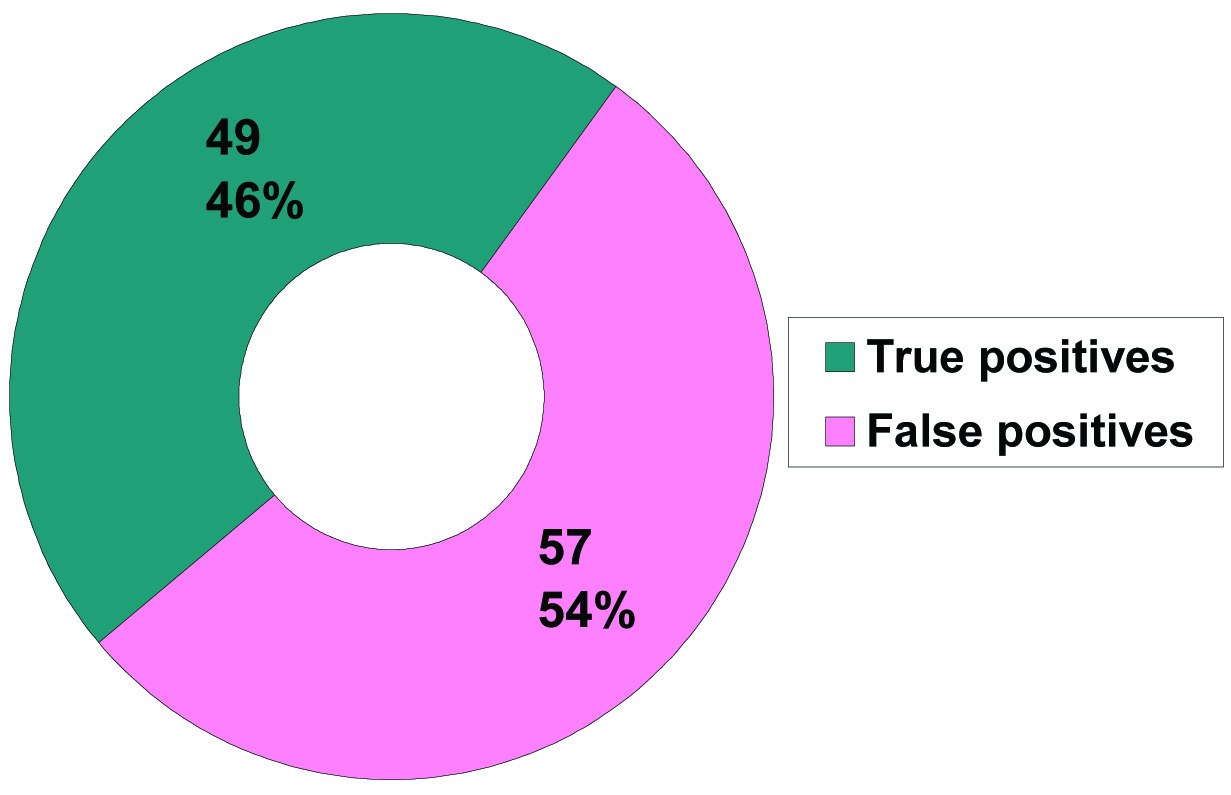
Out of the 106 children identified with problems by the teachers and re-examined by the ophthalmology team, 49(46.22%) children were identified as true positives and 53.78% children were identified as false positives after the final examination by the team [Table/Fig-8]. Out of these 49 true positive children, 25 children had refractive errors, 14 had allergic conjunctivitis, 5 had strabismus, 4 had signs of Vitamin A deficiency and 1 child had iris and choroidal coloboma.
Children identified as true positives and false positives, after examination by the ophthalmology team in phase 2 of the project
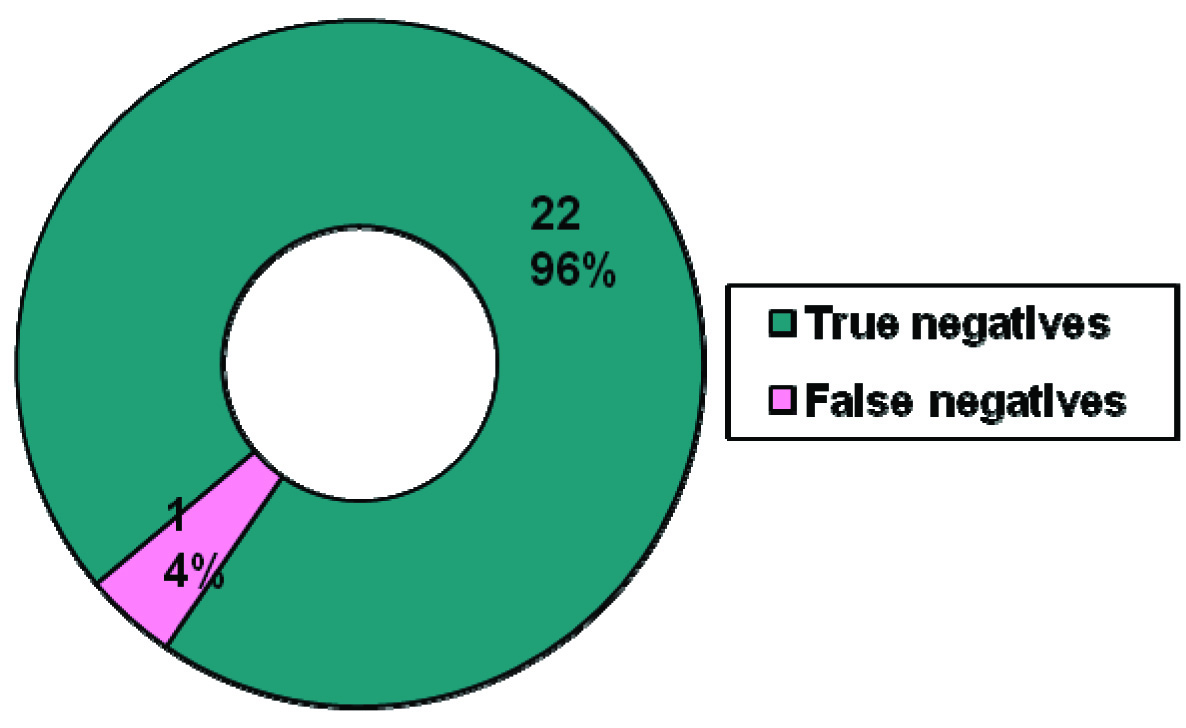
The ophthalmology team also examined another 23 children who were selected by random sampling from the children identified as normal by the school teachers. These included 12(52.2%) males and 11(47.8%) females. Out of these 23 children, 22(95.65%) children were identified as true negatives and 1(4.35%) child was identified as false negative [Table/Fig-9]. This false negative child was diagnosed to have choroidal coloboma with iris coloboma.
Children identified as true negatives and false negative, after examination by the ophthalmology team in phase 2 of the project
Discussion
School eye screening program is the second largest program of the National Program for Control of Blindness in India [6,11]. Traditionally, this screening is done by ophthalmologists and ophthalmic assistants [12]. In this project conducted by our department, the primary health care providers were substituted by the school teachers to do vision screening of the children in the schools. The teachers were able to screen 30205 children out of 30298 children enrolled, thus providing coverage of 99.7%. Coverage indicates the ability of an institute to organise the program, the benchmark being 80-100%. The benchmarks to monitor and evaluate the school eye screening have been given by Limburg et al., [9]. The organisation of the refractive services and the ability of teachers to follow up on referrals are indicated by the number of children examined by the ophthalmologist [6]. Limburg H et al., suggested that if the number of children examined by the ophthalmic assistant is less than 50% of those referred, the referral system needs to be checked [9]. In our project, the ophthalmology team was able to examined 91.8% of the children detected with eye problems by their teachers. The proportion of children screened, who are referred to an ophthalmologist and the proportion of children examined who are prescribed spectacles is an indicator of the quality of screening by the teachers. This indirectly is an indicator of the quality of the training of the teachers in vision screening. Limburg et al., suggested that the referral rates outside 5-10% and spectacle prescription rates less than 40% indicate the need to evaluate the training of the teachers [9]. In our project, the number of children referred to the ophthalmologist (15%) and the number of children prescribed spectacles (38.1%) was slightly outside the benchmarks proposed by Limberg et al., [9]. This indicates that the training of teachers needs to be re-evaluated and modified to make them more confident. The proportion of children referred to the base hospital indicates the confidence of the ophthalmology team. It was 9.4% in our project, the benchmark being 10-20% [9].
The effectiveness of the school screening program was assessed by the true positives, false positives, true negatives and false negatives. In the first phase of the project, 47.25% children were identified as true positives and 52.75% were identified as false positives. Thus the positive predictive value of the project was 47.25%.
The false positive rate is important as it is a measure of over-diagnosis/over-referrals by the teachers. Over-diagnosis and over-referrals means that the ophthalmology team has to additionally screen these children when actually they don’t need any screening. This indirectly increases the time and cost involved in the screening program. This may also increase the anxiety of the children (who have been falsely labeled as having a disease) and their care takers which may reduce their confidence in the program. Thus reducing the false positives will reduce the workload on the ophthalmology team and reduce the cost of the screening program.
The high false positive rate and low positive predictive value (47.25%) in our study indicates that the teachers over-diagnosed in nearly half of the children which also means that nearly half of the children examined by the teachers were unnecessarily re-examined by the ophthalmology team. The high false positive rates could be because the teachers were more cautious and labeled the child as having an eye problem whenever they (teachers) were in doubt. This can be sorted out by improving the quality of training given to the teachers, thus making them more confident. The over diagnosis by the teachers, in one way, may be acceptable also as this ensures that the teachers are trying to avoid missing out any child just because of their doubts. Another method to reduce the false positives is by using the 6/12 vision level as cut off instead of 6/9. Saxena et al., in their study showed that there was 44.6% reduction in total referral to the optometrist by using 6/12 as the cut off vision level [13].
In the second phase of the project, similar results were found in relation to true positives (46.22%), false positives (53.78%) and positive predictive values (46.22%). In this phase, by random sampling, the ophthalmology team identified 22 (95.65%) children as true negatives and 1(4.35%) child as false negative. Thus the negative predictive value of this project was as high as 95.65% which is an indicator of the effectiveness of the program.
The false negative rate is important as it indicates the number of abnormal children missed by the teachers, which in turn reflects the quality of training to teachers. School eye screening programs should aim for a low false negative rate as this may be the only chance for many of these children to undergo an eye examination and be picked up if having a problem. Thus in any school screening program, high false positive rates may be acceptable but a high false negative rate is not at all acceptable.
The low false negative rate of 4.35% and the high negative predictive value of 95.65% for the present project indicates that the teachers were not unnecessarily identifying the children with eye problems when they were sure that the child’s eye was normal. This ensures that children who need eye care services are not missed out. Considering the teachers and the ophthalmology team to be the major stakeholders of this program, their workload needs to be assessed for the proper functioning of the program. There is a much voiced concern that this program may increase the workload of the teachers and may interfere in their primary responsibility of teaching. In our project, on an average, each teacher screened about 119 children in a year and referred about 18 children for further examination to the ophthalmologist. Presuming that it takes 5 minutes to screen a child, each teacher is estimated to have spent 9-10 hours in a year to screen children with an additional 8 hours spent for training. This accounts to not more than 17-18 hours in a year. On the other hand, the workload of the ophthalmologist and his team is reduced significantly. In our project, the ophthalmologist had to examine only 13.69% and 15.9% of the total children enrolled for the study in the first phase and the second phase respectively. Use of trained health workers [7,9] and teachers [6,13] as an alternative to ophthalmologists has been discussed in previous studies. The findings of our program are in agreement with the observations of studies conducted by Sudhan et al., and Saxena et al., ([Table/Fig-10] shows comparison between various studies) and reinforces the fact that there are substantial benefits of introducing teachers as first level vision screeners [6,13].
Comparison of present study with the previous studies.
| Study→Indicators↓ | Present studyPhase 1 | Present studyPhase 2 | Sudan2009 | Saxena2015 | Limburg1999 |
|---|
| Number of schools covered | 166 | 5 | 20 | 530 | 32848 |
| Number of teachers trained | 253 | 6 | 40 | 530 | 32848 |
| Number of students enrolled | 30,298 | 664 | 10,114 | 77,778 | 5,389,065 |
| % of children screened by teachers | 99.7% | 100% | 97.3% | 88.50% | - |
| % of children referred by teachers to ophthalmology team | 14.97% | 18.37% | 17.3% | 4.91% | 4.3% |
| % of children examined by ophthalmology team | 91.75% | 86.88% | - | 77.32% | 89.1% |
| True positives | 47.25% | 46.22% | 67.02% | 42.03% | 26.50% |
| False positives | 52.75% | 53.78% | 32.98% | 57.97% | 73.50% |
| True negatives | - | 95.65% | 96.33% | 93.92% | - |
| False negatives | - | 4.35% | 3.67% | 6.08% | - |
Limitation
The only drawback of this method of vision screening is that the children who do not attend the schools are missed.
Conclusion
Utilizing the services of the teachers for vision screening of the school children in their schools significantly reduces the workload of the ophthalmology team. The observation that only a very small proportion of abnormal children were missed by the teachers in this project shows that the teachers can effectively perform vision screening of children and refer children with eye problems. Taking into consideration the benefits of this program, simplicity of the procedure, the ease of its application and the wider coverage provided, it can be concluded that introducing teachers as primary vision screeners in their schools is an innovative community based strategy to address the challenges of childhood blindness.