Application of Radial Basis Function Network Tool for Correlation of CD4+ Count with Plasma Viral Load in HIV-Seropositive Individuals
Arnaw Kishore1, Sumana M. Neelambike2
1 Senior Research Fellow, Department of Microbiology, J.S.S Medical College and Hospital, J.S.S University, Mysore, Karnataka, India.
2 Professor, Department of Microbiology, J.S.S Medical College and Hospital, J.S.S University, Mysore, Karnataka, India.
NAME, ADDRESS, E-MAIL ID OF THE CORRESPONDING AUTHOR: Dr. Arnaw Kishore, Senior Research Fellow, J.S.S Medical College and Hospital, J.S.S University, Mysore, Karnataka, India.
E-mail: kishore.arnaw@gmail.com
Introduction
Human Immunodeficiency Virus (HIV) infects and cripples the immune system of the body. The two important marker CD4+T cells and Plasma viral load are crucial not only in understanding the disease progression but also in starting the antiretroviral therapy. A lot of research is going on in understanding the dynamic nature of HIV.
Aim
To find the correlation between CD4+ count and Plasma Viral Load (PVL) measured by two different technologies; with the help of correlation technique in conjunction with the three dimensional HIV model with a purpose of establishing a mathematical model between the CD4+ cells and PVL using a sinusoidal function as well as Radial Basis Function (RBF) neural network.
Materials and Methods
Plasma Viral Load were determined by two different methods viz Exavir CavidiTM and Abbott Real time HIV-1 assay and then they were correlated with the CD4+ count with the help of computational intelligence in predicting viral load.
Results
It was found that there exists a positive correlation between the CD4+ cells and viral loads. A correlation value of 0.4082 and 0.3652 was observed between CD4+ cells and viral measured using Exavir CavidiTM and Abbott Real time HIV-1 assay respectively.
Conclusion
The existence of positive correlation had helped us to understand the nature and dynamic of the existence of HIV and how the CD4 + and PVL act.
Antiretroviral Therapy, HIV infection, Immune system
Introduction
Human Immunodeficiency Virus (HIV), infection is one of the important causes of death in the world. The virus attacks and infects T- helper cells (CD4+ cells) which are crucial to maintain the immune status of the person. The degradation of T–helper cells weakens the immune system which leads to multiple infections which ranges from pneumonia to cancer. Almost nine million Human Immunodeficiency Virus/Acquired Immunodeficiency Syndrome (HIV/AIDS) infected individuals are on Antiretroviral Therapy (ART) worldwide by mid of 2013 and probably same have been on treatment for 10 years or more [1]. There are lot of disease where the progress of the disease depends upon the genetic constitution of the individual, hence the prognosis of a patient with HIV infection becomes difficult to predict [1]. A lot of research is going in the field of HIV/AIDS in terms of better diagnosis and prognosis like drug resistance testing, predicting side effects for certain regimens etc which in itself is a huge challenge as one patient differs from other patient in terms of medical history, response to therapy, immune response etc towards highly active antiretroviral therapy (HAART) [2]. Many HIV dynamic models have been proposed by researchers [3–5] to provide theoretical principles for development of treatment strategies for HIV infected patients [6]. Recent studies have shown that computational intelligence has been widely used in medical diagnosis to solve complex problems by developing decision support system with the application of Neural Network algorithms which are useful in prediction of most of the medical problems. Computer support has become an essence in day to day diagnosis, prognosis and therapy though a little emphasis is given to it. It has many algorithms for classification, prediction, image processing etc., which can be implemented by the health services [2]. Analysis of the interaction between HIV-1 and the immune system is highly useful for understanding the dynamics of the disease [7]. In this study we applied some of the Neural Network; Radial Basis Function Network algorithms for predicting PVL in HIV/AIDS patients with the help of CD4+ in three different range which has been described below.
Radial Basis Function Network
The Radial Basis Function Network is an artificial neural network, which comprises of three layers, the input, hidden and output layer. The nodes within each layer are fully connected to the previous layer. The input layer is attached to the input variables and these nodes are attached to the hidden layer which in turn consists of the hidden nodes in these hidden nodes radial basis function are present. The input layers consist of neuron for each predictor variable. The main function of input neuron is to feed the value to the hidden layer which is done by standardizing the range of values by subtracting the median and dividing the inner quartile range. The hidden layer has a variable number of neuron which comprises of radial basis function centered on a point with multiple dimensions, the radius of RBF function differ with each dimensions. The values coming out from hidden layer neuron is multiplied by the weight associated with the neuron this in turn is passed to summation which adds up the weighted value and present this sum as the output of the network [8].
Aim
The objective of this work was to establish a correlation between CD4+ count and Plasma Viral Load (PVL) measured by two different technologies using a Radial Basis Function (RBF) neural network in conjunction with the three dimensional HIV model
Materials and Methods
The study was carried out for a period of 2 years from January 2014 to December 2015 after obtaining the ethical clearance from the Ethical committee. Blood samples of the patients were collected with written informed consent and HIV testing was performed as per NACO guidelines. Samples tested positive for HIV were sent for further analysis of CD4+ cell count and PVL testing. One hundred thirty three patients were included in the study which comprised of HIV naïve patients and HIV sero positive patients who were on anti retro viral treatment for 1 year or more and CD4+ was done by flow cytometer, a technique that measures and analyses multiple physical and chemical characteristics of single cells or other biological particles. PVL was performed by two different methods, only for HIV–1 by Cavidi ExaVir™, and, Abbott Real time HIV-1 assay. The Cavidi ExaVir™ works with the reverse transcriptase enzyme while Abbott Real time HIV-1 assay involves the genome of the HIV – 1. To get a better, correlation of PVL with CD4+ these two technologies were employed as the principle of these two technologies is entirely different from one another.
The CavidiExaVir™ can detect 30 samples at a time and works on the principle of enzyme linked immunosorbant assay (ELISA). The HIV virion is purified from the plasma by removing contamination and inhibitors by using an extraction device. The extract is lysed to release reverse transcriptase enzyme which is added to a microtitre plate coated with poly-A oligonucleotides. The enzyme reverse transcriptase gets incorporated to BrdUTP (anti bromo-deoxy-ribouridine monophosphate) into cDNA, using the poly – A oligonucleotides as templates. The whole set is incubated at 33°C for 48 hours. Alkaline phosphatase-conjugated anti–BrdUTP antibody and a substrate are sequentially added to achieve colorimetric detection, reading is taken at 405nm and values are recorded. The Abbott Real Time HIV–1 assay which identifies all the variants of HIV–1, incorporates an internal control, not related to target sequence of HIV–1 in negative human plasma. The hydroxyl-pyruvate reductase gene is introduced at the beginning of sample preparation into each specimen. This assay amplifies a fragment of 172 nucleotides from the integrase gene. During each round of Polymerase Chain Reaction (PCR), the amplified product denatures, separates into two and then primer annealing and extension takes place at lower temperature. The cycle is repeated “n” number of times and amplification of both the targets of HIV – 1 and internal control, take place simultaneously in same reaction. The HIV-1 variant is detected by the help of fluorescent dye.
All the performed test data from two different technologies were recorded and a correlation between CD4+cell count and PVL was done. The CD4+cell count were divided into three ranges a. 0-250; b. 250-500; c. 500-1000, and, the correlation between the measured CD4+ values and PVL were analysed using the Pearson correlation technique. Further, an attempt has been made to mathematically model the relation between the CD4+cells and PVL using a sinusoidal function as well as Radial Basis Function (RBF) neural network. In this work, the correlation between the measured CD4+cell count and HIV-1 viral load has been analysed extensively.
The Radial Basis Function Neural Network
Radial basis function networks are highly useful for modelling complex relationships between the independent and dependent variables. The network consists of three layers: an input layer, a hidden layer, and an output layer. The hidden layer of the RBF network can be viewed as a function that maps the input patterns from a nonlinear separable space to a linear separable space. In the new space, the responses of the hidden layer neurons form new feature vectors for pattern representation. An activation function for a hidden layer node is a radial symmetric function, whose output reduces to zero as the distance between the input vector and its centre increases [9].
The response characteristics of the jth hidden unit is a gaussian function given by:
where ψh is the output value of the hidden node h
Ch – is the center of the Gaussian
σh– is the standard deviation (width) of the function
X – is the network input vector.
The response of an output node m of the network can be expressed as
where Whm is the weight connecting hidden node h with output node m.
Statistical Analysis
Pearson correlation technique in conjunction with the three dimensional HIV model, Radial Basis Function (RBF) neural network was applied.
Results
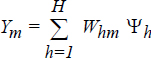
The correlation of CD4+ cells with measured PVL is presented in [Table/Fig-1,2 and 3]. The correlation between PVL and CD 4+cells in the range of 500-1000 cells/mm3 is presented in [Table/Fig-1a&b]. It was found that there exists a positive correlation between the CD4+cells and viral loads. A correlation value of 0.4082 and 0.3652 was observed between CD4+ cells and viral load measured using Exavir CavidiTM and Abbott HIV Real time assay respectively. The correlation between the CD4+ cell count measured in the range of 0-250 cells/mm3 and HIV – 1 viral load measured using Cavidi and PCR is shown in [Table/Fig-2a&b] respectively. It was seen that there existed a poor correlation between the HIV – 1 PVL by Abbott Real Time HIV – 1 assay and CD4+cells measured in this range. It was found that the CD4+cells correlate with the HIV-1 PVL by Abbott HIV Real time assay with a correlation value of – 0.3592. However, in the case of the viral load measured using Exavir CavidiTM, a more significant correlation of – 0.5383 was found to exist between the PVL and CD4+ cells. In both cases an inverse relation was observed between the CD4+ cells and PVL. Further, the correlation between the viral load and CD4+ cells measured in the range of 250 - 500 cells/mm3 is presented in [Table/Fig-3a&b] for Exavir CavidiTM and Abbott HIV Real time assay, respectively. It was observed that the correlation was very poor with correlation values of – 0.1940 and – 0.1889 for Exavir CavidiTM and Abbott HIV Real time assay, based measurements, respectively. In this range also, it was found that there exists an inverse relation between the CD4+cells and PVL. Similarly, the correlation between PVL and CD4+ cells in the range of 500-1000 cells/mm3 is presented I [Table/Fig-3a&b]. It was found that there exists a positive correlation between the CD4+cells and viral loads. A correlation value of 0.4082 and 0.3652 was observed between CD4+ cells and viral load measured using Exavir CavidiTM and Abbott HIV Real time assay, respectively.
The correlation between CD 4+cells (range 500-1000) and PVL {Exavir CavidiTM (a) and Abbott Real Time HIV – 1 assay(b)}
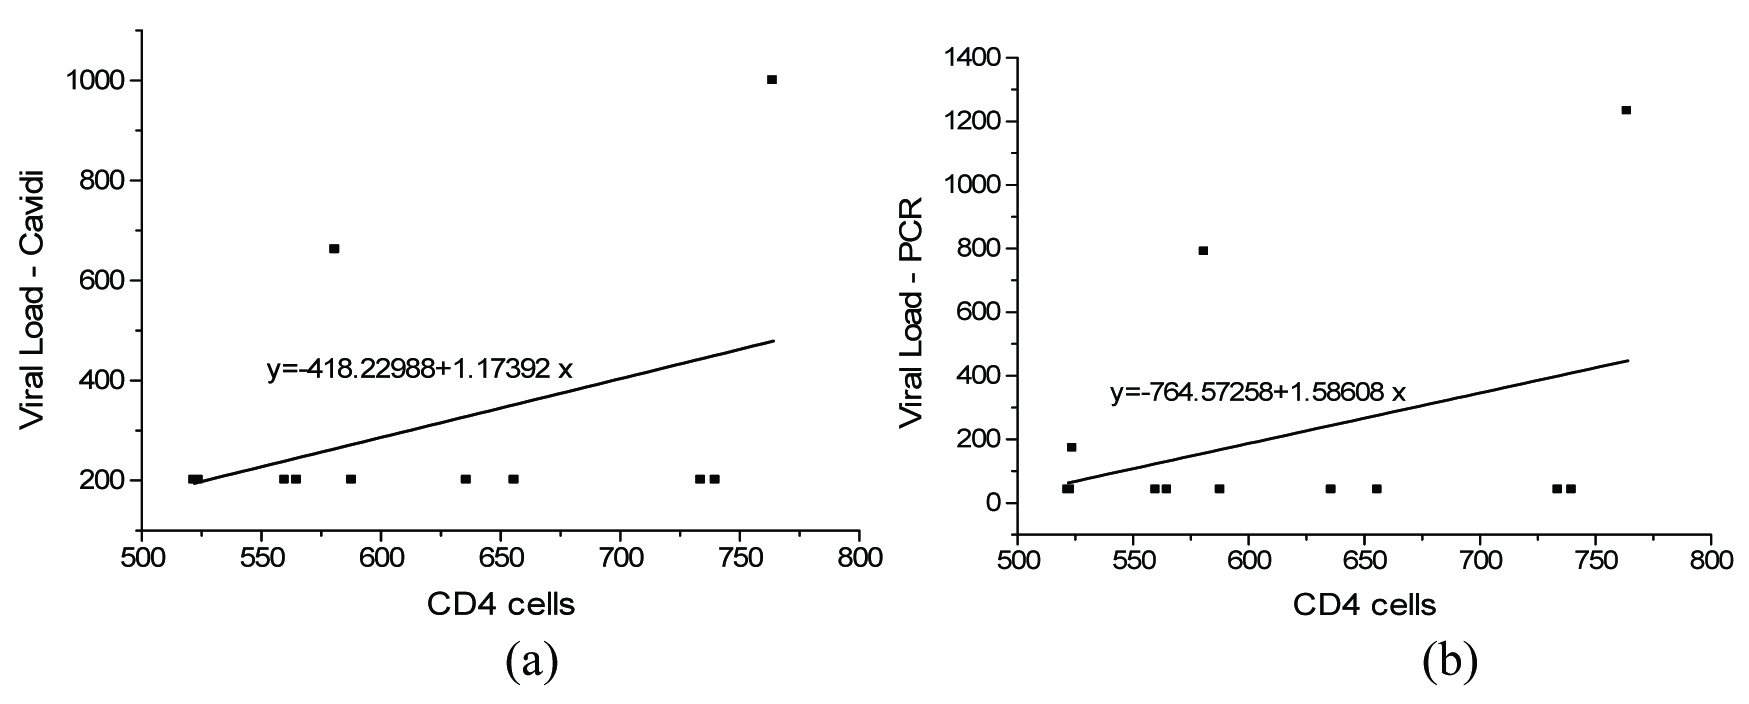
The correlation between CD 4+cells (range 0-250) and PVL {Exavir CavidiTM (a) and Abbott Real Time HIV – 1 assay(b)}
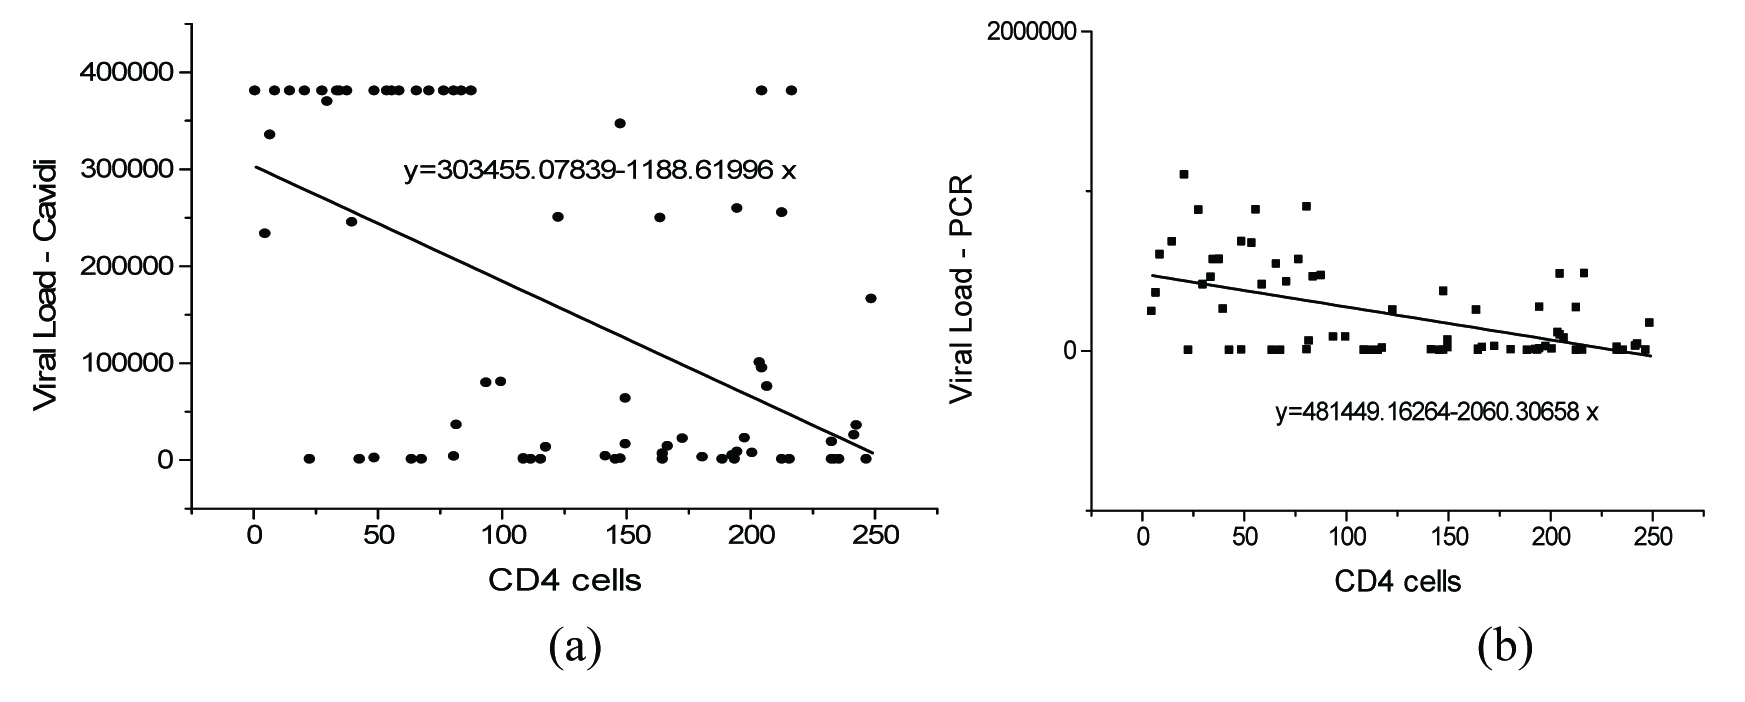
The correlation between CD 4+cells (range 250-500 cells/mm3) and PVL {Exavir CavidiTM (a) and Abbott Real Time HIV – 1 assay(b)}

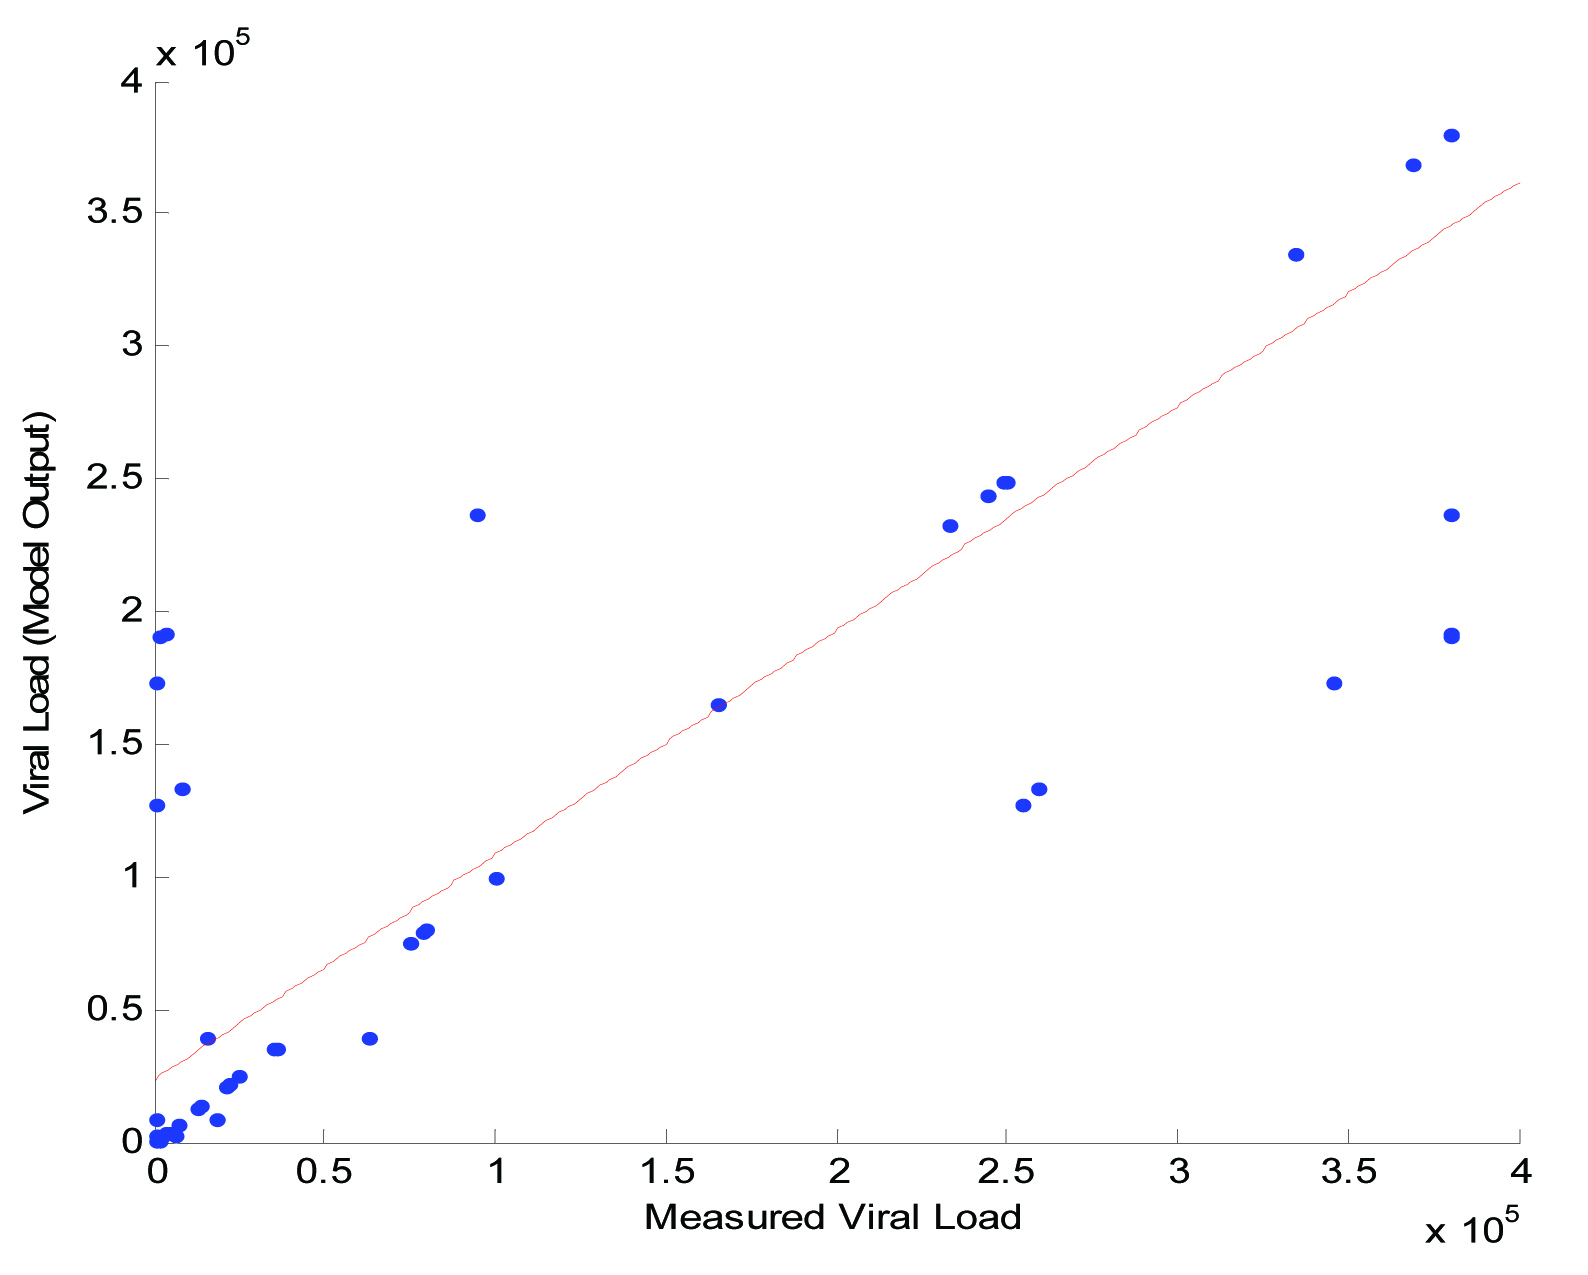
Finally, the modeling results of RBF neural network are presented in [Table/Fig-4]. It was found that the actual values of viral load and the RBF estimated values of viral load correlate well with each other with a correlation value of 0.9201. It was found that the model efficiency was observed to be high when compared to other developed models. It appears that the model can efficiently predict values of viral load from measured CD4+ cells.
The actual viral load and viral load estimated using RBF neural network.
Discussion
Plasma Viral Load (PVL) and CD4+T lymphocytes are two important markers in HIV diagnosis and prognosis. The importance of CD4+ cell in several chronic viral infections has been well documented [10] and has been proved as major marker for subsequent disease progression and survival [11,12]. In past three decade CD4+ count determination has played a crucial role in understanding HIV disease progression and in initiating ART in developing and under developed world, yet little is known about the presence of these responses in setting of HIV infection. HIV infection is characterized by depletion of CD4+ and expansion of CD8 cells which leads to altering the dynamic nature of CD4+ and CD8 cells which, in turn, leads to immune paralysis. Though both show evidence of increased proliferation and preferential loss of the naive subset, there is depletion of CD4+ cells and expansion of CD8 cells [13–16]. The CD 4+ must be checked at least once in 6 months to access the immunological response to therapy and need for continuation or discontinuation of prophylaxis for opportunistic infection [17]. PVL is a very important marker in HIV therapy, the level of PVL decreases in response to proper ART giving an idea of disease progression. Several systematic reviews of data from clinical trials involving thousands of participants have established that decreases in viral load following initiation of ART are associated with reduced risk of progression to AIDS or death [18–20]. Thus: viral load testing is an established surrogate marker for treatment response [21]. The main aim of ART is to decrease the viral load. Various different methods employed for the detection of the PVL cannot distinguish between infectious and non infectious particles, though high copy numbers of HIV – 1 can reach in plasma, only few of them has been described to be positive [22–26]. Commercially available assay used to detect PVL are not able to distinguish between HIV –1 and HIV – 2. Moreover, optimal viral suppression is viral load persistently below the level of detection (HIV RNA <20 to 75 copies/ml, depending on the assay used), isolated blips are not uncommon in successfully treated patients and are not predictive of virologic failure [27].
The mathematical correlations by both the technologies viz Cavidi ExaVir™ and Abbott Real time HIV-1 have almost similar output which rule out the variation in the principle of the two technologies. There has been some amount of work on prediction of HIV drug resistance with neural networks and application RBN model for HIV/AIDS Regimen [8,28,29] and other computational analysis on Protease gene and prediction of antiretroviral susceptibility from HIV-1 [30–33]. Application of radial neural network has been less applied and probably this is a first of its study where the application of radial neural network along with Pearson correlation technique has been applied to understand the mathematical correlation between the CD4+ count and the PVL.
In our study, we got a positive correlation between PVL and CD4+ cells in the range of 500-1000 cells/mm3 which gives a new hope that some where these HIV markers will give a positive correlation opening a new window in HIV regime in countries where PVL testing is less affordable. The major limitation of the study includes the less sample size.
Conclusion
Estimation of PVL along with CD4+ is quite an important tool as far as initiation of ART is considered. Due to high cost and unavailability of apparatus for measurement of PVL in resource limited settings, CD4+ estimation is an alternative. We applied the Pearson correlation technique in conjunction with the three dimensional HIV model, Radial Basis Function (RBF) neural network to analyse the correlation of CD4+ with PVL, it was observed that there exists a positive correlation in a CD4+ range of 500–1000cells/mm3. This correlation may help the physicians to start any treatment based on the CD4+ in patients whose PVL has not been done. The improvements that can be done in continuation of this research are use of large data size with multiple centre involvement. More such research with mathematical approach and application needs to be done for a standard outcome.
[1]. Florence M, Balasubramanie P, Neural Network Model in HIV / AIDS ApplicationJournal of Global Research in Computer Science 2010 1(1):24-32. [Google Scholar]
[2]. Basavarajaiah DM, Leelavathy B, Prabhakar B, Chandrashekar P, Neural Network Modelling in HIV/AIDS – Five Years Survival Cohort DataInternational Journal of Engineering Science and Innovative Technology 2012 1(2):86-94. [Google Scholar]
[3]. Wu H, Ding AA, De Gruttola V, Estimation of HIV dynamic parametersStatistics in Medicine 1998 17:2463-85. [Google Scholar]
[4]. Perelson AS, Nelson PW, Mathematical analysis of HIV-1 dynamics in vivoSIAM Review 1999 41:3-44. [Google Scholar]
[5]. Ngarakana-Gwasira ET, Bhunu CP, Mushayabasa S, HoveMusekwa SD, Garira W, Tchuenche JM, Exploring the effects of parameter heterogeneity on the intrinsic dynamics of HIV/AIDS in heterosexual settingsInternational Journal of Biomathematics 2011 4:75-92. [Google Scholar]
[6]. Huang Y, Liu D, Wu H, Hierarchical Bayesian methods for estimation of parameters in a longitudinal HIV dynamic systemBiometrics 2006 62:413-23. [Google Scholar]
[7]. Perelson AS, Neumann AU, Markowitz M, Leonard JM, Ho DD, HIV-1 dynamics in vivo: Virion clearance rate, infected cell lifespan, and viral generation timeScience 1996 271:1582-86. [Google Scholar]
[8]. Balasubramanie P, Lilly Florence M, Application of Radial Basis Network Model for HIV/AIDs Regimen SpecificationsJournal of Computing 2009 1(1):136-40. [Google Scholar]
[9]. Manoharan SC, Ramakrishnan S, Prediction of forced expiratory volume in pulmonary function test using radial basis neural networks and k-means clusteringJ Med Syst 2009 33(5):347-51. [Google Scholar]
[10]. Virgin HW, Wherry EJ, Ahmed R, Redefining chronic viral infectionCell 2009 138:30-50. [Google Scholar]
[11]. Egger M, May M, Chene G, Prognosis of HIV-1-infected patients starting highly active antiretroviral therapy: a collaborative analysis of prospective studiesLancet 2002 360(9327):119-29. [Google Scholar]
[12]. Mellors JW, Munoz A, Giorgi JV, Plasma viral load and CD 4+lymphocytes as prognostic markers of HIV-1 infectionAnn Intern Med 1997 126(12):946-54. [Google Scholar]
[13]. Sachsenberg N, Perelson AS, Yerly S, Schockmel GA, Leduc D, Hirschel B, Turnover of CD 4+and CD8+ T lymphocytes in HIV-1 infection as measured by Ki-67 antigenJ Exp Med 1998 187:1295-303. [Google Scholar]
[14]. Ho DD, Neumann AU, Perelson AS, Chen W, Leonard JM, Markowitz M, Rapid turnover of plasma virions and CD4 lymphocytes in HIV-1 infectionNature 1995 373:123-26. [Google Scholar]
[15]. Kovacs JA, Lempicki RA, Sidorov IA, Adelsberger JW, Herpin B, Metcalf JA, Identification of dynamically distinct subpopulations of T lymphocytes that are differentially affected by HIVJ Exp Med 2001 194:1731-41. [Google Scholar]
[16]. Lempicki RA, Kovacs JA, Baseler MW, Adelsberger JW, Dewar RL, Natarajan V, Impact of HIV-1 infection and highly active antiretroviral therapy on the kinetics of CD 4+and CD8+ T cell turnover in HIV-infected patientsProc Natl Acad Sci USA 2000 97:13778-83. [Google Scholar]
[17]. Panel on Antiretroviral Guidelines for Adults and Adolescents: guidelines for the use of antiretroviral agents in HIV-1-infected adults and adolescents. Department of Health and Human Services, 1–288 (2015). www.aidsinfo.nih.gov/ContentFiles/ Adult and Adolescent GL.pdf [Google Scholar]
[18]. Murray JS, Elashoff MR, Iacono-Connors LC, Cvetkovich TA, Struble KA, The use of plasma HIV RNA as a study endpoint in efficacy trials of antiretroviral drugsAIDS 1999 13(7):797-804. [Google Scholar]
[19]. Marschner IC, Collier AC, Coombs RW, Use of changes in plasma levels of human immunodeficiency virus type 1 RNA to assess the clinical benefit of antiretroviral therapyJ Infect Dis 1998 177(1):40-47. [Google Scholar]
[20]. Thiebaut R, Morlat P, Jacqmin-Gadda H, with the Groupe d’Epidemiologie du SIDA en Aquitaine (GECSA)Clinical progression of HIV-1 infection according to the viral response during the first year of antiretroviral treatmentAIDS 2000 14(8):971-78. [Google Scholar]
[21]. Human immunodeficiency virus type 1 RNA level and CD4 count as prognostic markers and surrogate end points: a meta-analysis. HIV Surrogate Marker Collaborative GroupAIDS Res Hum Retroviruses 2000 16(12):1123-33. [Google Scholar]
[22]. Andreoni M, Sarmati L, Ercoli L, Nicastri E, Giannini G, Correlation between changes in plasma HIV RNA levels and in plasma infectivity in response to antiretroviral therapyAIDS Res Hum Retroviruses 1997 13:555-61. [Google Scholar]
[23]. Coombs RW, Collier AC, Allain JP, Nikora B, Leuther M, Gjerset GF, Plasma viremia in human immunodeficiency virus infectionN Engl J Med 1989 321:1626-31. [Google Scholar]
[24]. Escaich S, Ritter J, Rougier P, Lepot D, Lamelin JP, Sepetjan M, Plasma viraemia as a marker of viral replication in HIV-infected individualsAIDS 1991 5:1189-94. [Google Scholar]
[25]. The Division of AIDS, National Institute of Allergy and Infectious Diseases, J.H., National Institute of Health, J.H., 1997. Virology Manual for HIV Laboratories [Google Scholar]
[26]. Vella S, Galluzzo MC, Giannini G, Pirillo MF, Andreotti M, Tomino C, Plasma HIV-1 copy number and in vitro infectivity of plasma prior to and during combination antiretroviral treatmentAntiviral Res 2000 47:189-98. [Google Scholar]
[27]. Havlir DV, Bassett R, Levitan D, Prevalence and predictive value of intermittent viremia with combination HIV therapyJAMA 2001 286(2):171-79. [Google Scholar]
[28]. Drghici S, Potter RB, Predicting HIV drug resistance with neural networksBioinformatics 2003 19(1):98-107. [Google Scholar]
[29]. Potter RB, Draghici S, A SOFM approach to predicting HIV drug resistancePac Symp Biocomput 2002 :77-87. [Google Scholar]
[30]. Zazzi M, Romano L, Venturi G, Shafer RW, Reid C, Dal Bello F, Comparative evaluation of three computerized algorithms for prediction of antiretroviral susceptibility from HIV type 1 genotypeJ Antimicrob Chemother 2004 53(2):356-60. [Google Scholar]
[31]. Ko GM, Reddy AS, Kumar S, Bailey BA, Garg R, Computational analysis of HIV-1 protease protein binding pocketsJ Chem Inf Model 2010 50(10):1759-71. [Google Scholar]
[32]. Liang J, Edelsbrunner H, Woodward C, Anatomy of protein pockets and cavities: measurement of binding site geometry and implications for ligand designProtein Sci 1998 7(9):1884-97. [Google Scholar]
[33]. Garriga C, Menéndez-Arias L, DR_SEQAN: a PC/Windows-based software to evaluate drug resistance using human immunodeficiency virus type 1 genotypesBMC Infect Dis 2006 6:44 [Google Scholar]