Successful endodontic treatment depends upon the quality of root canal preparation, three dimensional obturation and the coronal restoration. Ingle found that among the endodontic failures, 60% were due to incomplete obturation of the root canal system [1–3]. So it is indispensable that the root canal filling should be three dimensional and result in fluid tight seal, particularly in the last few millimeters of the apical area [4].
Cold lateral compaction is the most widely used and considered to be the gold standard technique after being successfully tested [5–10]. Incomplete fusion of the gutta-percha cones, voids and lack of surface adaptation are the main drawbacks with this technique. Warm lateral compaction produces superior quality of obturation when compared to cold lateral compaction but does not simulate the canal anatomy in all situations [11,12]. Warm vertical compaction technique introduced by Herbert Schilder in 1967 could fill the accessory canals and canal ramifications. But the main drawbacks are that it takes longer time and the procedure is difficult to follow [13,14].
Yee et al., in 1977 has introduced a new technique that utilizes the thermoplasticized gutta-percha to flow and fill the root canal. This device has now evolved into Obtura III [15,16]. This technique proved to be better in replicating the canal anatomy. Apical extrusion, voids and lack of material control are found to be the main drawbacks [5]. There is lack of literature regarding the quality of obturation with Obtura at different sizes of apical preparation.
There are various methods of microleakage evaluation of which dye penetration method is simple and effective [17].
This study was designed to determine the apical microleakage after obturation with Obtura, at different sizes of apical preparation. The null hypothesis tested was that microleakage may not vary with different sizes of apical preparation after obturation with Obtura.
Materials and Methods
This invitro study was performed in 60 human single rooted teeth in patients of age group greater than 40 years that were extracted for periodontal reasons. The inclusion criteria were: teeth having single straight canals assessed radiographically, teeth with fully formed apices, absence of root caries, cracks, and structural defects. Teeth with wider canals radiographically (ISO size greater than 20) were excluded from the study. All the teeth were debrided and stored in deionized water containing thymol until use.
The teeth were decoronated upto cementoenamel junction. The working length was determined to be 1mm short of the radiographic apex. Teeth were distributed into six groups (n=10) randomly. Cleaning and shaping was done in all the groups by crowndown technique. Irrigation was done with 2ml of 3% sodium hypochlorite (Prime Dental Products Pvt. Ltd, Thane, India) after each instrumentation. Smear layer removal was done with 5ml of 17% EDTA and was used as the final irrigant (Prime Dental Products Pvt. Ltd, Thane, India).
Group I (Lateral compaction group): Apical preparation was done upto three sizes larger than the initial apical file (IAF). A standardized master gutta-percha cone (Dentsply Maillefer, Ballaigues, Switzerland) was selected, placed into the canal and checked for tugback. Obturation was done by lateral compaction technique using AH plus sealer.
Groups II to VI (Obtura groups): In groups II, III, IV and V apical preparations were done upto ISO sizes 20, 30, 40 and 50 with ProTaper rotary files F1, F3, F4 and F5 respectively (Dentsply Maillefer, Ballaigues, Switzerland). In group VI apical preparation was done upto protaper F5 followed by 60size K-file. Obtura system (Obtura Sparton, Fenton, Missouri, USA) was used according to the manufacturer’s instructions. Twenty three gauge needles were used for all the obturations and the tip was placed at 3-5mm short of the working length. AH plus sealer was applied to the canal walls. After heating the Obtura unit to 185oc the needle was placed at the desired length and injected passively. This procedure was done until gutta-percha was observed at the coronal portion of the root.
Radiographic assessment of obturations in all the groups was done to visualize the extension of gutta-percha. The coronal parts of the roots were restored with Type II Glass ionomer cement of 3mm thickness. Teeth were placed in 100% humidity for seven days to allow the sealer to set completely.
Leaving 3mm from the apical portion of the root, the remaining surface of the roots were painted with two coats of nail varnish and allowed to dry for one day. After drying, the specimens were placed in 2% methylene blue dye solution for one day. Then the specimens were removed and washed under running tap water to remove excess dye [4]. Transverse sectioning was done at 1mm, 3mm and 5mm short of the apex with diamond disc at slow speed and water coolant. Each section was sub divided into four regions by overlapping a cross frame. The presence of dye leakage was considered when assessing every section under stereomicroscope at 20X magnification.
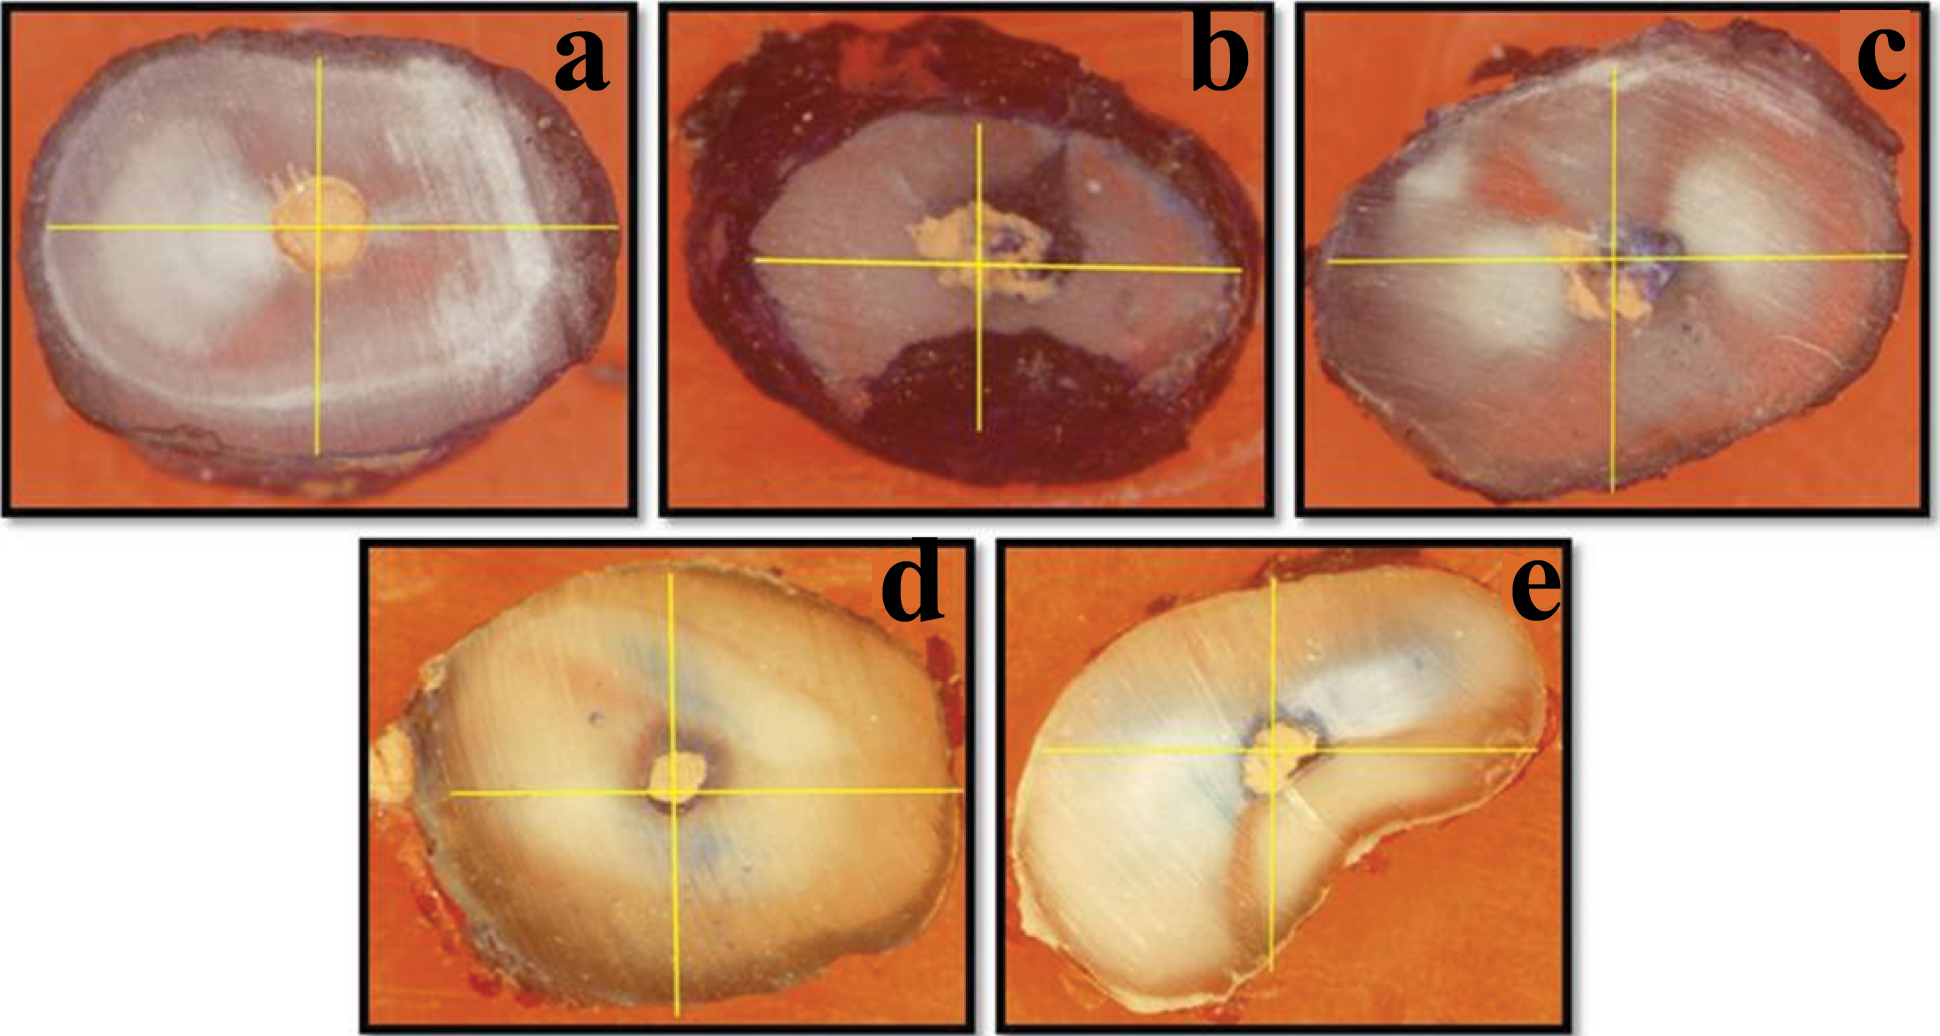
The degree of dye leakage was scored as: Score 0: No dye leakage [Table/Fig-1a], Score 1: Dye leakage in any one region [Table/Fig-1b], Score 2: Dye leakage in any two regions [Table/Fig-1c], Score 3: Dye leakage in any three regions [Table/Fig-1d], Score 4: Dye leakage in all the four regions [Table/Fig-1e].
(a) Specimen showing score 0, (b) Specimen showing score 1, (c) Specimen showing score 2, (D) Specimen showing score 3, (e) Specimen showing score 4.
Statistical Analysis
The mean scores of microleakage were calculated and statistical analysis was done by Mann-Whitney U test to compare the microleakage between the groups. In the present study p ≤ 0.05 was considered as the level of significance.
Results
The lowest mean microleakage score was seen in Group VI (0) and the highest mean leakage score was seen in Group II (1.5) [Table/Fig-2]. There was statistically significant difference between Group II and Group V (p = 0.044), Group II and Group VI (p = 0.013). There was no significant difference between other groups (p > 0.05) [Table/Fig-3].
Leakage scores in different groups and One-way ANOVA.
| Group | No of Specimens | Leakage Scores | | |
|---|
| Score 0 | Score 1 | Score 2 | Score 3 | Score 4 | X* | Mean Score | One-WayAnovap-value |
|---|
| GROUP I(Lateral compaction) | 10 | 8 | 1 | 1 | 0 | 0 | 3 | 0.30 | <0.05 |
| GROUP II (ISO size 20) | 10 | 5 | 0 | 2 | 1 | 2 | 15 | 1.50 |
| GROUP III(ISO size 30) | 10 | 8 | 1 | 1 | 0 | 0 | 3 | 0.30 |
| GROUP IV (ISO size 40) | 10 | 7 | 1 | 1 | 0 | 0 | 3 | 0.30 |
| GROUP V(ISO size 50) | 10 | 9 | 0 | 1 | 0 | 0 | 2 | 0.20 |
| GROUP VI (ISO size 60) | 10 | 10 | 0 | 0 | 0 | 0 | 0 | 0.00 |
*The mean difference is significant at the 0.05 level. Statistically significant values are in bold
Tukey pair wise multiple comparison test to determine the significant difference in microleakage between groups.
| Dependent variable | Mean Difference (I-J) | Std. Error | p-value | 95% Confidence Interval |
|---|
| Lower Bound | Upper Bound |
|---|
| Group I | II | .00000 | .39628 | 1.000 | -2.3708 | -.0292 |
| III | .00000 | .39628 | 1.000 | -1.1708 | 1.1708 |
| IV | .00000 | .39628 | 1.000 | -1.1708 | 1.1708 |
| V | .10000 | .39628 | 1.000 | -1.0708 | 1.2708 |
| VI | .30000 | .39628 | 0.973 | -.8708 | 1.4708 |
| GroupII | I | .00000 | .39628 | 1.000 | .0292 | 2.3708 |
| III | 1.20000* | .39628 | 0.042 | .0292 | 2.3708 |
| IV | 1.20000* | .39628 | 0.042 | .0292 | 2.3708 |
| V | 1.30000* | .39628 | 0.021 | .1292 | 2.4708 |
| VI | 1.50000* | .39628 | 0.005 | .3292 | 2.6708 |
| GroupIII | I | .00000 | .39628 | 1.000 | -1.1708 | 1.1708 |
| II | .10000 | .39628 | 1.000 | -2.3708 | -.0292 |
| IV | .00000 | .39628 | 1.000 | -1.1708 | 1.1708 |
| V | .10000 | .39628 | 1.000 | -1.0708 | 1.2708 |
| VI | .30000 | .39628 | 0.973 | -.8708 | 1.4708 |
| GroupIV | I | .00000 | .39628 | 1.000 | -1.1708 | 1.1708 |
| II | .00000 | .39628 | 1.000 | -2.3708 | -.0292 |
| III | .00000 | .39628 | 1.000 | -1.1708 | 1.1708 |
| V | .10000 | .39628 | 1.000 | -1.0708 | 1.2708 |
| VI | .30000 | .39628 | 0.973 | -.8708 | 1.4708 |
| GroupV | I | -.10000 | .39628 | 1.000 | -1.2708 | 1.0708 |
| II | -1.30000* | .39628 | 0.021 | -2.4708 | -.1292 |
| III | -.10000 | .39628 | 1.000 | -1.2708 | 1.0708 |
| IV | -.10000 | .39628 | 1.000 | -1.2708 | 1.0708 |
| VI | .20000 | .39628 | 0.996 | -.9708 | 1.3708 |
| GroupVI | I | -.30000 | .39628 | 0.973 | -1.4708 | .8708 |
| II | -1.50000* | .39628 | 0.005 | -2.6708 | -.3292 |
| III | -.30000 | .39628 | 0.973 | -1.4708 | .8708 |
| IV | -.30000 | .39628 | 0.973 | -1.4708 | .8708 |
| V | -.20000 | .39628 | 0.996 | -1.3708 | .9708 |
*The mean difference is significant at the 0.05 level. Statistically significant values are in bold
Discussion
All the procedures in this study were performed by a single operator to reduce the variability in results. Microleakage evaluation is routinely done by dye leakage method, fluid filtration method or bacterial leakage method. The other methods include scanning electron microscope, radioisotopes, neutron activation analysis, markers and chemical agents [17]. The dye penetration method permits comparison of the apical leakage in two or more groups under identical experimental conditions [4]. Among the various organic dyes available; methylene blue was used because it had a particle size of 120A°, which was less than the average size of bacteria (2,000A°) [17]. So it is possible to determine the leakage where even bacteria cannot penetrate. Because of the high penetrating ability of methylene blue it is the most commonly used dye in Endodontics [4]. Hence it was used in the present study.
Cold lateral condensation is the most widely practised obturation technique because of its advantages like controlled placement of gutta-percha in the root canal and ease of use [18]. It also serves as a standard with which other obturation techniques could be compared. Hence it was used in the present study [19,20].
Obtura III is an injectable thermoplasticized obturation technique that is found to be superior to lateral condensation technique as it has better adaptation to the root canal system, reduces the procedure time, reduces the patient discomfort and has accurate temperature control for precise consistent viscosity [15]. The main drawback of this technique is its inability to control apical extrusion of the softened gutta-percha [5].
The results of the present study showed that there was no statistically significant difference in leakage between cold lateral compaction group and Obtura group (p > 0.05). Similar results were reported by Kandaswamy et al., Kavitha et al., and Emmanuel. Kandaswamy et al., evaluated the invitro apical micro leakage between Thermafil, Obtura II and Cold lateral condensation. They concluded that the microleakage was similar in lateral compaction and Obtura groups (p> 0.05) [5].
Kavitha et al., compared the sealing ability of lateral compaction, Obtura and Gutta Flow group. They concluded that Obtura II technique and lateral compaction techniques showed similar microleakage (p> 0.05) [1].
Emmanuel et al., compared the apical sealing ability of three different obturation techniques-Lateral Condensation, Obtura II and Thermafil by microleakage evaluation and concluded that lateral condensation showed maximum mean apical dye penetration in all the three groups with no significant difference (p > 0.05) when compared to Obtura [21].
In all the above studies Obtura groups showed dye leakage similar to lateral condensation groups with no significant difference. The beta phase gutta-percha which has high melting temperature (165-200°c) and greater shrinkage upon cooling might be the reason for microleakage in Obtura group. In all these studies microleakage evaluations were done between different obturation techniques by standardizing the apical preparations to a given ISO size of either 40, 50 or 60 and were not done at different apical sizes, whereas in the present study microleakage evaluation was done at different apical preparations using a single obturation technique.
According to Guttman et al., the recommended apical canal enlargement was ISO sizes 20-60 for Obtura [22]. This statement was given based on the clinical experience of authors rather than sound scientific research. Further studies were not done to substantiate their results. Hence in the present study microleakage evaluation was done at different sizes of apical preparation after obturation with Obtura.
Results of the present study showed that the microleakage was maximum in Group II (ISO size 20). This may be because the gutta-percha might not flow into such a narrow sized apical preparation.
Results also showed that microleakage though present was not statistically significant (p > 0.05) in Groups I, III, IV and V. This may be because of the beta phase gutta-percha which has high melting temperature and greater shrinkage upon cooling that led to microleakage in the groups III, IV and V whereas group I (lateral compaction group) showed microleakage due to the lack of close adaptability of gutta-percha cones to the canal walls.
Based on the Hagen-Poiseuille equation the flow rate of a semi-solid can be measured by:
Ø= ¶R4/8n (ΔP/ΔX)
Ø is the volumetric flow rate
‘n’ is the dynamic fluid viscosity
‘P’ is the pressure difference between two ends
‘X’ is the distance in the direction of flow
Pressure difference and dynamic fluid viscosity affect the flow rate, however they could not be measured.
From this equation it can be understood that flow rate is directly proportional to the radius of the root canal. So this would be one reason why more microleakage was seen in group II where apical preparation was done up to ISO size 20 when compared to other experimental groups.
Limitation
Limitations of this study were: that study was conducted only in single rooted teeth with single straight canals and only 23 gauge Obtura needles which had an inner diameter of 0.33mm were included in the study.
Conclusion
Within the limitations of this invitro study it can be concluded that comparison of microleakage between different groups from ISO sizes 20-60 recommends a minimum apical preparation of ISO size 30. Further studies in larger samples including teeth with different canal configurations are required to simulate a clinical scenario.
*The mean difference is significant at the 0.05 level. Statistically significant values are in bold
*The mean difference is significant at the 0.05 level. Statistically significant values are in bold