Diabetes Mellitus (DM) is a metabolic disorder characterized by hyperglycaemia, glycosuria, hyperlipidaemia and sometimes ketonaemia. The widespread pathological changes due to uncontrolled hyperglycaemia include thickening of capillary basement membrane, deposition and oxidation of membrane lipids (cholesterol) and cellular proliferation resulting in vascular complications like narrowing of capillaries and early atherosclerosis [1,2]. The most frequent cause of death in patients with diabetes is macro-vascular complications such as myocardial infarction, stroke, and peripheral artery disease. As shown by the laboratory evidence and clinical studies, atherosclerosis is not merely a simple lipid accumulation disease. Endothelial dysfunction and low grade systemic inflammation are complex situations which play a starter role in development and progress of atherosclerosis [3,4]. There are indications that the macrovascular changes in diabetes are initiated before the manifestation of overt diabetes [5,6] in the form of oxidative damage and sub-endothelial low grade systemic inflammation as shown in Hoorn study [7]. These changes slowly progress to peripheral vascular insufficiency, nephropathy, retinopathy and neuropathy. The sub-endothelial inflammation is associated with oxidative stress and the resultant chronic ischemia as an underlying aetiology.
Ischemia Modified Albumin (IMA) is a novel marker of tissue ischemia and oxidative stress [8]. The pathophysiological events of ischemia, including hypoxia and free oxygen radicals, result in a conformational change of the N-terminus of albumin, and this molecule is called as IMA [9]. The serum levels of IMA have been reported to rise in many clinical conditions with oxidative stress as the common denominator, e.g. myocardial ischemia [10,11], ovarian torsion, hypothyroidism, thalassaemia and malignancy [12]. The role of IMA as a general marker for tissue ischemia is being explored in many studies, and diabetes mellitus is one of the current areas of research [2].
Ukinc et al., and Turk et al., have advocated the role of IMA in early detection of diabetic nephropathy in diabetic patients [13,14]. Kaefer et al., showed a significant correlation of raised IMA levels with fasting blood glucose, glycated albumin and C-Reactive protein in T2DM patients [15]. The baseline IMA levels were significantly higher and positively associated with HbA1c levels in patients with T2DM, presenting with peripheral arterial disease. Dayanand et al., studied the use of IMA as a marker of ischemic changes in T2DM patients in a case control study and concluded that elevated IMA levels might indicate the underlying subclinical vascular disease in these patients [16]. The IMA could thus serve as an indicator of glycaemic control and an economic marker for peripheral arterial disease.
The present research project was, therefore, designed to study the association of IMA with glycaemic control and the development of the complications of T2DM.
Materials and Methods
Study Design and Subjects
A cross-sectional study was undertaken with a planned sample size of 100 T2DM subjects after obtaining clearance from the Institutional research/ethical committee. The study design and execution was fully compliant with Helsinki declaration, 1975 revised in 2000 [17]. Total of 100 pre-diagnosed diabetic patients attending the medical/endocrinology OPD at Christian Medical College and Hospital, Ludhiana, India, during May 2013 to September 2013, were recruited for the present study, after obtaining their informed written consent.
Exclusion criteria: To rule out any secondary oxidative stress, subjects with history of liver dysfunction, ischemic events like AMI or stroke within last three months, any infection in last 6 weeks, malignancy and corticosteroid therapy were excluded from the study. Subjects with abnormal serum albumin concentration were excluded at the time of data analysis.
Methods
History/ Clinical Observations: Patient’s medical records were accessed to collect data on clinical history and on-examination findings recorded into a specifically designed questionnaire.
Sample Collection: The blood samples are routinely drawn in the OPD lab by venipuncture using vaccutainer tubes, after an overnight fast. The samples were transferred to Biochemistry Department for assessment of HbA1c and lipid profile. Sera were separated by centrifugation after incubating at 37°C for 20 minutes. For collection of blood for HbA1c estimation, K-EDTA lined vaccutainer tubes were used.
Ischemia Modified Albumin (IMA) estimation: IMA was estimated by the colorimetry using the method developed by Bar-Or et al., and reported by Chawla et al., [10]. The estimation is based on the reduced binding of cobalt (II) with the Human Serum Albumin (HSA) modified by the ischemic stress. In the assay, 200 μl of serum was incubated with 50 μl of cobalt chloride solution (1g/l). Following 10 minutes incubation, 50 μl dithiothreitol solution (1.5 g/l) was added and the mixture vortexed for 10 seconds. The final volume was then made up by addition of 1.0 ml of normal saline. The absorbance of the assay mixture was read at 470 nm using a UV-visible Spectrophotometer. The blank was prepared similarly with the exclusion of DTT. IMA was reported in absorbance units; 1 ABSU = 100 * ΔOD (Optical Density of Test minus Blank).
HbA1c Estimation: The HbA1c was measured by using commercial kit supplied by Roche Diagnostics, USA. The estimation is based on TINIA (Turbidimetric Inhibition Immunoassay) where HbA1c reacts with anti-HbA1c antibodies and forms a soluble Ag-Ab complex. The unreacted Anti-HbA1c forms an insoluble Ab-Ag complex with the polyhapten and is determined turbidimetrically on fully automated biochemistry analyser - Hitachi Modular (P-800) system.
Lipid Profile: The triglycerides, total cholesterol, HDL-Cholesterol and LDL-Cholesterol were estimated spectrophotometrically by using commercial kits from Roche Diagnostics, USA on the fully automated Hitachi Modular (P-800) system.
Creatinine: The creatinine was estimated enzymatically by using commercial kits from Randox Labs.
Urine Microalbumin: The urine microalbumin was estimated immuno-turbidimetrically by using commercial kits from Roche Diagnostics, USA on the fully automated Hitachi modular (P-800) system.
Statistical Analysis
The data generated were analysed with the help of epidemiological statistical software package namely EPI–INFO 7.1.5 (a public domain software developed by Centers for Disease Control and Prevention, CDC, USA). The subjects were grouped according to the glycaemic control (HbA1c<7.0 %) as per the recommendations of Americal Diabetes Association (ADA, 2015). Since, the characteristics of the patients were not normally distributed, non-parametric statistics were used for determination of statistical significance, p-value<0.05 was used as the level of significance.
Results
A total of 100 diabetic individuals were recruited for the present research project. Eighteen subjects had to be excluded from the data analysis as per the exclusion criteria, resulting in effective study group of 82 individuals.
Demographic and Clinical Spectrum of the Patients
Most of the subjects were in the age group of 30 to 75 years, with only two below the age of 30 years and three more than 75 years of age. The gender distribution of the subjects was almost equal, i.e. 52.4% (43) males. Majority (47.5%) of subjects were newly diagnosed (duration of DM <1 year); 27.6% were diabetic for 1 to 5 years and 25% for more than 5 years.
Glycaemic Control
Very few subjects (9.8%) in the study showed a good glycaemic control [Table/Fig-1], i.e. glycosylated Haemoglobin (HbA1c) level below 6.4%. About one quarter (25.6%) had moderately elevated HbA1c, whereas majority showed poor (26.8%) and very Poor glycaemic control (37.8%).
Demographic profile of the study subjects.
| Parameter | Mean ± SEM |
|---|
| Age | 52.9 ± 1.4 years |
| Duration of DM | 40.6 ± 5.9 months |
| HbA1c | 8.80 ± 0.27 % |
| Glycaemic Control | Proportion (%) |
| HbA1c <=6.4HbA1c 6.5 – 7.5HbA1c 7.5 – 9.0HbA1c >9.0 | 9.825.626.837.8 |
| Lipid Profile |
| Serum Cholesterol | 181.3 ± 5.4 mg/dl |
| HDL-cholesterol | 45.6 ± 1.1 mg/dl |
| LDL-cholesterol | 106.0 ± 3.9 md/dl |
| Triglycerides | 154.6 ± 11.8 mg/dl |
| Complication(s) of diabetes | Proportion (%) |
| Retinopathy + NeuropathyNeuropathy | 4.929.3 |
Macrovascular complications
The study subjects showed mixture of clinical presentations/complications [Table/Fig-1]. Hypertension was the most common associated clinical finding and was noticed in 29 (35.4%) of the cases. The complications of the diabetes mellitus like retinopathy (4.9%) and neuropathy (29.3%) and peripheral oedema (13.4%) were observed in a number of subjects. Four patients who had retinopathy, also showed symptoms of neuropathy. Neuropathy included, paraesthesia (15.9%), sensory deficit (19.5%). Diabetic nephropathy could not be analysed since all cases with renal impairment were excluded as per the exclusion criteria.
Ischemia Modified Albumin
Ischemia Modified Albumin (IMA) varied from the lowest of 28.0 to a maximum of 95.3 ABSU in the study population with a mean ± SEM of 62.04 ± 1.5 ABSU. Ischemia modified albumin levels did not appear to be affected by the age of the patients, were non-significantly higher in females than in male subjects (p=0.1244).
The serum IMA concentration did not appear to be affected by the duration of diabetes. Therefore, it appears that formation of IMA could be an acute phenomenon rather than a chronic one.
Ischemia Modified Albumin and Glycaemic control
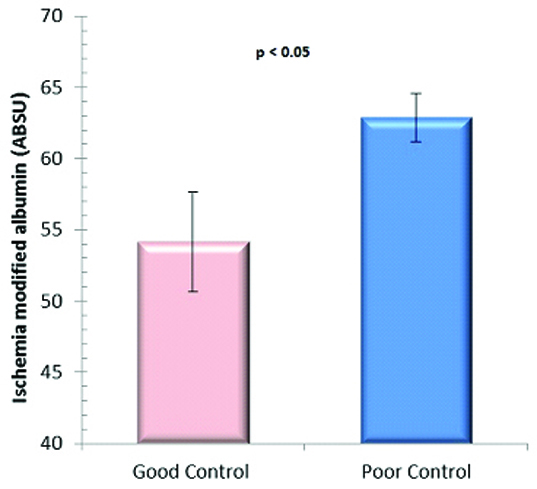
When the study subjects were grouped according to American Diabetes Association [3] into Good glycaemic control (HbA1c ≤ 7.0) and poor glycaemic control (HbA1c>7.0), IMA appeared to correlate with the hyperglycaemia [Table/Fig-2]. The IMA values (Mean ± SEM) were 54.2 ± 3.5 and 62.9 ± 1.7 ABSU (p-Value < 0.05), respectively in the two groups.
IMA values in good and poor glycaemic control groups.
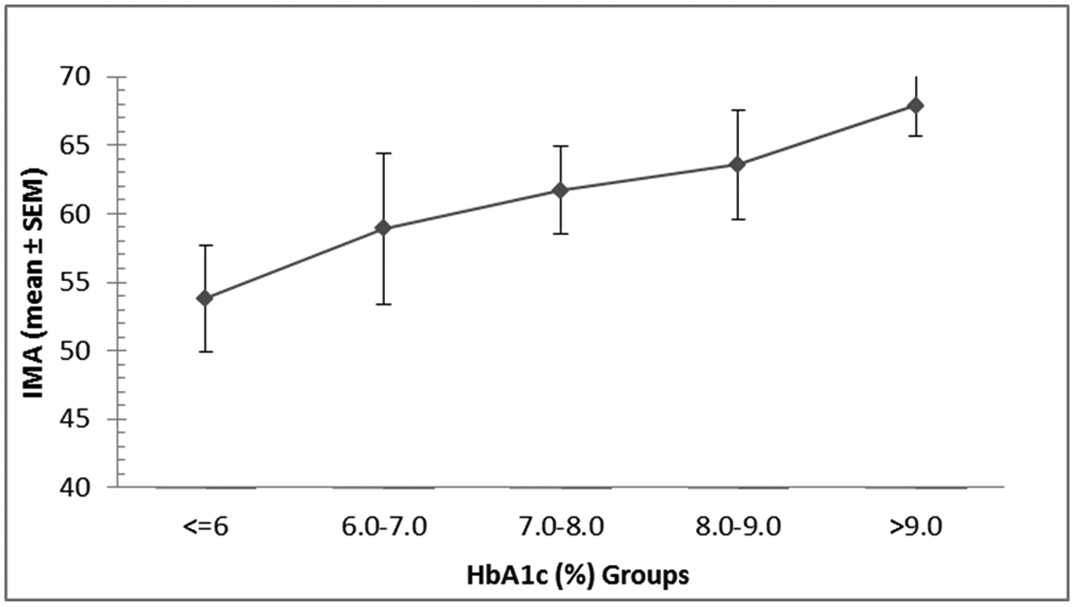
When the patients were further divided into an increment of one HbA1c unit, a clear increasing trend in the IMA (mean ± SEM) values was observed [Table/Fig-3] with increasing glycosylated haemoglobin levels. Linear regression analysis between IMA and the HbA1c revealed a moderate positive correlation coefficient, r2 = 0.14.
Variation in ischemia modified albumin with HbA1c.
Ischemia Modified Albumin and Lipid Profile
The relationship of IMA levels with lipid profile of diabetic patients is shown in [Table/Fig-4]. Although IMA levels appeared to increase with increasing total cholesterol levels, the rise was, however, non-significant (p=0.8486). IMA levels were higher in subjects with lower HDL cholesterol than those with higher HDL-Cholesterol; and the patients with high LDL cholesterol (>170 mg/dl) showed lower IMA values compared to those with low LDL-cholesterol. The triglyceride levels did appear to affect the IMA levels.
Relationship of IMA (Mean ± SEM) levels with lipid profile.
| Parameter | Serum concentration (mg/dl) | Number of patients | IMA (ABSU) Mean ± SEM |
|---|
| Cholesterol |
| A <200 | 59 | 61.5 ± 1.7 |
| B 200-240 | 11 | 62.9 ± 5.0 |
| C >240 | 12 | 63.9 ± 5.2 |
| HDL Cholesterol |
| A <55 | 68 | 62.2± 1.6 |
| B >55 | 14 | 56.5± 4.1 |
| LDL-Cholesterol |
| A <170 | 78 | 63.5± 1.6 |
| B >170 | 4 | 52.7± 8.4 |
| Triglycerides |
| A <150 | 56 | 62.4 ± 1.7 |
| B 150-200 | 10 | 54.4 ± 5.0 |
| C >200 | 16 | 65.7 ± 4.3 |
LDL: Low density lipoproteins; HDL: High density lipoproteins; ABSU: absorbance units
Similarly, serum IMA levels were found to be higher (64.3 ± 2.8) in hypertensive diabetic patients than normotensive diabetic subjects (60.8 ± 1.8), the difference was, however, statistically not significant (p=0.2348).
Ischemia Modified Albumin and Complications of Diabetes
The complications of uncontrolled long standing diabetes mellitus include retinopathy, nephropathy and neuropathy. In our study only four cases of retinopathy were observed, whereas 70 subjects had mild to severe neuropathy (paresthesia, anaesthesia and/or sensory deficit). The IMA levels in patients who had developed these diabetic complications are listed in [Table/Fig-5]. In subjects without any known complication, the Mean ± SEM serum IMA concentrations were 59.7 ± 1.9 ABSU, which was marginally lower than that in patients with complications of diabetes. The difference was not statistically significant.
IMA (Mean ± SEM) in subjects with complications of diabetes.
| Complication | Number of patients | IMA (ABSU) Mean ± SEM |
|---|
| No complications | 12 | 59.7 ± 1.9 |
| Retinopathy + Neuropahy | 4* | 61.4 ± 3.9 |
| Neuropathy | 66 | 63.0 ± 3.5 |
*Four patients with retinopathy also had symptoms of neuropathy
Discussion
The micro and macro-vascular risk in type 2 diabetes has been related with extent and duration of hyperglycaemic state. The control of hyperglycemia in DM patients has been shown to be reflected in improvement in the lipid profile as well as other components of pathogenesis of atherosclerosis and hence reduction in the associated cardiovascular risk. Various studies done on glycaemic control and risk projections in diabetic patients have shown that improvement of glycaemic control improves most of the components of risk associated with diabetes [11]. The aetiopathology of diabetic complications involves the development of Reactive oxygen species (ROS). Plasma levels of ischemia modified albumin (IMA) in T2DM are connected with parameters of oxidative processes such as advanced oxidation protein products (AOPP) and thiol groups [7]. The present study was, therefore, planned to have a fresh look at relationship of IMA with glycaemic control in type 2 diabetes patients and its association with the complications of diabetes.
IMA and Glycaemic control: Glycaemic control in the study subjects did not give a rosy picture because almost two third (64.6%) of the patients showed a poor glycaemic control (with glycosylated haemoglobin >7.5%). This was seen in spite of attending regular diabetic clinics in the tertiary care hospital. Long-term testing and maintenance of HbA1c and blood pressure in the normal range are of great importance for the prevention and delay of vascular complications of T2DM [18].
Plasma IMA levels in T2DM patients in the present study correlated very well with the HbA1c levels. The patients who were not controlling their blood glucose levels well (HbA1c≥6.4) had higher IMA levels than those with HbA1c<6.4%. Further, IMA showed a good correlation with HbA1c levels. Refaat et al., in a study on Egyptian patients reported a significant positive correlation of serum IMA to glycosylated haemoglobin in patients with type 2 diabetes [19].
We found a positive correlation between the HbA1c and IMA – mean IMA levels increased consistently with the increasing HbA1c [Table/Fig-2]. Similar observations have been reported by Piwowar et al., [20].
IMA and Lipid profile: Since dyslipidaemia has also been reported to be a major contributor to vascular complications in diabetes, we examined the relationship between IMA and the lipid profile of the patients. Piwowar et al., had shown a weak correlation between LDL-cholesterol and IMA but in our study high LDL-C showed lower IMA levels [20]. None of the differences in the IMA in lipid groups was statistically significant. Similarly, Refaat et al., also reported a significant positive correlation between IMA levels and Total cholesterol, LDL-cholesterol as well as HDL-cholesterol in dyslipidaemic and non-dyslipidaemia diabetic subjects [19]. In our study, the IMA levels appeared to relate with total cholesterol, with increased concentration in subjects with higher total cholesterol. HDL-cholesterol plays a protective role against development of oxidation induced atherosclerosis. In our study, we found that subjects with lower HDL-cholesterol had higher IMA concentration signifying some oxidative damage occurring in these subjects. Contrary to our expectations, IMA was negatively associated with LDL-cholesterol levels.
IMA and complications of diabetes: We analysed the IMA levels in patients with classical macro-vascular complications of diabetes, viz. retinopathy, nephropathy and neuropathy. Shao Gang et al., studied the peripheral artery disease in relation with HbA1c and IMA in T2DM [18]. They observed that HbA1c is closely associated with the complications and peripheral artery disease. They further observed that elevations in IMA were related with the severity of PAD and thus IMA levels could act as a biomarker of PAD. In our study, the differences in the IMA levels in patients with or without any of the diabetic complications were not found to be significant, although most of the patients with complications showed higher IMA values. In view of the above, it appears that IMA could be related to glycaemic control in type 2 diabetes patients but a larger study would be required to validate its utility as a marker for complications of diabetes.
Limitation
Sample size was the major limitation of the study. This was a pilot study planned for 100 subjects. The increased IMA levels although appeared to vary in the different categories, e.g. lipids and complications of diabetes, missed the statistical significance.
Conclusion
The study demonstrates the variation of IMA with poor glycaemic control and the resultant dyslipidaemia. Higher IMA levels were seen in Type 2 DM patients who had higher HbA1c as well as in those with lower HDL-cholesterol. The validation of IMA as a marker of micro and macro-vascular changes in type 2 diabetes mellitus would require a larger study.