Discolouration of tooth is one of the chief complaints expressed by many patients. Teeth whitening by dentist and other dental professionals is expensive than those methods which are used by patients [1]. Maintaining good oral hygiene is needed to reduce plaque accumulation and caries [2]. Patients and consumers will have a desire to have white teeth and many are not satisfied with their tooth colour and want to have white teeth [3]. Tooth pastes are effective in removing and reducing stains thus more number of whitening tooth pastes claiming better effect are introduced in the market [1]. Dentifrice delivers the therapeutic agents and improves the oral hygiene by the effect of scrubbing [2]. Dentifrice may have different effects. Scratches may disappear expand or new micro wear can appear [4]. Toothpaste abrasives and toothbrush bristles may deteriorate tooth and restorative material surfaces by producing superficial grooves [5].
Aesthetic restorative materials are widely used in dentistry as an anterior restorative and also for minimal invasive techniques. Colour, surface roughness and micro hardness are the three important factors for any restorative material for its longevity. Surface hardness is an important aspect for the restorative material. With low surface hardness it is susceptible for scratches and provoke failure of restorations [6]. Surface structure which is rough can lead to staining of material and discolouration, which may compromise the quality restoration. Thus it is very important to know the effect of a dentifrice abrasion on loss of restorative materials [7].
Novel dentifrices claiming whiteness of the tooth can have some deleterious effect on restorative material since they are known to have high abrasives. Thus this study was undertaken to know the effect of whitening dentifrice on aesthetic restorative materials.
Materials and Methods
Materials
Two dentifrices and two tooth coloured materials were evaluated in this study.
Two tooth pastes used were-
1. Conventional tooth paste {Pepsodent complete}.
2. Whitening tooth paste {Pepsodent whitening}
Two restorative materials used were-
1. Compomer (Dyract®).
2. Composite (Fulfil Extra).
Methods
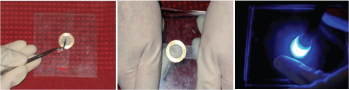
A custom made brass mold of 1.2 cm in diameter and 2mm height was used to prepare 40 standardized specimens for each of the above mentioned restorative materials. Samples were made by placing the respective materials into the mold and sandwiched between two mylar strips and two glass plates, the smoothest surfaces were obtained by curing the materials against the mylar strip the material was then light cured for 40 second on each side with Light cure unit (Bee Cool plus top light LED Curing) [Table/Fig-1].
Preparation of the sample.
Forty specimens of each group were randomly divided in to four groups each group was further divided into two sub group of ten samples each. Sampling was as follows [Table/Fig-2].
Flowchart showing the distribution of specimen.
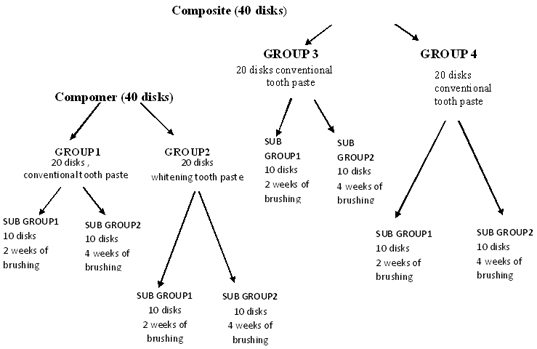
Group1: Twenty disks of composite were subjected to brushing, in which conventional toothpaste was used. (Control)
Group2: Twenty disks of composite were subjected to brushing, in which conventional toothpaste was used. (Control)
Group3: Twenty disks of compomer were subjected to brushing in which whitening tooth paste was used.
Group4: Twenty disks of composite were subjected to brushing in which whitening tooth paste was used.
Each of the above group was further divided into two subgroups.
Subgroup A: Ten disks were subjected to brushing for two weeks.
Subgroup B: Ten disks were subjected to brushing for four weeks.
Specimens were tested at three intervals. The specimens were tested for micro hardness, colour stability, and surface roughness at baseline, after two weeks of brushing and, after four weeks of brushing with the above mentioned tooth pastes.
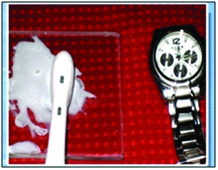
After sampling procedures initial reading was taken for each specimens as base line data. Brushing was performed with a powered toothbrush (Oral B® cross action) [Table/Fig-3]. Each time toothbrush head was loaded with tooth paste of 0.25 mg weight and traveled horizontally for 30 sec. The tooth paste slurry was prepared by mixing one of the dentifrices with water at a ratio of 1:3 by weight. Three erosive/abrasive cycles were carried out per day.
For subgroup A final readings of micro hardness, colour stability, surface roughness, were checked after two weeks of continuous brushing.
For subgroup B the readings were taken after four weeks of continuous brushing. The subtraction of final reading with initial was considered for statistical analysis.
Micro hardness measurement
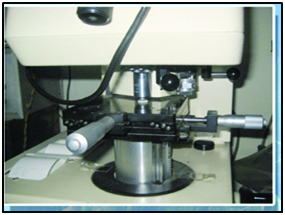
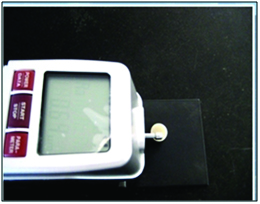
The Vickers Hardness Number (VHN) for each pellet was evaluated using surface micro hardness tester (Shimatzu HMV-2000, Germany) the Vickers hardness measurement was taken for each test specimen in three different places applying a load of 25 grams for 20 seconds. An average of three was considered [Table/Fig-4].
Colour stability measurement
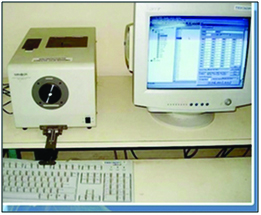
Minolta spectrophotometer (CM -330Ld) with a 10mm aperture and D65 illuminant was used to measure the colour. Calibration of the unit was done with calibration plate provided by the manufactures before measurement. Each specimen was placed against the aperture and ΔE (Total colour change) was recorded as displayed on the computer [Table/Fig-5].
Surface roughness measurement
Specimens were evaluated using a surface testing machine (Surf meter model no. SJ 201 T, Mitutyo-Japan) with a radius 1.5μm, moved at a constant speed of 0.1 mm/s, with a force of 0.7 mm. The cut off was set at 0.25mm. Three tracings were performed on each specimen at different locations; the average of these three measurements was used as the measurement (Ra1) for each sample. The Ra (I) was obtained measuring the Ra produced by the Mylar strips [Table/Fig-6].
Surface roughness evaluation.
Statistical Analysis
Results are presented as mean S.D. values. One-way ANOVA was used for multiple group comparison followed by Post-Hoc Tukey’s test. The paried t-test was used for intra group comparison and unpaired t-test for comparing independent sample groups
Results
Observation from [Table/Fig-7,8 and 9]: The compomer and composite showed no significant difference in micro hardness either with conventional or whitening tooth paste both at two and four weeks.
Compiled microhardness value for compomer restorative material.
| Groups | Group No | Initial reading | Final reading | Mean difference ± SD t-value* p– value | Comparison of microhardness between groups |
|---|
| Groups compared | t-value** | p-value |
|---|
| Group 1 subgroup 1 (compomer with conventional tooth paste for 2 weeks) | A1 | 42.74 ± 0.80 | 43.92 ± 0.97 | 0.18 ± 0.471.190.26 | A1 – A2 | 1.62 | 0.13 (NS) |
| Group 1 subgroup 2 (compomer with conventional tooth paste for 4 weeks) | A2 | 42.46 ± 2.53 | 41.64 ± 2.35 | 0.82 ± 1.132.29<0.05 | A3 – A4 | 1.90 | 0.08 (NS) |
| Group 3 subgroup 1 (compomer with whitening tooth paste for 2 weeks) | A3 | 43.93 ± 1.81 | 43.58 ± 1.36 | 0.35 ± 0.981.170.27 | A1 – A3 | 0.53 | 0.061 (NS) |
| Group 3 subgroup 2 (compomer with whitening tooth paste for 4 weeks) | A4 | 43.32 ± 1.63 | 42.16 ± 1.18 | 1.17 ± 0.914.12< 0.001 | A2 – A4 | 0.79 | 0.44 (NS) |
*Intra group comparison: paired t-test **Intra group comparison: unpaired t-test
Compiled microhardness value for composite restorative material.
| Groups | Group No | Initial reading | Final reading | Mean difference ± SD t-value* p– value | Comparison of microhardness between groups |
|---|
| Groups compared | t-value** | p-value |
|---|
| Group 2 subgroup 1 (composite with conventional toothpaste for 2 weeks) | B1 | 31.18 ± 0.33 | 30.79 ± 0.92 | 0.39 ± 0.931.350.21 (NS) | B1 – B2 | 0.38 | 0.71 (NS) |
| Group 2 subgroup 2 (composite with conventional tooth paste for 4 weeks) | B2 | 31.35 ± 0.32 | 31.56 ± 1.18 | 0.21 ± 1.06 0.720.49 | B3 – B4 | 1.57 | 0.51 (NS) |
| Group 4 subgroup 1 (composite with whitening tooth paste for 2 weeks) | B3 | 31.25 ± 0.55 | 30.55 ± 1.31 | 0.71 ± 1.37 1.700.12 | B1 – B3 | 0.67 | 0.51 (NS) |
| Group 4 subgroup 2 (composite with whitening toothpaste for 4 weeks) | B4 | 31.25 ± 0.35 | 31.26 ± 0.62 | 0.01 ± 0.52 0.120.91 | B2 – B4 | 0.56 | 0.58 (NS) |
*Intra group comparison – paired t-test **Intra group comparison – unpaired t-test
Comparison of microhardness of compomer and composite restorative material.
| Groups | 2 weeksMean change ± SD | 4 weeksMean change ± SD | Difference between groups** |
|---|
| Groups | 2 weeks | 4 weeks |
|---|
| Group 1 (compomer with conventional) | 0.18 ± 0.47 | 0.81 ± 1.13 | Group 2 – Group 4 | NS | 0.96, NS |
| Group 2 (composite with conventional) | 0.39 ± 0.93 | 0.21 ± 1.06 | Group 1 – Group 2 | NS | 0.48, NS |
| Group 3 (compomer with whitening) | 0.35 ± 0.98 | 1.17 ± 0.91 | Group 2 – Group 3 | NS | 0.12 NS |
| Group 4 (composite with whitening) | 0.75 ± 1.37 | 0.01 ± 0.52 | Group 1 – Group 4 | NS | 0.24 NS |
| ANOVA F* | 0.58 | 3.28 | Group 3 – Group 4 | NS | < 0.05 S |
| P | 0.63 NS | < 0.05 S | Group 1 – Group 3 | NS | 0.83 NS |
*One-way ANOVA **Post-hoc Tukey’s test
Observation from [Table/Fig-10,11 and 12]: Although there was a highly significant colour change observed after using whitening toothpaste for both compomer and composite, the change observed at two weeks and four weeks’ time interval was not significant.
Compiled colour change value for compomer restorative material.
| Groups | Group No | Initial reading | Final reading | Mean difference ± SD t-value*p– value | Comparison of colour change between groups |
|---|
| Groups compared | t-value** | p-value |
|---|
| Group 1 subgroup 1 (compomer with conventional toothpaste 2 weeks) | A1 | 4.67 ± 0.25 | 5.25 ± 0.52 | 0.71 ± 0.474.51< 0.001 | A1 – A2 | 1.38 | 0.19 (NS) |
| Group 1 subgroup 2 (compomer with conventional toothpaste 4 weeks) | A2 | 4.56 ± 0.31 | 5.59 ± 0.42 | 1.03 ± 0.625.27< 0.001 | A3 – A4 | 0.59 | 0.57 (NS) |
| Group 3 subgroup 1 (compomer with whitening toothpaste 2 weeks) | A3 | 4.49 ± 0.19 | 6.62 ± 0.28 | 2.12 ± 0.3221.1< 0.001 | A1 – A3 | 7.97 | < 0.001 (HS) |
| Group 3 subgroup 2 (compomer with whitening toothpaste 4 weeks) | A4 | 4.54 ± 0.27 | 6.72 ± 0.23 | 2.19 ± 0.06 93.8< 0.001 | A2 – A4 | 5.75 | < 0.001 (HS) |
*Intra group comparisons: paired t-test ** Intra group comparisons: unpaired t-test
Compiled colour change value for composite restorative material.
| Groups | Group No | Initial reading | Final reading | Mean difference ± SD t-value*p– value | Comparison of colour change between groups |
|---|
| Groups compared | t-value** | p-value |
|---|
| Group 2 subgroup 1 (composite with conventional tooth paste for 2 weeks) | B1 | 1.95 ± 0.13 | 2.98 ± 0.21 | 1.02 ± 0.1130.7< 0.001 | B1 – B2 | 0.29 | 0.78 (NS) |
| Group 2 subgroup 2 (composite with conventional toothpaste for 4 weeks) | B2 | 2.00 ± 0.08 | 2.97 ± 0.33 | 0.97 ± 0.31 10.6< 0.001 | B3 – B4 | 0.68 | 0.51 (NS) |
| Group 4 subgroup 1 (composite with whitening toothpaste for 2 weeks) | B3 | 1.99 ± 0.10 | 3.92 ± 0.33 | 1.93 ± 0.2919.9< 0.001 | B1 – B3 | 8.78 | < 0.001 (HS) |
| Group 4 subgroup 2 (composite with whitening tooth for 4 weeks) | B4 | 2.12 ± 0.30 | 4.11 ± 0.19 | 1.98 ± 0.2227.4< 0.001 | B2 – B4 | 8.33 | < 0.001 (HS) |
*Intra group comparisons: paired t-test **Intra group comparisons: unpaired t-test
Comparison of colour stability of compomer and composite restorative material.
| Groups | 2 weeksMean change ± SD | 4 weeksMean change ± SD | Difference between groups** |
|---|
| Groups | 2 weeks | 4 weeks |
|---|
| Group 1 (compomer with conventional) | 0.71 ± 0.47 | 1.03 ± 0.62 | Group 2 – Group 4 | < 0.01 S | < 0.01 S |
| Group2 (composite with conventional) | 1.02 ± 0.11 | 0.97 ± 0.31 | Group 1 – Group 2 | 0.15 (NS) | 0.99 NS |
| Group 3(compomer with whitening) | 2.12 ± 0.32 | 2.19 ± 0.06 | Group 2 – Group 3 | < 0.01 (S) | < 0.01 (S) |
| Group 4 (composite with whitening) | 1.93 ± 0.29 | 1.98 ± 0.22 | Group 1 – Group 4 | < 0.01 (S) | < 0.01 (S) |
| ANOVA F* | 4.52 | 30.2 | Group 3 – Group 4 | 0.53 (NS) | 0.60 (NS) |
| p | < 0.01 S | < 0.01 S | Group 1 – Group 3 | < 0.001 (HS) | < 0.01 S |
*One-way ANOVA
**Post-hoc Tukey’s test
Observation from [Table/Fig-13,14 and 15]: Regarding surface roughness, there was a significant change in roughness in both conventional and whitening toothpaste with compomer and composite. However, whitening toothpaste had a significant change in surface roughness compared with conventional toothpaste. Roughness further increased at four weeks interval when compared to 2 weeks. In summary, the whitening tooth paste,
Compiled surface roughness value for compomer restorative material.
| Groups | Group No | Initial reading | Final reading | Mean difference ± SD t-value*p– value | Comparison of surface roughness change between groups |
|---|
| Groups compared | t-value** | p-value |
|---|
| Group 1 subgroup 1 (compomer with conventional toothpaste for 2 weeks) | A1 | 0.28 ± 0.04 | 0.37 ± 0.05 | 0.09 ± 0.044.00< 0.001 | A1 – A2 | 3.18 | < 0.01 (S) |
| Group 1 subgroup 2 (compomer with conventional tooth paste for 4 weeks) | A2 | 0.28 ± 0.05 | 0.43 ± 0.07 | 0.16 ± 0.056.33< 0.001 | A3 – A4 | 8.57 | < 0.001 (HS) |
| Group 3 subgroup 1 (compomer with whitening tooth paste for 2 weeks) | A3 | 0.28 ± 0.04 | 0.38 ± 0.05 | 0.10 ± 0.043.86< 0.01 | A1 – A3 | 0.90 | 0.38 (NS) |
| Group 3 subgroup 2 (compomer with whitening toothpaste for 4 weeks) | A4 | 0.27 ± 0.04 | 0.48 ± 0.03 | 0.21 ± 0.0115.7< 0.001 | A2 – A4 | 3.30 | < 0.01 (S) |
*Intra group comparisons: paired t-test **Intra group comparisons: unpaired t-test
Compiled surface roughness value for composite restorative material.
| Groups | Group No | Initial reading | Final reading | Mean difference ± SD t-value*p– value | Comparison of colour change between groups |
|---|
| Groups compared | t-value** | p-value |
|---|
| Group 2 subgroup 1 (composite with conventional tooth paste for 2 weeks) | B1 | 0.30 ± 0.06 | 0.31 ± 0.06 | 0.01 ± 0.031.000.34 (NS) | B1 – B2 | 6.01 | < 0.001 (HS) |
| Group 2 subgroup 2 (composite with conventional toothpaste for 4 weeks) | B2 | 0.27 ± 0.03 | 0.39 ± 0.02 | 0.12 ± 0.049.00< 0.001 | B3 – B4 | 6.09 | < 0.001 (HS) |
| Group 4 subgroup 1 (composite with whitening toothpaste for 2 weeks) | B3 | 0.28 ± 0.03 | 0.32 ± 0.04 | 0.05 ± 0.034.69< 0.01 | B1 – B3 | 3.28 | < 0.01 (S) |
| Group 4 subgroup 2 (composite with whitening toothpaste for 4 weeks) | B4 | 0.27 ± 0.04 | 0.46 ± 0.05 | 0.20 ± 0.0421.00< 0.001 | B2 – B4 | 3.29 | < 0.01 (S) |
*Intra group comparison: paired t-test **Intra group comparison: unpaired t-test
Comparison of surface roughness of compomer and composite restorative material.
| Groups | 2 weeksMean change ± SD | 4 weeksMean change ± SD | Difference between groups** |
|---|
| Groups | 2 weeks | 4 weeks |
|---|
| Group 1 (compomer with conventional) | 0.09 ± 0.47 | 0.16 ± 0.05 | Group 2 – Group 4 | 0.09 (NS) | < 0.01 (S) |
| Group 2 (composite with conventional) | 0.01 ± 0.03 | 0.12 ± 0.04 | Group 1 – Group 2 | < 0.01 (S) | 0.12 (NS) |
| Group 3 (compomer with whitening) | 0.10 ± 0.04 | 0.21 ± 0.01 | Group 2 – Group 3 | < 0.01 (S) | < 0.01 (S) |
| Group4 (composite with whitening) | 0.05 ± 0.03 | 0.20 ± 0.04 | Group 1 – Group 4 | < 0.01 (S) | 0.95 (NS) |
| ANOVA F* | 15.3 | 12.1 | Group 3 – Group 4 | < 0.01 (S) | 0.95 (NS) |
| p | < 0.01 S | < 0.01 (S) | Group 1 – Group 3 | 0.75 (NS) | < 0.05 (S) |
*One-way ANOVA **Post-hoc Tukey’s test
1) Caused change in colour of restorative materials. However the change in colour was stable throughout the experimental period.
2) Did not alter the micro hardness value of both the restorative materials.
3) Significantly roughened the restorative materials and continued its enhanced effect till the end of the experimental period.
Discussion
Colour and transparency are the important components of restorative materials used for appearance. Clinically it is important that the uncured restorative materials matched should retain the translucency as well as colour after curing and also after it reaches its equilibrium in environment [8]. Composite materials have been used for many years and manufacturers are trying to improve the handling property, strength and polish ability to make an universal material for restoration [7].
One of the major disadvantages of resin based material is its wear resistance. This varies in different patients and different areas in same patient. Anterior teeth are usually affected more due toothbrush/dentifrice wear compared to all other areas of the mouth [9]. Aesthetic quality of restoration depends on surface texture, if it is rough leads to decreased gloss and discolouration. Rougher surface also give rise to staining, accumulation of plaque which may lead to secondary caries [7].
Importance has been given to dental aesthetics these years thus tooth whitening is an important aspect of dentifrices. Many dentifrices with different formulations have been introduced in market mainly targeting to improve efficiency of cleaning and whitening of teeth. Tooth whitening can be done with bleaching agents like hydrogen peroxide carbamide, peroxides and also wich the abrasives present in dentifrices [10].
In this study 40 specimens of each compomer and composite material were made. The specimens were fabricated in a standardized brass mold of diameter 1.2 cm and height 2 mm to ensure standardized shape and size, respective materials were sandwiched between mylar strips and two glass plates [10]. The specimens of each material were divided into four experimental groups and each group was further divided into two subgroups. We have used conventional Pepsodent dentifrice and whitening Pepsodent dentifrice which had an additional ingredient called perlite which was proposed as whitening agent. For the brushing purpose to standardize the brushing technique a powered toothbrush (Oral B cross action) was used. Each time it was moved for 30sec, since the efficacy of the powered toothbrush was reached at 30 sec of brushing per quadrant [11]. Amount of tooth paste used was 0.25 grams which is a pea nut size [12].
Study evaluated three parameters micro hardness, colour stability and surface roughness. The readings of all three parameters were taken at three intervals, one at baseline, at two weeks and after four weeks. Reading after two weeks were taken since the recommendation of whitening paste for usage of dentifrice by the manufacturer was two weeks to achieve the whiteness of teeth and we further investigated whether the efficacy was enhanced after four weeks. Thus, readings were taken at time intervals of two and four weeks with different toothpastes.
Micro hardness
The VHN for each pellet was evaluated using surface micro-hardness tester (Shimatzu HMV-2000, Germany). Vickers hardness measurements fulfill the requirements of the standard test method of materials as defined by American Society for Testing and Materials [13].
The results showed that the compomer restorative materials when subjected to brushing with whitening toothpaste after two and four weeks there was a slight reduction in hardness but was not statistically significant. When whitening dentifrice was used for four weeks it resulted in decrease in micro hardness of compomer compared with composite. This shows that the effect of whitening dentifrice on micro hardness is time and material dependent. The effect of lightening gel on micro hardness of restorative material has given varied results. It has been reported to increase (Cooley and Burger, 1991) or decrease (Bailey and Swift, 1992) or it may remain unchanged (Narthoo and Others, 1994) [14].
In our study no lightening gels were incorporated in the dentifrice and the probable reason for decrease in micro hardness could be due to the exposure of inner layers of material due to the wear of the materials. Micro hardness values improved with rising curing time and decreased with increasing depth. Material nearer to the light source was hard because of complete polymerization [15]. A positive correlation has been determined between the hardness and inorganic filler content of composites. Increased organic filler levels results in increased hardness values [16]. This could be the reason why there was a change in micro hardness of compomer and composite after brushing with whitening toothpaste for four weeks.
Colour change
Testing for colour stability was done using a spectrophotometer. (Minolta spectrophotometer CM-33) [17]. The parameter ΔE (total colour change) for each specimen was recorded as displayed on the computer.
The results showed a highly significant colour change with whitening dentifrice at two weeks’ time intervals for both the materials. However, no much colour change observed after four weeks. Studies regarding the effectiveness of whitening toothpastes have shown a stain removing quality on the tooth surface [18,19]. However, studies conducted to know the colour stability of restorative material after using whitening dentifrice are very limited. The probable reason for the highly significant change in colour could be due to the ingredients of whitening toothpaste. Whitening dentifrice had an extra ingredient called perlite. Perlite is an amorphous mixed glossy silicate of volcanic origin, which is chemically inert and neutral in pH. Perlite is well known for its use in professional prophylactic pastes where it has been shown to exhibit excellent cleaning and polishing properties. In addition, the combination of silica and perlite in toothpaste has been demonstrated to have significant stain removal and prevention benefit in a clinical study [20]. Thus the presence of perlite acting as an abrasive in whitening dentifrice could be the reason for significant change in colour of restorative material. Exposure of the inner surface due to the wear of the material could be attributed to the colour change.
Surface roughness
Abrasives act by reducing or eliminating the stains [10]. Specimens were evaluated for surface roughness using a surface testing machine with a radius 1.5μm moved at a constant speed of 0.1 mm/s with a force of 0.7 mm. The cutoff was set at 0.25mm.
The results revealed compomer and composite when brushed with both whitening dentifrice showed highly significant changes in surface roughness at the end of four weeks compared to results obtained after two weeks. However with whitening dentifrices it was more. These results were in accordance with previously done studies where whitening dentifrice on restorative materials have shown a change in roughness [21]. It was verified that the dentifrice containing carbamide or hydrogen peroxide along with alumina + silica and calcium carbonate produced changes in roughness [10]. It has been demonstrated that tooth brushing can abrade the surface of resin composite based materials with a three body wear process. Tooth brushing can erode the softer polymer matrix, leaving the harder reinforcing particles standing higher in relief [10]. Dentifrice normally contains an abrasive [22]. Thus the increased surface roughness at the end of four weeks with whitening dentifrice could be due to either the brushing which can abrade the surface or due to the abrasives which are present in the dentifrices. The difference in surface roughness of compomer and composite may be attributed to the wear resistance of composite than compomer [23].
Limitations
The results obtained and the conclusions drawn are based on invitro studies, correlation to clinical practice requires further invivo research to evaluate long term effects of whitening tooth paste on aesthetic restorative materials with larger sample size.
Conclusion
Within the limitations of present study it can be concluded that the use of whitening toothpaste does cause change in the colour, surface roughness of aesthetic restorative materials. It was observed that at the end of four weeks long duration with use of whitening dentifrice, changes in colour and surface roughness was highly significant.
Thus, these results make us to be cautious before prescribing whitening dentifrices. The number and the type of restorative material are factors to be considered before prescribing. Also dentifrices are used daily and these novel preparations claiming whiteness of the teeth attract the people, resulting in its widespread use. The deleterious effects this can have on the aesthetic restorations also need to be accounted for.
*Intra group comparison: paired t-test **Intra group comparison: unpaired t-test
*Intra group comparison – paired t-test **Intra group comparison – unpaired t-test
*One-way ANOVA **Post-hoc Tukey’s test
*Intra group comparisons: paired t-test ** Intra group comparisons: unpaired t-test
*Intra group comparisons: paired t-test **Intra group comparisons: unpaired t-test
*One-way ANOVA
**Post-hoc Tukey’s test
*Intra group comparisons: paired t-test **Intra group comparisons: unpaired t-test
*Intra group comparison: paired t-test **Intra group comparison: unpaired t-test
*One-way ANOVA **Post-hoc Tukey’s test