The posterior fibro-muscular part of the palate which is attached to the hard palate is called as soft palate [1]. The palate is formed by the fusion of three components, namely two palatal processes and the primitive palate, which is formed by the frontonasal process. At a later stage, the mesoderm in the palate undergoes intra-membranous ossification to form the hard palate. However, the ossification does not extend into the most posterior portion, which remains as the soft palate [2].
Mouth is isolated from oropharynx during swallowing by the soft palate without altering the breath pattern, while velopharyngeal closure helps in correct pronunciation of consonants with further modification in the quality of voice [2].
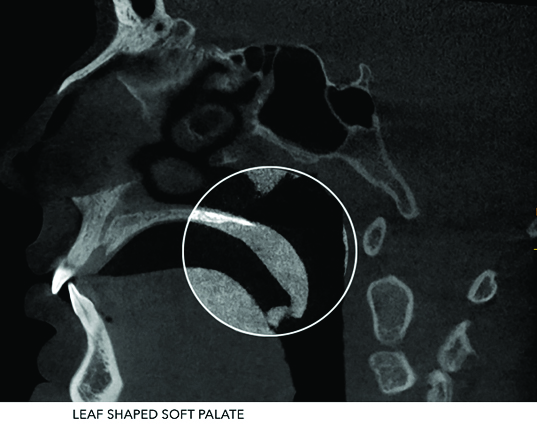
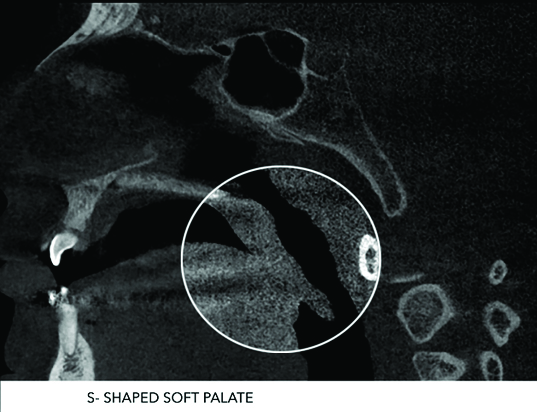
Various studies have been done to study morphological variations of soft palate using lateral cephalogram. In the study done by You et al., [3], the morphological variations were classified into six types (Type 1: Leaf shaped; Type 2: Rat tail; Type 3: Butt like; Type 4: Straight line; Type 5: S-shaped and Type 6: Crook shaped). Pepin et al., reported that the “Hooked or S-shaped” soft palate indicated a high risk of the obstructive sleep apnoea syndrome [4]. According to Subtelny, Need’s ratio is pharyngeal depth to velar length which ranges from 0.6 to 0.7 in normal population, if it increases, concern group may have a risk of VPI (Velopharyngeal incompetency) [5].
According to our knowledge there have been no studies done to determine varied soft palate morphology and configuration using CBCT. So, the purpose of this present study was to investigate the variation in morphology of soft palate in different age and gender groups, and to find its association with the Need’s ratio, radiographic Velar Length (VL), Velar Width (VW) and Pharyngeal Depth (PD) in different morphological velar types, age groups and gender using CBCT in Central Madhya Pradesh population.
Materials and Methods
This retrospective study was conducted in the Department of Oral Medicine and Radiology of our institute. Study sample consisted of 121 CBCT scans of healthy individuals within the age range of 15-45 years were retrospectively selected from the CBCT database. Scans taken between ‘2012 to 2015’ were included. Scans of patients below 15 years and above 45 years of age and scans of patients showing cleft palate, soft palate syndromes and fractures of the head and neck were excluded.
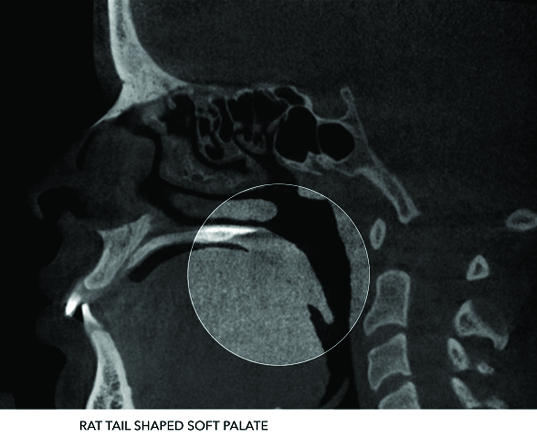
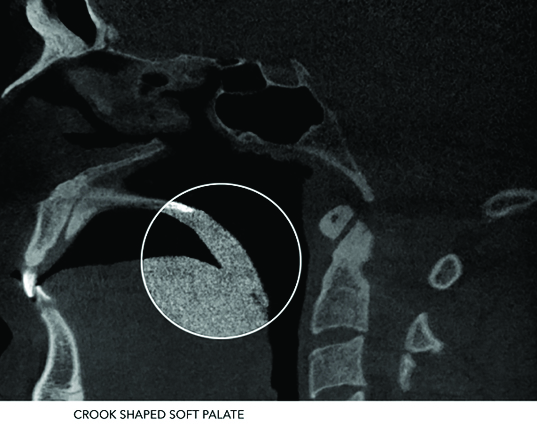
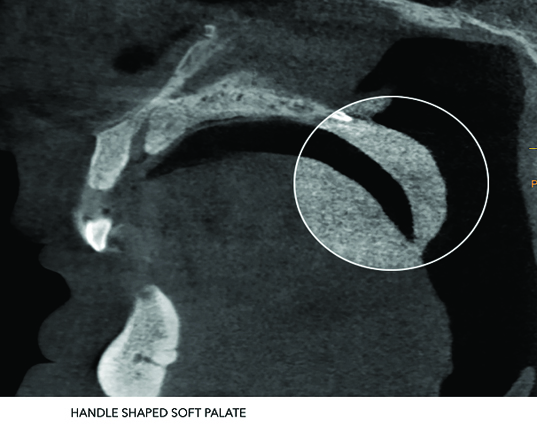
One hundred and twenty one scanned full volume CBCT images recorded by digital radiographic machine (Kodak CS9300, Carestream Health Inc., Rochester, NY) with a tube potential of 90 kV, a tube current of 5 mA, Voxel size of 300μm and an exposure time of 11.30 seconds were included. All the scans were taken with the patients standing upright in a natural head position and were instructed to contact their molars and breathe through their nose. All the scans were analysed and categorized into six types according to the soft palate morphology by an oral and maxillofacial radiologist [Table/Fig-1,2,3,4,5 and 6].
Rat Tail shaped soft palate.
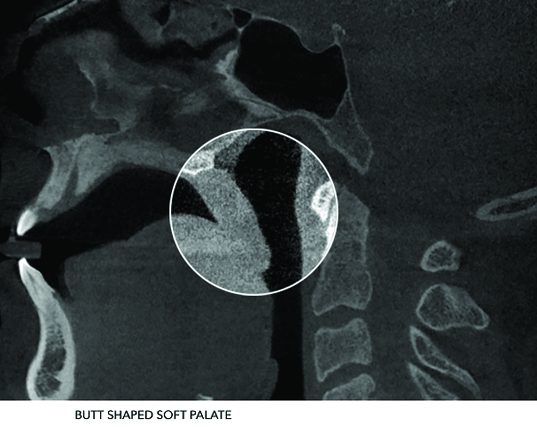
Crook shaped soft palate.
Handle shaped soft palate.
While interpretation, the scans in the sagittal sections were observed keeping the mid-sagittal plane in centre.
During resting position of soft palate,
VL = Linear distance from posterior nasal spine to tip of uvula.
VW = Thickest section of velum
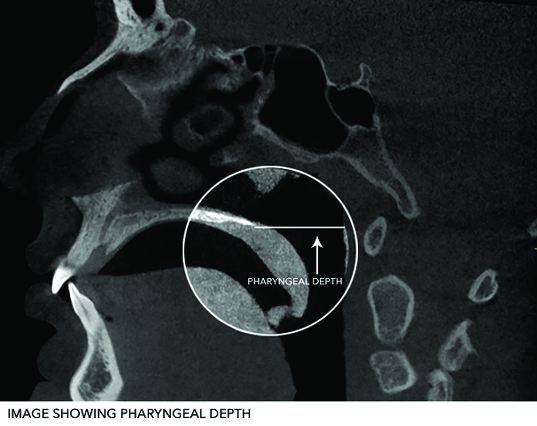
PD = Linear distance from posterior surface of nasal spine to posterior pharyngeal wall along palatal plane [1] [Table/Fig-7,8 and 9].
Image showing velar length.
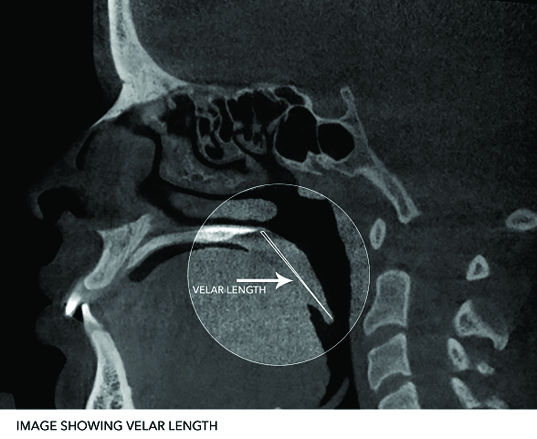
Image showing velar width.
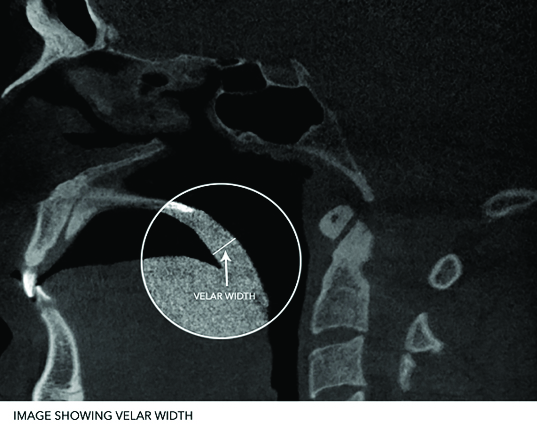
Image showing pharyngeal depth.
The measurements were carried out for each digital scan using Kodak software, twice by the same examiner, and the obtained mean value was considered. The Need’s ratio was calculated for all the subjects by the division of PD by VL.
Statistical Analyses
Statistical analyses included both descriptive and inferential methods. The data was analysed by using statistical software SPSS version 17.0. Continuous variables were expressed as mean ± standard deviation while the results on categorical measurements were presented in numbers (%). The Pearson’s Chi-Square test was used to observe the association of sex with types of soft palate. One-way analysis of variance (ANOVA) was carried out to identify the significance of mean differences; in morphological variants among different age groups, types of the soft palate, and in different types of morphological soft palate among various age groups. Z-test was used to identify the significance of mean differences between male and female in different morphological variants. The probability value p≤0.05 was considered as significant while p≤0.001 was considered as highly significant.
Results
In this study, 121 subjects that included 67 males (55.4%) and 54 females (44.6%) were studied for evaluation of the morphological variants and types of soft palate observed in CBCT images. The mean age and standard deviation (SD) of all subjects were 27.23 ± 10.33 years. All the scans were interpreted for soft palate morphology and following six shapes were identified i.e. Rat tail, Butt shape, Leaf shape, Handle shape, S-shape and Crook shape.
The rat tail shape was most common (43, 35.5%) in our subjects and it was recognized in 22 (18.2%) females and in 21 (17.4%) males. The second common type of soft palate was butt shape (32, 26.4%) reported in 22 (18.2%) males and in 10 (8.3%) females and followed by leaf shape (17, 14.0%) noted in 12 (9.9%) males and in 5 (4.1%) females.
A new dimension added to morphological types of soft palate in central Madhya Pradesh population was the handle shape (13, 10.7%) seen in 7 (5.8%) males and in 6 (5.0%) females. The least common type of soft palate was crook shape (4, 3.3%) obtained in 2 (1.7%) males and 2 females. These differences in morphological types of soft palate between sexes were not statistically significant (p>0.05). Moreover, it was observed statistically that sex was not the significant factor that impacted the shapes of soft palate. Thereby, concluding that sex determination cannot be done with respect to variation in shapes of soft palate [Table/Fig-10].
Distribution and association of types of soft palate with sex.
| Sex | Shape of soft palate | Total |
|---|
| Leaf shape | Rat tail shape | S-shape | Butt shape | Crook shape | Handle shape |
|---|
| Male | 12 | 21 | 3 | 22 | 2 | 7 | 67 |
| 9.9% | 17.4% | 2.5% | 18.2% | 1.7% | 5.8% | 55.4% |
| Female | 5 | 22 | 9 | 10 | 2 | 6 | 54 |
| 4.1% | 18.2% | 7.4% | 8.3% | 1.7% | 5.0% | 44.6% |
| Total | 17 | 43 | 12 | 32 | 4 | 13 | 121 |
| 14.0% | 35.5% | 9.9% | 26.4% | 3.3% | 10.7% | 100.0% |
| p-value | c52 = 9.19*; p>0.05 (Insignificant) |
*The association is not significant at 5 degrees of freedom at the 0.05 levels of significance. Statistical test used Chi Square Test
Leaf shape and butt shape were identified in all age groups [Table/Fig-11]. Crook shape wasn’t recognized in age groups 3 and 4 (25-30 and 30-35 year) while rat tail shape and s-shape were absent in group 5 (35-40 year) and group 4 (30-35 year) respectively. The new dimension to types of soft palate was handle shape, which was absent in group 3 (25-30 year).
Distribution and association of types of soft palate with age
| Age groups | Mean age (year) at different shape of soft palate |
|---|
| Leaf shape (n=17) | Rat tail shape (n=43) | S-shape (n=12) | Butt shape (n=32) | Crook shape (n=4) | Handle shape (n=13) |
|---|
| 15-20 | 17.33 | 17.00 | 16.67 | 16.90 | 17.00 | 16.50 |
| 20-25 | 21.86 | 21.07 | 22.00 | 22.00 | 24.00 | 22.00 |
| 25-30 | 27.00 | 26.00 | 29.00 | 25.50 | - | - |
| 30-35 | 30.00 | 32.50 | - | 31.50 | - | 30.00 |
| 35-40 | 36.50 | - | 36.50 | 35.00 | 35.00 | 38.00 |
| 40-45 | 45.00 | 43.75 | 43.75 | 44.17 | 43.00 | 45.00 |
| F-value | 57.54 | 577.28 | 100.81 | 307.73 | NA | 240.32 |
| p-value | p<0.001# | p<0.001# | p<0.001# | p<0.001# | NA | p<0.001# |
#The mean differences are highly significant at the 0.001 level of significance. NA-Not Applicable, as there were only 4 samples in all, and only 1 sample in each age group. Statistical Test Used: ANOVA
Rat tail shape was the most prevalent type in all the age groups and followed by butt shape. The statistical agreement by using one way analysis of variance (ANOVA) showed that the mean differences among all the six age groups for morphological types were highly significant, which concludes that types of soft palate, can be determined according to the age.
The mean velar length and pharyngeal depth were the smallest in butt shape and handle shape while maximum in leaf shape and crook shape soft palates, respectively [Table/Fig-12]. The mean velar width was the shortest in S-shape and maximum in leaf shape, whereas the Need’s ratio was found to be the lowest and equal in both, leaf and S-shape and the highest in crook shape velar morphology. The Need’s ratio ranged from 0.29 to 1.22, had 95.0% confidence interval ranging from 0.68 to 0.74.
Comparison in types of soft palate with different morphological variants.
| Soft palate | Mean (mm) of morphological variants |
|---|
| Types | N=121 | VelarLength | VelarWidth | PharyngealDepth | Need’sRatio |
|---|
| Leaf shape | 17 | 34.86 | 9.83 | 23.77 | 0.69 |
| Rat tail shape | 43 | 36.25 | 9.54 | 24.77 | 0.70 |
| S-shape | 12 | 35.72 | 8.01 | 24.44 | 0.69 |
| Butt shape | 32 | 33.06 | 9.68 | 23.50 | 0.72 |
| Crook shape | 4 | 33.38 | 8.18 | 27.13 | 0.81 |
| Handle shape | 13 | 33.32 | 8.68 | 23.42 | 0.71 |
| F-value | 1.44 | 2.03 | 0.83 | 0.44 |
| p-value | p>0.05* | p>0.05* | p>0.05* | p>0.05* |
*The mean differences are not significant at the 0.05 level of significance. [Degrees of freedom are 5 and 115] Statistical Test Used: ANOVA
The statistical agreement based on one-way analysis of variance (ANOVA) highlighted that the mean differences in morphological variants: velar length velar width, pharyngeal depth and Need’s ratio were not significant (p>0.05) among morphological types of the soft palate. So it was concluded that types of soft palate cannot be identified by calculating velar length, velar width, pharyngeal depth and Need’s ratio.
Morphological variants were found to be significantly different among male and female except the pharyngeal depth which reflected a gender bias for variants. The mean velar length (36.40 mm) and velar width (10.07 mm) were higher among males as compared to mean velar length (32.69 mm) and velar width (8.40 mm) among females but the pharyngeal depth (24.03 mm) and Need’s ratio (0.67 mm) were lower among males than the mean pharyngeal depth (24.39 mm) and Need’s ratio (0.76 mm) among females [Table/Fig-13].
Comparison of mean differences in different morphological variants between male and female.
| Morphological variants | Gender(67/54) | Mean±SD(Millimeter) | MD | Z-value | LOS |
|---|
| Velar Length | Male | 36.40±6.11 | 3.71 | 3.71 | p<0.001# |
| Female | 32.69±4.55 |
| Velar Width | Male | 10.07±2.00 | 1.67 | 4.81 | p<0.001# |
| Female | 8.40±1.78 |
| Pharyngeal Depth | Male | 24.03±4.67 | 0.36 | 0.46 | p>0.05* |
| Female | 24.39±3.71 |
| Need’s ratio | Male | 0.67±0.16 | 0.09 | 3.03 | p<0.003# |
| Female | 0.76±0.15 |
#The mean difference is highly significant at the 0.003 and 0.001 levels of significance. *The mean difference is not significant (insignificant) at the 0.05 level of significance. [Degrees of freedom are 119; MD-Mean Difference; LOS-Level of Significance]
Statistical Test Used: Z Test
The statistical agreement projected that the mean differences between male and female for morphological variants: velar length (p<0.001), velar width (p<0.001) and Need’s ratio (p<0.003) were highly significant but pharyngeal depth was not found to be significantly (p>0.05) different, which concluded that sex can be determined using velar length, velar width, pharyngeal depth and Need’s ratio as velar length and velar width is more among males while Need’s ratio and pharyngeal depth is more among females.
An increase with a small variation in mean velar length and pharyngeal depth was noted with an increase in age while mean velar width and Need’s ratio were identified with an inconsistent pattern.
The statistical agreement based on one-way analysis of variance (ANOVA) reported that the mean differences in morphological variants: velar length (p<0.005) and pharyngeal depth (p<0.001) were highly significant but velar width (p>0.05) and Need’s ratio (p>0.05) weren’t significant among different age groups [Table/Fig-14]. This concluded that velar length and pharyngeal depth increases with age while Need’s ratio and velar width had no significance.
Comparison in age groups with different morphological variants.
| Age groups | Mean (mm) of morphological variants |
|---|
| Group | N=121 | VelarLength | VelarWidth | PharyngealDepth | Need’sRatio |
|---|
| 15-20 | 31 | 32.68 | 9.03 | 21.12 | 0.66 |
| 20-25 | 39 | 33.53 | 9.11 | 24.89 | 0.76 |
| 25-30 | 8 | 35.60 | 8.71 | 24.89 | 0.70 |
| 30-35 | 10 | 35.22 | 9.92 | 24.98 | 0.72 |
| 35-40 | 7 | 35.86 | 8.89 | 25.86 | 0.74 |
| 40-45 | 26 | 38.30 | 10.09 | 25.84 | 0.69 |
| F-value | 3.59 | 1.31 | 5.39 | 1.36 |
| p-value | p<0.005# | p>0.05* | p<0.001# | p>0.05* |
#The mean differences are highly significant at the 0.005 and 0.001 levels of significance. *The mean differences are not significant at the 0.05 level of significance. [Degrees of freedom are 5 and 115] Statistical Test Used: ANOVA
Discussion
An advanced technique for evaluating pharyngeal and velar morphology is Cone Beam Computed Tomography analysis. Various morphometric measurements of soft palate were obtained in median sagittal plane using CBCT.
Recent advances in radio diagnostic technique like CBCT (Cone Beam Computed Tomography) have allowed its commercial production and practical application in today’s patient care and dental education environment [6]. It has added advantages over other radio diagnostic techniques like it gives three dimensional view of an object, correct identification of landmarks as compared to lateral cephalogram which gives two dimensional view of an object [7]. The linear measurements that are made from CBCT images are not significantly different from actual direct measurements of anatomic structures in the dento-maxillofacial area [8].
In the present study, the most common shape of soft palate found was Rat Tail shape (35.5% cases), noted in central Madhya Pradesh population, while according to You M et al., and Verma et al., [1,3] the common type found was leaf shaped in north Indian sub population.
In our study, done on the samples of central Madhya Pradesh population, a newer shape i.e. Handle shape was found in all the age groups except 25-30 years of age group. This newer shape was not seen in the previous studies done [1,3].
In the previous studies done by You et al., and Verma et al., a linear shape was identified in 10% and 8.7% of cases respectively [1,3]. This particular shape was not seen in our study.
S-shaped soft palate was seen in 9.9% of the cases in the present study, while it was observed in 4.7% cases in study done by Verma et al., [1], 3.5% o cases were detected in study done by You et al., [3], inferencing that Central Madhya Pradesh population have greater chances of having Obstructive Sleep Apnoea Syndrome (OSAS).
A significant increase in velar length with increase in age was noted in our study. It was consistent with the findings of previous studies done by Verma et al., Johnston & Richardson and Taylor et al., [1,9,10].
In the study done by Kollias and Krogstad [11], increase in velar length was equal among males and females. While in our study, this was significantly greater in males as compared to females, which is in accordance with the results of the study done by Verma et al., [1].
During speech, swallowing and pronunciation, velopharyngeal closure helps in the separation of nasal cavity from oral cavity. If this closure does not take place, VPI occurs [12].
According to Subtelny, the risk of VPI increases when Need’s ratio becomes greater than 0.70. Need’s ratio varies with variations in shapes of soft palate i.e. in the present study Need’s ratio was maximum in Crook Shape (0.81) as compared to other previous studies in which S-shaped soft palate accounted for maximum Need’s ratio [5]. Thus indicating that Central Madhya Pradesh population, who have Crook shaped soft palate, have a greater chance towards VPI.
In our study, Need’s ratio was more in females as compared to males, which is in accordance with the study done by Verma et al., Thus highlighting that, females are more prone for VPI than males [1].
In our study, Need’s ratio was greater than 0.70 in ages between 20 to 25 year and 30 to 40 year old individuals. Thus, indicating that further investigations are required in individuals of this age to rule out VPI.
Limitation
However, limitation of our present study was lack of patient’s clinical evaluation and lack of confirmation between increase in need’s ratio and patient’s snoring history. Further studies should be carried out including patient’s evaluation with history part and compare with morphological variants of soft palate to justify the results, taking more sample size.
Conclusion
The present study highlighted the various morphological appearances of soft palate using CBCT. Among the various shapes identified, rat tail shape was the commonest and linear shape was not seen in study sample at all. Handle shape was newly identified shape seen in this study among Central Madhya Pradesh population. The study also implicated that chances of VPI were more among females, individuals in the age group of 20 to 25 years and 30 to 40 years. Individuals of Central Madhya Pradesh population having Crook shaped soft palate were more prone towards VPI. In Central Madhya Pradesh population, there is higher percentage of S-shaped soft palate as compared to other previous studies, which indicated that individuals of this population had a greater chance of inclination towards OSAS.
*The association is not significant at 5 degrees of freedom at the 0.05 levels of significance. Statistical test used Chi Square Test
#The mean differences are highly significant at the 0.001 level of significance. NA-Not Applicable, as there were only 4 samples in all, and only 1 sample in each age group. Statistical Test Used: ANOVA
*The mean differences are not significant at the 0.05 level of significance. [Degrees of freedom are 5 and 115] Statistical Test Used: ANOVA
#The mean difference is highly significant at the 0.003 and 0.001 levels of significance. *The mean difference is not significant (insignificant) at the 0.05 level of significance. [Degrees of freedom are 119; MD-Mean Difference; LOS-Level of Significance]
Statistical Test Used: Z Test
#The mean differences are highly significant at the 0.005 and 0.001 levels of significance. *The mean differences are not significant at the 0.05 level of significance. [Degrees of freedom are 5 and 115] Statistical Test Used: ANOVA