One of the problems that often arise in the Orthodontic treatment of adult patients is the presence of periodontal disease and loss of bone support. The intensity of the forces and moment to force ratios needed to be applied during an orthodontic treatment must be adapted to obtain the same movement as in a tooth with a healthy periodontal support [1]. This is because excessive Orthodontic force with advanced periodontal bone loss may traumatize the periodontium, create increased areas of hyalinization or may subject the tooth to increased chances of root resorption (depending on the magnitude & distribution of this stress), which may affect the Orthodontic tooth movement [2]. The Finite Element Method (FEM) used in this study has been used in various areas of research in Orthodontics. It can be used to assess the stress distribution after application of force. The FEM is highly specific tool for analyzing the bio-mechanical effects occurring on tooth movement [2].
The study was conducted with the aim & objective to evaluate & assess the stress distribution during various types of Orthodontic tooth movement on application of Orthodontic force, at various levels of alveolar bone loss; & determine the most ideal force system producing the Optimum Stress (i.e., stress within optimum range), uniformly (conducive to bodily movement of maxillary canine with varying degrees of bone loss).
Materials and Methods
The present study was conducted in the Department of Orthodontics & Dentofacial Orthopaedics, Kothiwal Dental College & Research Centre, Moradabad (U.P.), India, using the Finite Element Method (FEM) of analysis.
The analytical model of the tooth was developed from the Computed Tomography (CT) scan images of an extracted human maxillary right canine. The tooth belonged to a male aged 24 years & was extracted for periodontal reasons & then stored in distilled water till the time of scan. The canine tooth was morphologically, structurally & dimensionally sound. The scanned images were procured in CAD (computer aided design)-compatible DICOM (digital imaging & communications in medicine) file format. For the construction of the 3D CAD model, a highly sophisticated workstation with a dedicated graphic RAM was used. Configuration of the system used for this study was- Pentium IV 2.5 GHz, 4GB RAM, Windows XP. CAD software (version 2.3 Villsoft, UK) and ANSYS software (version 8.0, Canonsburg, Pa) were used. The tracings of the slices were piled up in an oriented fashion to represent the 3D geometry of the tooth [Table/Fig-1]. During the modeling process 5 different models were constructed with 0mm(M1), 2mm(M2), 4mm(M3), 6mm(M4), & 8mm(M5) bone loss. The material physical properties—Young’s modulus and Poisson’s ratio were then applied to the tooth, periodontal ligament and alveolar bone, as described in a previous study [2]. The 10 unique loading conditions were applied on the constructed models (M1 to M5) as per [Table/Fig-2].
3D geometry of the tooth.
| AbbreviationFor forceSystems | Force system/ Loading conditions | Type of tooth movement inModel 1(M1) |
|---|
| 1 | L1 | 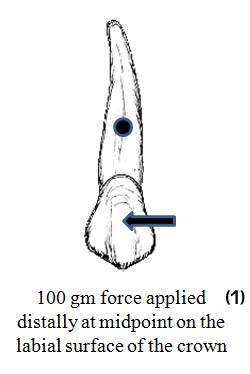 | Distal tipping + Distal-in rotation |
| 2 | L2 | 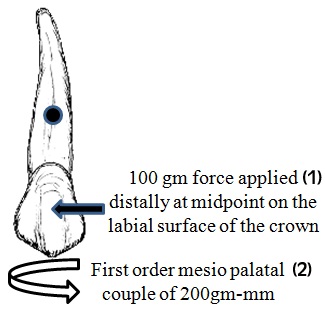 | Distal Tipping without distal-in rotation |
| 3 | L3 | 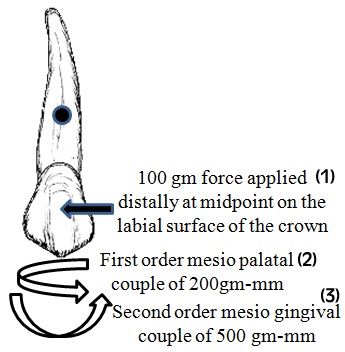 | Uncontrolled tipping |
| 4 | L4 | 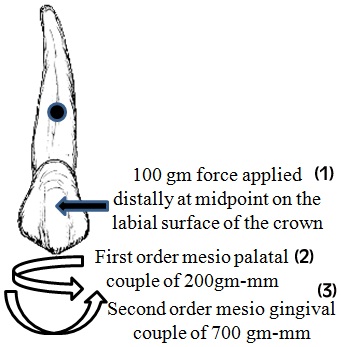 | Controlled tipping |
| 5 | L5 | 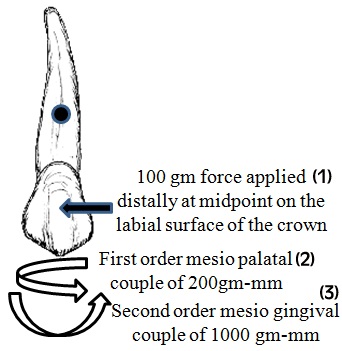 | Translation |
| 6 | L6 | 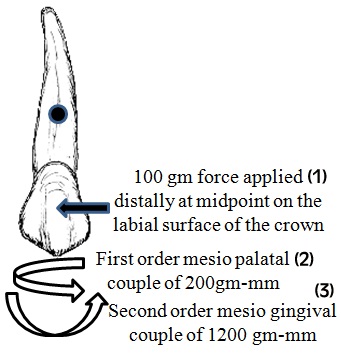 | Torquing |
| 7 | L7 | 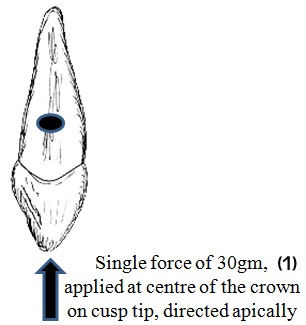 | Pure Intrusion |
| 8 | L8 | 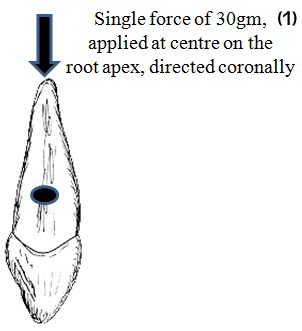 | Pure Extrusion |
| 9 | L9 | 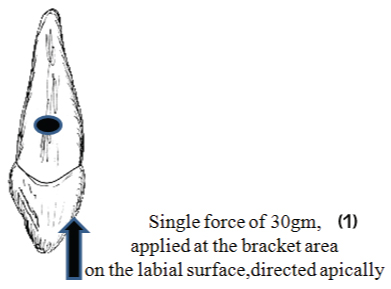 | Intrusion |
| 10 | L10 | 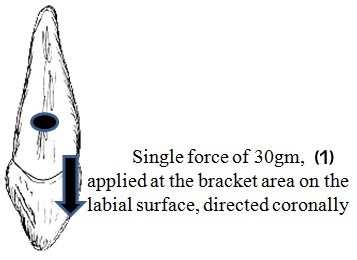 | Extrusion |
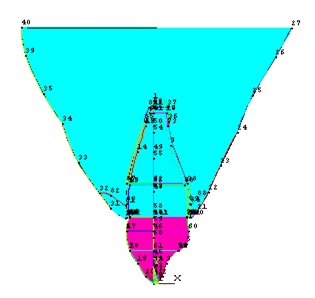
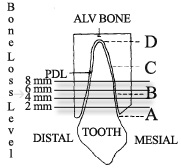
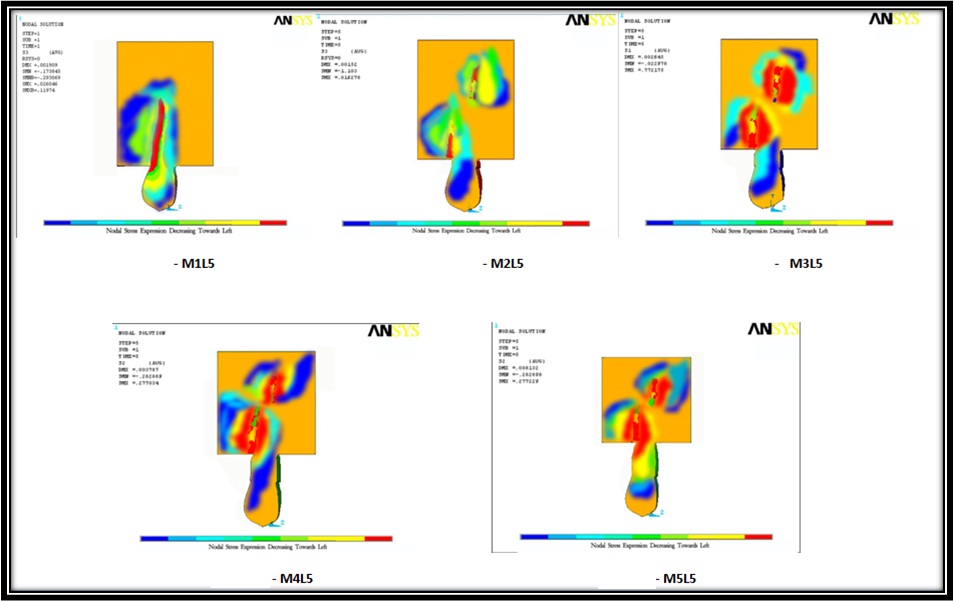
Stress analysis: The stress in the tooth, periodontal ligament and alveolar bone, on applying the loading conditions on the model with no bone loss were initially calculated at different occluso-gingival levels & various surfaces around the tooth [2] [Table/Fig-3,4 and 5]. Then calculations were done after reducing the height of the alveolar bone by 2, 4, 6, and 8 mm [Table/Fig-6]. The computer generated model images in which the different maximum tensions reached in each area were represented by different colours [Table/Fig-7]. The results of the FEM analysis showed the areas of tension and compression in the various parts of the tooth & periodontium. The resultant stress (Sr) at the subject points was calculated. Sr measured the resultant stress at a point by computing stresses in all the three planes and stresses of all the types in a single plane. The evaluation and assessment of the stress distribution during various types of tooth movement on application of Orthodontic force, at various levels of alveolar bone loss was done. Firstly, the stress values & distribution were evaluated for all the movements & loading conditions on model 1 to model 5. An appraisal of the tooth movement occurring in the models (M1 to M5) under various loading conditions was done. Then the change in stress values (whether increasing or decreasing) with progressive bone loss was appreciated.
Different occluso-gingival levels.

Various surfaces around the tooth.
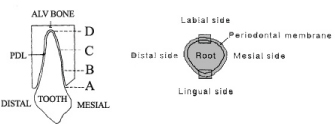
| Occluso-Gingival Level | Level Description | Level Height in MM(from cervix to apex) |
|---|
| A | CERVIX | 0 mm |
| B | 1/3rd FROM CERVIX TO APEX | 5.66 mm |
| C | 2/3rd FROM CERVIX TO APEX | 11.32 mm |
| D | APEX | 16.98 mm |
Reduction in the height of the alveolar bone by 2, 4, 6, and 8 mm.
Model image/Stress diagram.
Statistical Analysis
Values obtained were subjected to following statistical analysis using the SPSS (Statistical Package for Social Sciences) Version 15.0 statistical Analysis Software.
A correlation was established between the alveolar bone loss and stress generation & Pearson’s correlation coefficient was found out for each loading condition from L1 to L10.
Further, it was also seen that whether the correlation established was significant or insignificant at 5% level of confidence (p< .05).
Determination of the ideal force system: To determine the most ideal force system producing the Optimum Stress (i.e. stress within optimum range), uniformly (conducive to bodily movement of maxillary canine with varying degrees of bone loss), Second order mesio-gingival couple (Mc) was applied on each master model (M1 to M5) and this time it was varied in magnitude until a uniform compressive stress loading was generated on the entire distal surface of the canine. The force was maintained as a constant 100 gm distal force.
The ‘second order mesio-gingival couple’ at which there was generation of uniform stress on the distal surface of canine gave the location of centre of resistance on that particular model, and also determined the most ideal force system producing uniform stress for that model (at 100gm constant distal force).
Then, different force values & second order mesio-gingival couple (Mc) combinations were applied at each bone loss model to get compressive stress values within the optimum range together with uniformity in stress distribution pattern (on the distal surface of maxillary canine).
Analysis was also done of the changes that should be made in the Mc:F ratios and force magnitude of the bone loss models to achieve predictable tooth movement with generation of optimum stress, uniformly.
Results
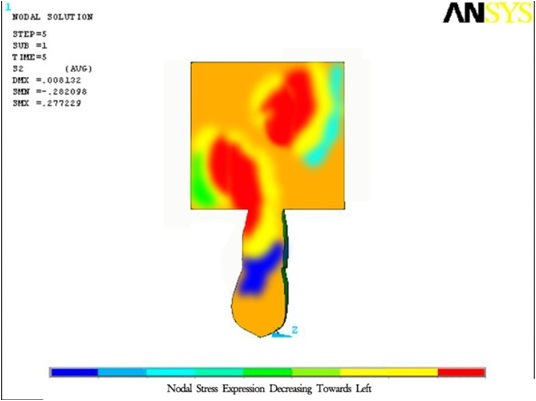
The stress diagrams showed stress generated at various occluso-gingival levels by the means of different colours. A colour palette, displaying a range of colours, at the bottom of each stress diagram suggests the general picture regarding the relative magnitude of stress generated at various areas. Red colour (on extreme right in the colour palette) represents the highest magnitude of compressive stress present in a model at that particular location. As we move towards left on the palette, the compressive stress magnitude decreases until it becomes least as represented by dark blue colour. The range of colours falling in between these two colours on the palette depicts varying magnitudes of compressive stress, decreasing towards left. Actual numerical value of stress generated at various levels and surfaces has been charted in the ‘tables’ provided for each loading condition.
The master stress tables showed stress values generated at various occluso-gingival levels (X – D) on different surfaces of the tooth, periodontal ligament (PDL) & alveolar bone, firstly on no bone loss model (M1) & then on successive bone loss models (M2 –M5). The ‘sign’ (+ve or –ve) is a misnomer (in terms of actual mathematical value of a numeral) & doesn’t suggest increase or decrease in numeric value, but point towards the nature of stress, tensile or compressive.
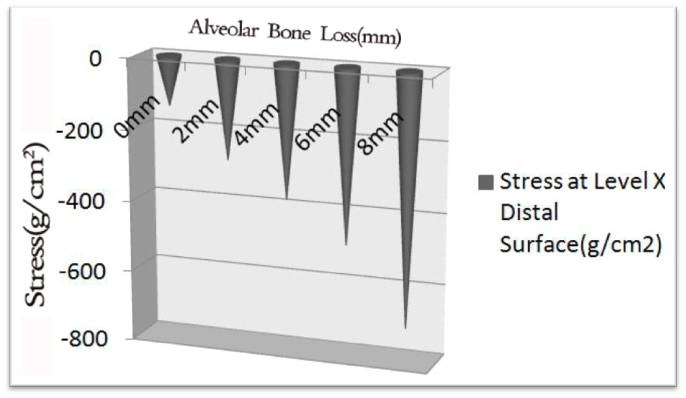
The stress graphs showed the relation between alveolar bone loss and stress generated. The X-axis depicts the progressive bone loss, whereas the Y-axis shows the change in stress.
The stress diagram [Table/Fig-8], master stress table [Table/Fig-9] & stress graphs [Table/Fig-10,11] are showing results of the loading condition L5. Due to a large number of tables and figures, only the representative master stress diagram, stress table & stress graph for loading condition L5 are shown here. Tables for stress at characteristic points (level X distal surface & level D mesial surface), derived from representative master tables for each loading condition (which are not shown here), are provided further however. The [Table/Fig-12,13,14,15,16,17,18,19,20 and 21] (derived from master tables, not shown here) show the stress generated at characteristic points in loading conditions L1 to L10, respectively.
Stress diagram for loading condition L5.
Master stress table for loading condition L5.
| Table/Fig 9(i) LOADING L5 – MESIAL SURFACE |
|---|
| MODEL 1 | MODEL 2 | MODEL 3 | MODEL 4 |
|---|
| TOOTH | PDL | ALV BONE | TOOTH | PDL | ALV BONE | TOOTH | PDL | ALV BONE | TOOTH | PDL |
|---|
| X | +105.86 | +95.60 | +100.66 | +275.39 | +267.49 | +271.12 | +321.35 | +311.26 | +315.48 | +351.39 | +341.29 |
| A | +105.86 | +95.60 | +100.66 | +225.75 | +214.73 | +219.81 | +65.76 | +55.94 | +60.78 | +54.94 | +46.34 |
| B | +96.54 | +86.66 | +91.74 | +214.38 | +204.95 | +209.91 | +275.64 | +266.78 | +271.33 | +341.48 | +332.84 |
| C | +95.46 | +85.78 | +90.68 | +46.59 | +38.94 | +42.71 | +26.61 | +16.68 | +21.36 | +36.79 | +26.93 |
| D | +99.06 | +89.76 | +94.98 | -333.48 | -323.46 | -329.19 | -398.93 | -391.24 | -395.88 | -489.03 | -479.21 |
| Table/Fig 9(ii) LOADING L5 – DISTAL SURFACE |
| MODEL 1 | MODEL 2 | MODEL 3 | MODEL 4 |
| TOOTH | PDL | ALV BONE | TOOTH | PDL | ALV BONE | TOOTH | PDL | ALV BONE | TOOTH | PDL |
| X | -146.34 | -135.54 | -139.63 | -284.02 | -274.88 | -279.60 | -381.58 | -369.05 | -376.66 | -495.67 | -483.88 |
| A | -144.34 | -135.54 | -139.63 | -242.48 | -232.39 | -238.31 | -93.75 | -82.90 | -88.98 | -10.86 | -2.38 |
| B | -139.59 | -129.40 | -134.41 | -259.08 | -249.43 | -254.56 | -353.95 | -339.49 | -345.55 | -484.29 | -471.75 |
| C | -140.79 | -130.44 | -135.64 | -95.02 | -85.76 | -90.91 | -35.78 | -23.95 | -30.13 | -35.96 | -24.58 |
| D | -142.05 | -132.21 | -136.29 | +316.46 | +304.92 | +311.21 | +254.02 | +242.54 | +248.86 | +401.84 | +391.05 |
Stress graph for loading condition L5 (Distal).
Stress graph for loading condition L5 (Mesial).
Stress generated at characteristic points in loading condition L1.
| LOADING L1[Distal force(100g)] |
|---|
| Bone loss | Stress at level X(distal surface)g/cm2 | Stress at level D(mesial surface) g/cm2 |
|---|
| M1 | -271.79 | -274.88 |
| M2 | -323.43 | -350.42 |
| M3 | -415.28 | -420.18 |
| M4 | -549.00 | -555.61 |
| M5 | -755.41 | -790.39 |
Stress generated at characteristic points in loading condition L2.
| LOADING L2[Distal force(100g) + Mesiopalatal couple(200g-mm)] |
|---|
| Bone loss | Stress at level X(distal surface)g/cm2 | Stress at level D(mesial surface) g/cm2 |
|---|
| M1 | -269.96 | -271.49 |
| M2 | -322.16 | -348.08 |
| M3 | -411.31 | -425.53 |
| M4 | -535.12 | -534.36 |
| M5 | -748.81 | -782.32 |
Stress generated at characteristic points in loading condition L3.
| LOADING L3[Distal force(100g)+Mesiopalatal couple(200g-mm)+Mesiogingival couple(500g-mm)] |
|---|
| Bone loss | Stress at level X(distal surface)g/cm2 | Stress at level D(mesial surface) g/cm2 |
|---|
| M1 | -170.62 | -256.61 |
| M2 | -315.51 | -346.61 |
| M3 | -405.66 | -415.22 |
| M4 | -521.11 | -522.13 |
| M5 | -738.81 | -771.69 |
Stress generated at characteristic points in loading condition L4.
| LOADING L4[Distal force(100g)+Mesiopalatal couple(200g-mm)+Mesiogingival couple(700g-mm)] |
|---|
| Bone loss | Stress at level X(distal surface)g/cm2 | Stress at level D(mesial surface) g/cm2 |
|---|
| M1 | -127.61 | +0.14 |
| M2 | -285.06 | -340.11 |
| M3 | -397.61 | -404.44 |
| M4 | -500.31 | -509.91 |
| M5 | -726.58 | -761.79 |
Stress generated at characteristic points in loading condition L5.
| LOADING L5[Distal force(100g)+Mesiopalatal couple(200g-mm)+Mesiogingival couple(1000g-mm)] |
|---|
| Bone loss | Stress at level X(distal surface)g/cm2 | Stress at level D(mesial surface) g/cm2 |
|---|
| M1 | -139.63 | +94.98 |
| M2 | -279.60 | -329.19 |
| M3 | -376.66 | -395.88 |
| M4 | -489.66 | -484.61 |
| M5 | -708.69 | -732.46 |
Stress generated at characteristic points in loading condition L6.
| LOADING L6[Distal force(100g)+Mesiopalatal couple(200g-mm)+Mesiogingival couple(1200g-mm)] |
|---|
| Bone loss | Stress at level X(distal surface)g/cm2 | Stress at level D(mesial surface) g/cm2 |
|---|
| M1 | -95.14 | +112.84 |
| M2 | -169.01 | -2.13 |
| M3 | -275.55 | -280.67 |
| M4 | -429.48 | -421.36 |
| M5 | -656.66 | -698.73 |
Stress generated at characteristic points in loading condition L7.
| LOADING L7 |
|---|
| Model | Stress at Level D (Labial Surface) g/cm2 | Stress at Level D (Lingual Surface) g/cm2 | Stress at Level D (Mesial Surface) g/cm2 | Stress at Level D (Distal Surface) g/cm2 | Mean stress at Level D (g/cm2) | Std Deviation (SD) | Standard Error of Mean (SE) | 95% Confidence Interval (95% CI) |
|---|
| M1 | -50.65 | -49.91 | -50.69 | -50.61 | -50.47 | 0.37 | 0.18 | 0.36 |
| M2 | -53.39 | -52.53 | -54.54 | -54.69 | -53.79 | 1.20 | 0.69 | 1.36 |
| M3 | -59.87 | -56.79 | -58.22 | -60.61 | -58.87 | 1.71 | 0.85 | 1.67 |
| M4 | -85.33 | -86.47 | -75.23 | -74.34 | -80.34 | 6.44 | 3.22 | 6.31 |
| M5 | -111.38 | -112.23 | -109.39 | -109.65 | -110.66 | 1.36 | 0.68 | 1.34 |
Stress generated at characteristic points in loading condition L8.
| LOADING L8 |
|---|
| Model | Stress at Level D (Labial Surface) g/cm2 | Stress at Level D (Lingual Surface) g/cm2 | Stress at Level D (Mesial Surface) g/cm2 | Stress at Level D (Distal Surface) g/cm2 | Mean stress at Level D (g/cm2) | Std Deviation (SD) | Standard Error of Mean (SE) | 95% Confidence Interval (95% CI) |
|---|
| M1 | +69.66 | +71.94 | +70.68 | +72.68 | +71.24 | 1.33 | 0.66 | 1.31 |
| M2 | +75.48 | +79.86 | +75.36 | +81.82 | +78.13 | 3.23 | 1.61 | 3.16 |
| M3 | +84.29 | +85.15 | +80.11 | +90.36 | +84.98 | 4.21 | 2.10 | 4.13 |
| M4 | +91.38 | +99.42 | +86.79 | +96.31 | +93.48 | 5.55 | 2.77 | 5.44 |
| M5 | +101.01 | +105.46 | +99.96 | +102.53 | +102.24 | 2.39 | 1.19 | 2.34 |
Stress generated at characteristic points in loading condition L9.
| LOADING L9 | |
|---|
| Model | Stress at Level D (Labial Surface) g/cm2 | Stress at Level D (Lingual Surface) g/cm2 | Stress at Level D (Mesial Surface) g/cm2 | Stress at Level D (Distal Surface) g/cm2 | Mean stress at Level D (g/cm2) | Std Deviation (SD) | Standard Error of Mean (SE) | 95% Confidence Interval (95% CI) | Stress at Level X (Labial Surface) g/cm2 |
|---|
| M1 | -79.22 | -77.63 | -78.36 | -78.69 | -78.48 | 0.66 | 0.33 | 0.65 | -75.56 |
| M2 | -110.67 | -115.77 | -109.27 | -114.64 | -112.59 | 3.11 | 1.55 | 3.04 | -101.61 |
| M3 | -140.04 | -138.04 | -138.66 | -134.64 | -137.85 | 2.29 | 0.29 | 2.24 | -124.66 |
| M4 | -180.21 | -176.66 | -182.36 | -178.79 | -179.51 | 2.39 | 1.19 | 2.35 | -175.23 |
| M5 | -238.99 | -250.55 | -237.71 | -246.71 | -243.49 | 6.16 | 3.08 | 6.03 | -234.64 |
Stress generated at characteristic points in loading condition L10.
| LOADING 10[Extrusive force(30g) applied at the bracket site] |
|---|
| MODEL | Stress at level D(Labial surface) g/cm2 | Stress at level X(Lingual surface) g/cm2 |
|---|
| M1 | -50.06 | -51.78 |
| M2 | -70.36 | -72.62 |
| M3 | -89.08 | -89.96 |
| M4 | -100.06 | -105.21 |
| M5 | -126.94 | -130.22 |
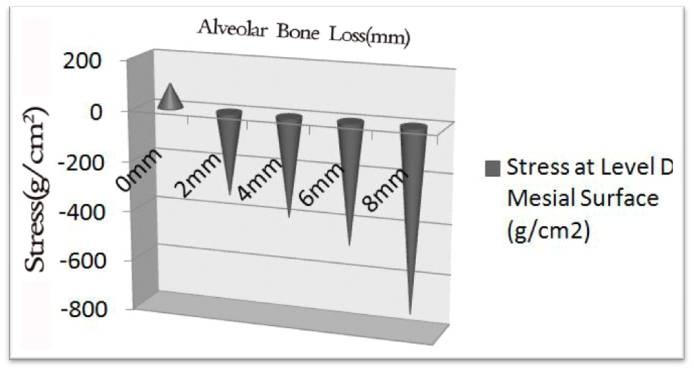
The statistical analysis showed high positive correlation (p<.05) between the alveolar bone loss and compressive stress generated for all the loading conditions from L1 to L10. The graphs [Table/Fig-10,11] represent the positive correlation between alveolar bone loss and compressive stress generated at characteristic points (level X distal surface & level D mesial surface) for loading condition L5 [Table/Fig-16].
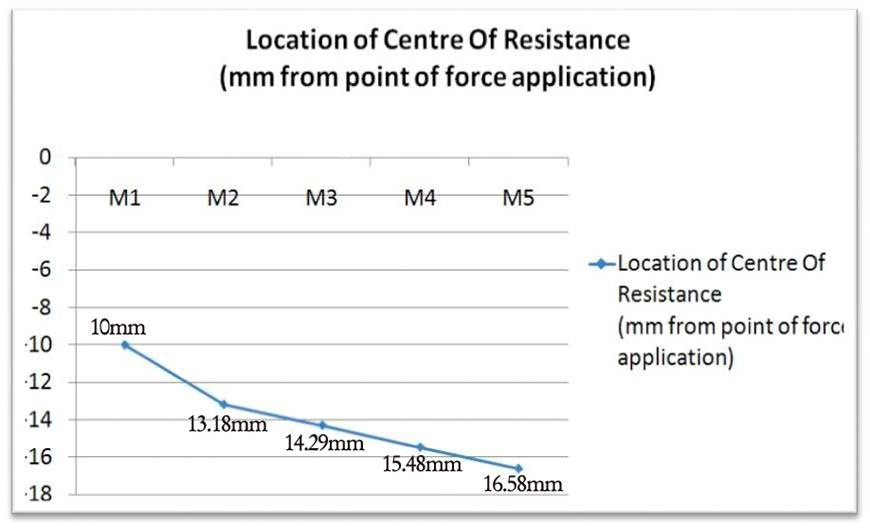
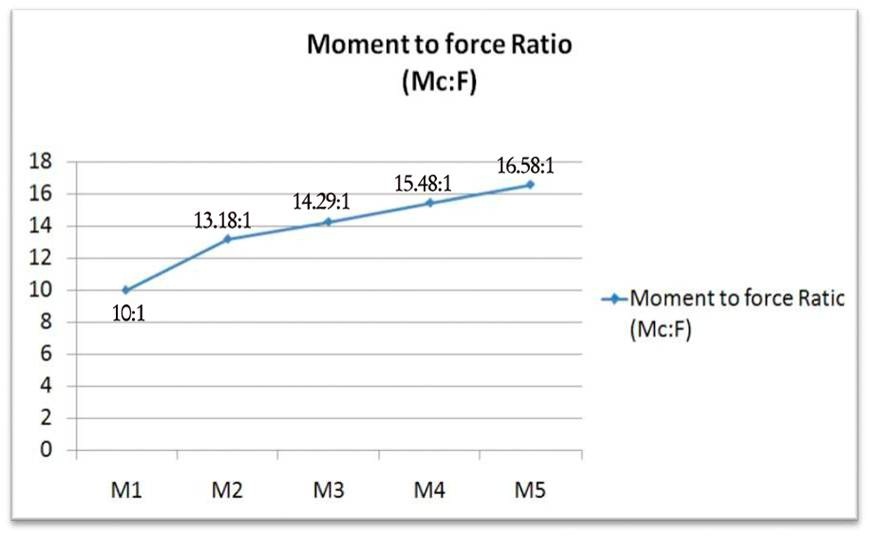
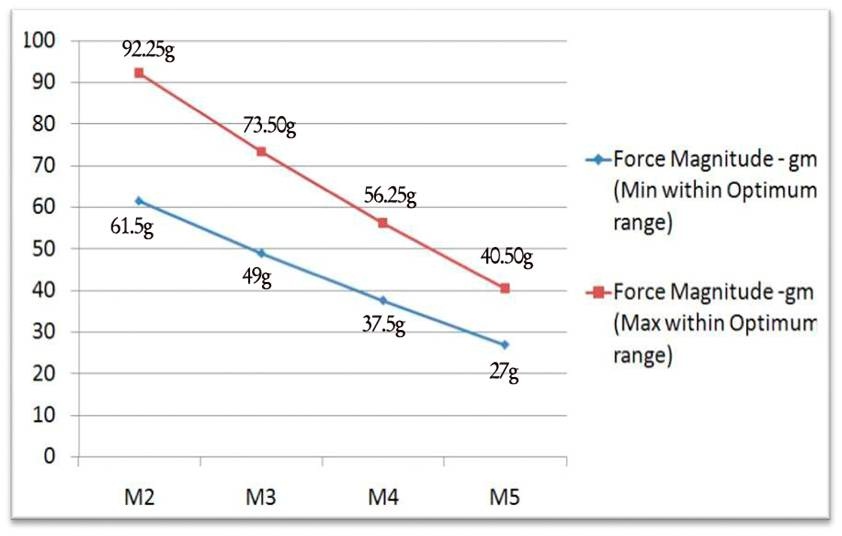
The graph, [Table/Fig-22], shows the apical migration of centre of resistance of the canine with bone loss. Graphs, [Table/Fig-23,24], show the necessary increase in moment to force ratio (Mc:F) & percentage decrease required in force magnitude in bone loss conditions for maxillary canine, respectively.
Apical migration of centre of resistance of the canine with bone loss.
Necessary increase in moment to force ratio (Mc:F) in bone loss conditions.
Percentage decrease required in force magnitude in bone loss conditions.
Discussion
Estimating the magnitude and location of stress in the periodontal ligament is very much essential to enhance the predictability of physiologic orthodontic tooth movement. Force magnitude in relation to the amount of alveolar bone height and necessary modification of moment to force ratio has been implicated by various authors to be important in planning force system in these scenarios [3,4].
Bone loss and increase in stress: Various studies have shown an increase in stress with alveolar bone loss [5–10]. In the present study over maxillary right canine, significant positive correlation (p<.05) was observed between alveolar bone loss and compressive stress values generated at apical and alveolar crest areas. This suggests that as the alveolar bone loss increased, the compressive stress increased. This held true for all the loading conditions (L1 – L10). The findings of the present study were thus in accordance with the previously published literature [5–13].
Bone loss and Type of tooth movement: Alveolar bone loss makes the tooth more prone to tipping & alveolar bone height affects the patterns of initial tooth displacements and hence the type of tooth movement [7].
Tanne in his FEM study over upper central incisor showed that the pattern of tooth movement was changed with different alveolar bone heights [3]. He stated that an important role of the alveolar bone height is in determining the patterns of subsequent tooth movements. This is shown in the present study as well. As the alveolar bone height got reduced, the type of tooth movement changed to uncontrolled tipping. Desired type of tooth movement could not be achieved in the bone loss models (with the force system of model M1).
Pathogenesis of increase in stress with alveolar bone loss: The reason for increase in stress as a result of alveolar bone loss has been cited in literature by different authors [5–9]. A considerable argument exists that because of the reduced bony support and PDL area, the same magnitude of load on the crown causes more pressure in the PDL than without bone loss [5,9]. Further, as the length of the root embedded in alveolar bone decreased with the amount of alveolar bone loss, this caused an increase in the resultant stress [7]. Another factor put forth in the literature is that with alveolar bone loss the tipping tendency of the tooth increases, leading further to the increase in stress [6,7].
The findings of the present study support the above mentioned reasoning, justifying the increase in stress with alveolar bone loss.
A possible explanation for this increase in stress, as suggested by the findings of present study, is the inverse relationship between Pressure (stress) and area of application of the force, such that;
Pressure (Stress) = Force / Area of application of force.
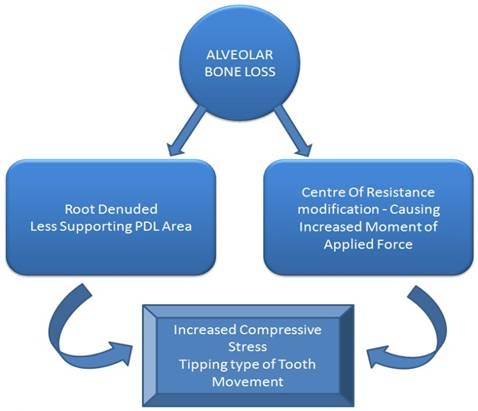
Additionally, it was also observed that with alveolar bone loss the ‘type of tooth movement’ occurring also changed in loading conditions. A possible explanation for the change in the ‘type of tooth movement’ from ‘Desired’ to ‘Tipping’ in bone loss models (M2-M5) under loading condition L4 to L6 is related to a change in the centre of resistance location with progressive alveolar bone loss. As alveolar resorption occurs, the centre of resistance moves apically [3,7,10]. This causes an increase in moment of force (Mf). The moment to force ratio (Mc:F), on the other hand remains same. As a result the Mc:F cannot balance the moment of applied force (Mf) & turns to favour a ‘tipping type of movement’, mostly ‘uncontrolled tipping’. This tipping tendency increases as the bone loss progresses such that the moment of force (Mf) continues to increase successively with each bone loss model, largely unbalanced by the moment to force ratio (Mc:F), and hence the lessened control over root movement [Table/Fig-25].
Pathogenesis of increase in stress with alveolar bone loss.
Centre of resistance location: Various studies have shown that bone loss causes center of resistance modification and it moves toward the apex [3,4,7,10]. The present study also shows that the centre of resistance migrates apically with alveolar bone loss & thereby is in accordance with the above mentioned studies. The centre of resistance locations in the models (M1 to M5) were in close agreement with another study [7].
Moment to Force Ratio (Mc:F) & Force Magnitude: A higher Mc:F ratio had to be used to generate uniform stress in bone loss models. This infers that, since the force was kept constant at 100gm, a higher moment of applied couple (Mc) should be applied in bone loss models as compared to no bone loss model.
A percentage increase of 31.8%, 42.9%, 54.8% & 65.8% should be done in the Mc:F ratio under 2mm, 4mm, 6mm & 8mm bone loss conditions in a maxillary right canine, respectively, to favour bodily movement during canine retraction.
The higher moment to force ratio (Mc:F) although controlled the type of tooth movement to be ‘bodily’ in bone loss models and generated uniform stress at distal surface, but the bone loss decreased the area of periodontium over which the force was distributed. So now the same force of 100gm was being distributed on lesser and lesser area of periodontium as the bone loss progressed from M1 to M5 and hence the increase in magnitude of stress despite uniformity in its pattern of distribution.
Since stress values between 100 -150 g/cm2 are considered optimum, force of magnitude in between the mentioned values can be applied for a particular level of bone loss. The present study suggests that a percentage decrease in force magnitude from 7.5% - 38.5%, 26.5%, - 51%, 43.75% -62.5%, 59.5% - 73% should be done in 2mm, 4mm, 6mm & 8mm of bone loss conditions in a maxillary right canine, respectively, to generate optimum stress during canine retraction.
Clinical implication: Proper caution should be exercised in applying force systems in bone loss conditions and consideration should be given to the centre of resistance modification and its effect on the biomechanical system, to avoid damage to supporting structures.
An inverse relationship was observed between the increase of bone loss and the required amount of force; the opposite was true for Mc/F. It is very useful in clinical practice where reduction in force magnitude is essential to compensate the biomechanical side effects of alveolar bone loss. The same condition may apply to the required increase in Mc/F ratio. For example, for a maxillary canine with 2-mm bone loss, the results suggest that the retraction force should be reduced by 38.5% and that the moment to force ratio should be increased by 31.8% to achieve a bodily movement.
Limitations
This study generates a very useful clinical protocol for determination of forces to be applied in an Orthodontic case with bone loss. Although these deductions are highly accurate owing to the fact that this study has been conducted in a computer environment with the "ANSYS" software, a minor limitation exists that in a real time clinical scenario the readings may have to be adjusted slightly owing to the interference by uncontrollable factors like saliva, thermal changes within the mouth & aggressive or quiescent nature of periodontal disease etc.
Conclusion
It was found that with increase in alveolar bone loss there is an increase in compressive stress generated (high positive correlation) & also the type (pattern) of tooth movement changes i.e. height of alveolar bone determines the pattern of subsequent tooth movement. Further bone loss may change the biomechanical system from desired ‘type of tooth movement’ to ‘uncontrolled tipping’ because of change in the centre of resistance location, and the consequently increased moment of force (Mf). The application of force at bracket site changes the ‘type of tooth movement’ (tipping occurred along with intrusion & extrusion). A percentage increase of 31.8%, 42.9%, 54.8% & 65.8% should be done in the Mc:F ratio under 2mm, 4mm, 6mm & 8mm bone loss conditions in a maxillary right canine, respectively, to favour bodily movement during canine retraction. A percentage decrease in force magnitude from 7.5% - 38.5%, 26.5%, - 51%, 43.75% -62.5%, 59.5% - 73% should be done in 2mm, 4mm, 6mm & 8mm of bone loss conditions in a maxillary right canine, respectively, to generate optimum stress during canine retraction.