A Comparative Study of Sonographic Grading of Renal Parenchymal Changes and Estimated Glomerular Filtration Rate (eGFR) using Modified Diet in Renal Disease Formula
Vinayaka Undemane Shivashankara1, Siddharudha Shivalli2, B.H. Santhosh Pai3, Koteshwara Devadasa Acharya4, Ravichandra Gopalakrishnan5, Vivek Srikanth6, Vishwanath Reddy7, Arafat Haris8
1 Associate Professor, Department of Radiology, Yenepoya Medical College Hospital, Deralakatte, Mangalore, Karnataka, India.
2 Assistant Professor, Department of Community Medicine, Yenepoya Medical College Hospital, Deralakatte, Mangalore, Karnataka, India.
3 Associate Professor, Department of Nephrology, Yenepoya Medical College Hospital, Deralakatte, Mangalore, Karnataka, India.
4 Professor and Head, Department of Radiology, Yenepoya Medical College Hospital, Deralakatte, Mangalore, Karnataka, India.
5 Associate Professor, Department of Radiology, Yenepoya Medical College Hospital, Deralakatte, Mangalore, Karnataka, India.
6 Postgraduate, Department of Radiology, Yenepoya Medical College Hospital, Deralakatte, Mangalore, Karnataka, India.
7 Postgraduate, Department of Radiology, Yenepoya Medical College Hospital, Deralakatte, Mangalore, Karnataka, India.
8 Assistant Professor, Department of Radiology, Yenepoya Medical College Hospital, Deralakatte, Mangalore, Karnataka, India.
NAME, ADDRESS, E-MAIL ID OF THE CORRESPONDING AUTHOR: Dr. Vinayaka Undemane Shivashankara, Associate Professor, Department of Radiology, Yenepoya Medical College Hospital, Deralakatte, Mangalore -575018, Karnataka, India.
E-mail: scanvinayaka@gmail.com
Introduction
The sonographic findings are of help in evaluating the nephrological diseases. Glomerular filtration rate is another parameter for assessing the reserved renal function and an indicator of prognosis. In clinical practice GFR estimation (eGFR) is done by using a mathematical formula. In our study, we compared the sonographic grading of renal parenchymal changes with eGFR calculated using Modified Diet in Renal Diseases formula based on serum creatinine, age, gender and ethnicity.
Aim
To evaluate the relevance of sonographic grading of renal parenchymal changes in assessing the severity of the renal disease and comparing it to the eGFR calculated using MDRD formula based on the age, gender and serum creatinine value of the patient.
Materials and Methods
The adult patients with suspected kidney disease referred for sonography of abdomen were our study participants. As per our study design following strict inclusion and exclusion criteria, patients were selected as study participants and for each of the patient’s renal parenchymal status, serum creatinine, age, gender and ethnicity were documented.
Results
A total of 70 patients were our study participants, out of which 67.1% were males and 32.9% were females. Our study showed a linear correlation between sonographic grading of renal parenchymal changes with eGFR.
Conclusion
We conclude that by evaluating the kidneys with sonography and calculating eGFR using MDRD formula the renal status will be more accurately interpreted.
Correlation, Kidney disease, Ultrasound
Introduction
Sonography is the preferred modality of imaging in suspected cases of acute and chronic renal diseases. The ease of performing the sonography with the advantage of affordability, availability, lack of ionizing radiation, portability with option of conducting investigation at patient’s bedside and repeatability makes sonography as the most useful investigating tool in evaluating renal diseases [1]. Though the sonographic findings of renal diseases are nonspecific, nevertheless these findings are of enormous help in evaluating the nephrological diseases [2]. Sonography is extensively used to assess the kidneys and sonographic grading of renal parenchymal changes is also used by both radiologists and nephrologists to assess the renal function. Glomerular filtration is the process by which the kidneys filter the blood, removing excess wastes and fluids. Glomerular Filtration Rate (GFR) is a calculation that determines how well the blood is filtered by the kidneys, which is one way to measure the remaining kidney function. The GFR is typically recorded in units of volume per time, e.g., millilitres per minute (ml/min). Glomerular filtration rate (GFR) is the best overall index of kidney function, which is the best way to tell how much kidney function the person has. It is used to assess renal function and is a more sensitive measure of renal impairment than serum creatinine. Even with normal range of serum creatinine, person can have significantly reduced renal function and by the time the serum creatinine is increased above normal range, there could be reduction in up to 50 % of renal function, especially in aged individuals. GFR will allow earlier identification of patients with chronic kidney disease (CKD). This is particularly important as these patients are at increased cardiovascular risk compared with the general population and may benefit from risk factor modification. Normal GFR is above 100 ml /minute/1.73 m2. A GFR in the range of 60 -100 may indicate early renal disease. A GFR under 60 ml/minute/1.73 m2 indicates significant kidney disease. Lower GFR value indicates worse kidney function. Also, a progressive decline in GFR is an indicator of declining in the renal function [3]. In clinical practice GFR is estimated (eGFR) using a mathematical formula that considers a person’s body surface area, age, sex, race and serum creatinine levels. Presently eGFR is calculated using modified diet in renal disease (MDRD) formula which gives eGFR in ml/min/1.73 m2. The MDRD formula is derived at (175 × (Scr)-1.154 × (Age)-0.203 × (0.742 if female) × (1.212 if African American). The equation does not require weight because the results are reported normalized to 1.73 m body surface area, which is an accepted average adult surface area. Ethnicity of the person is considered in calculating eGFR using MDRD formula, because Africans tend to have proportionally greater muscle mass than non Africans and therefore produce more creatinine. The estimated GFR using this formula is found to be more accurate and acceptable in evaluating kidney disease in day to day practice [4]. The objective of the present study was to compare the sonographic severity grading of renal parenchymal changes with eGFR calculated using MDRD formula among the patients with bilateral renal disease.
Materials and Methods
The study was conducted in the Department of Radiology, in collaboration with Department of Medicine and Nephrology, Yenepoya Medical College Hospital, Mangalore, India a constituent college of Yenepoya University. The study was conducted in the year 2014. The adult patients with suspected kidney disease referred from the department of medicine and nephrology for sonography of abdomen were the study participants. We conducted a cross-sectional study from March to September 2014 and data was collected for 70 patients during study period. We did not include or exclude the patients for the study based on history of diabetes or hypertension. For each of the patient with suspected renal disease ultrasound scan of abdomen was performed and the renal size was measured and the parenchymal changes were graded. Then the serum creatinine, age, gender were documented for all study participants. The data was analysed using Statistical Package for the social sciences (SPSS) for windows version 16.0.Chicago, SPSS Inc. Descriptive statistics were used to express the results. Pearson or Spearman’s correlation coefficient values were used to draw valid inferences. All the patients of our study were of Indian origin, residents of Karnataka – Kerala origin.
Inclusion criteria: Age >18 years (MDRD formula for calculating eGFR is applicable for persons aged more than 18 only) and patients with bilateral disease.
Exclusion criteria: Those patients on renal replacement therapy like dialysis or renal (to avoid statistical variations as the serum creatinine may not be consistent in them) patients with major physical handicap (as their body surface area is altered and MDRD formula is not acceptable in this group of patients), patients with single kidney, obstructive uropathy, cases of polycystic kidney disease, renal malignancy, patients in sepsis, having acute illness like diarrhea, dehydration and acute febrile illness.
Ethics statement: The ethical committee of the University was consulted and ethical clearance was obtained before starting the study. Written informed consent was taken before enrolling the patients for the study.
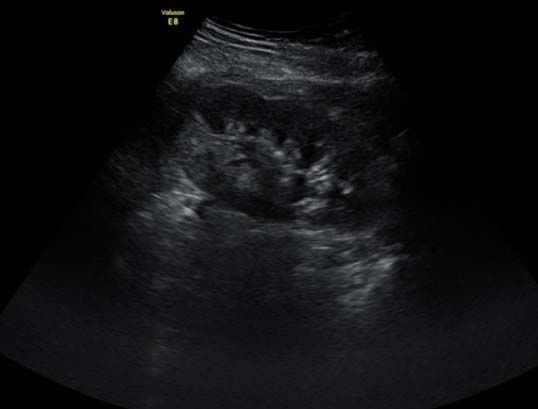
Sonography of study participants was performed with Wipro GE Voluson E8 using convex transducer by a single radiologist having 13 years of experience in renal ultrasound. Patient’s age, sex and ethnicity was documented before doing sonography. For each of study participant, renal parenchymal status was documented based on their size and echo-texture. The echo texture of spleen instead of liver is used to compare the renal cortical echotexture, as presence of fatty liver may cause errors in comparison and splenic echo texture is consistently preserved in majority of population. Following grading system was used [Table/Fig-1,2,3 and 4] [5]:
Grade 0- Normal sized kidney, cortical echogenicity is less than that of spleen, with well maintained cortico-medullary differentiation.
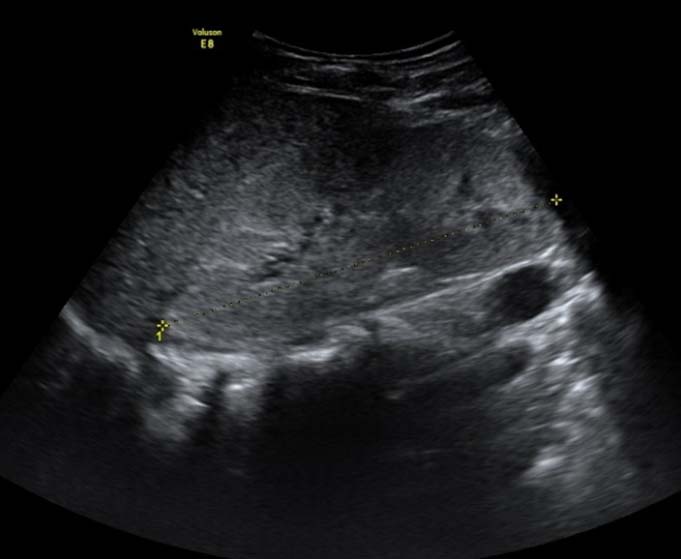
Grade 1- Normal sized kidney, cortical echogenicity is same as that of spleen, with maintained cortico-medullary differentiation.
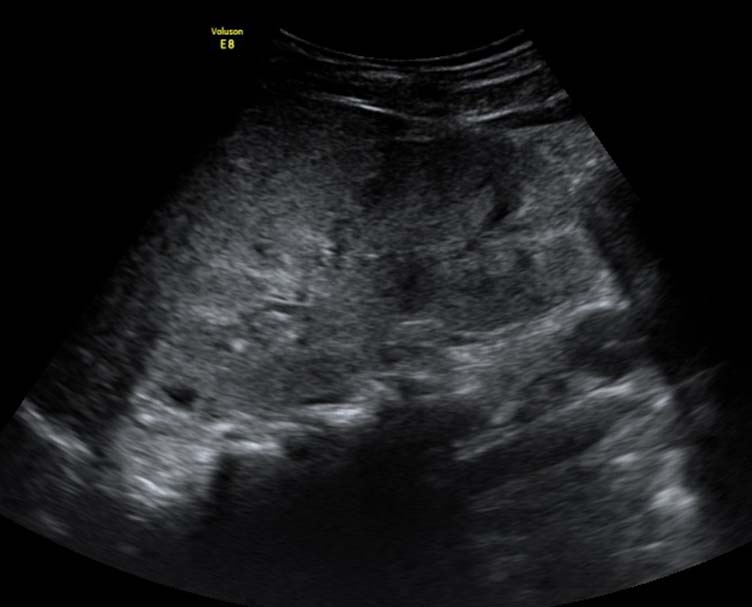
Grade 2- Normal sized kidney, cortical echogenicity is more than that of spleen, decreased cortico-medullary differentiation.
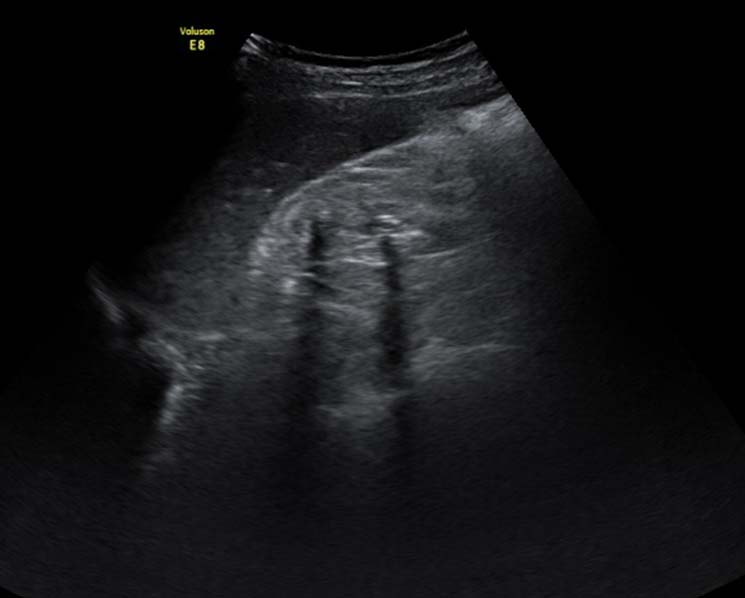
Grade 3- reduced renal length, cortical echogenicity is more than that of spleen, with poorly maintained cortico-medullary differentiation.
Renal length was measured in coronal plane, with patient in lateral position (left lateral position for right kidney and right lateral position for left kidney) with breath holding in midinspiration. A renal length of 9-11 cm was considered as normal [6]. After Sonography serum creatinine was evaluated and was compared with sonographic grading. The mean serum creatinine was 2.1(±1.03) mg / dl.
Results
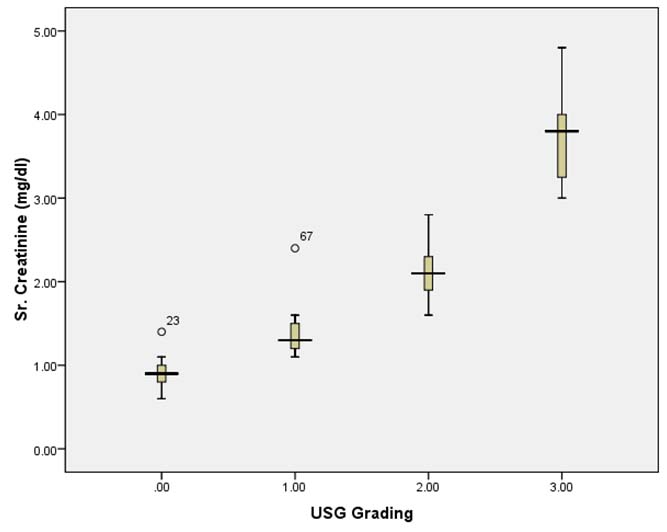
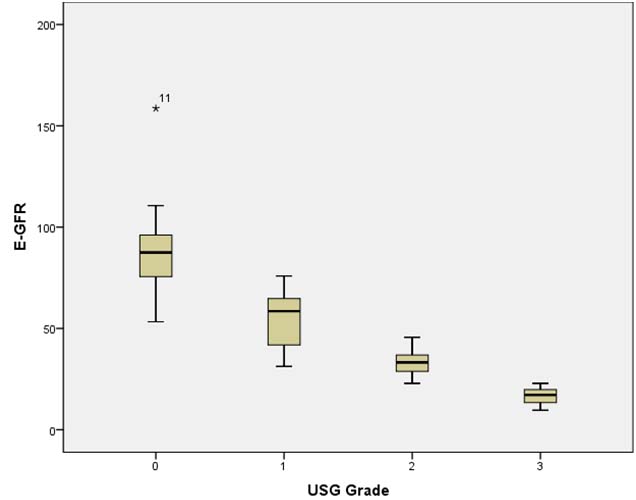
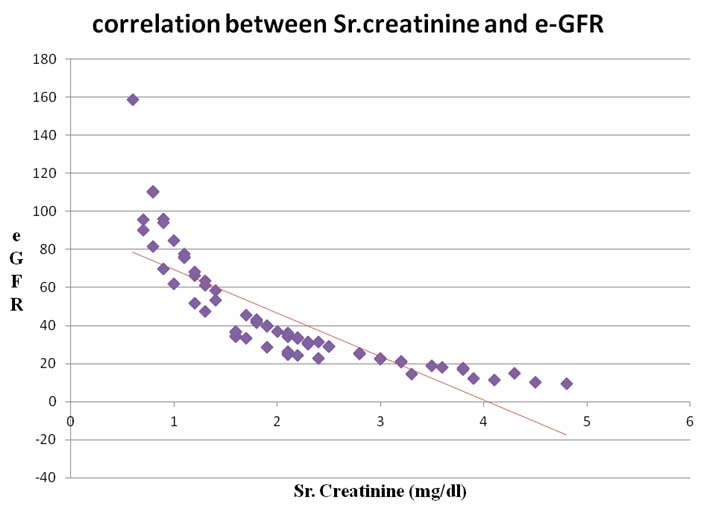
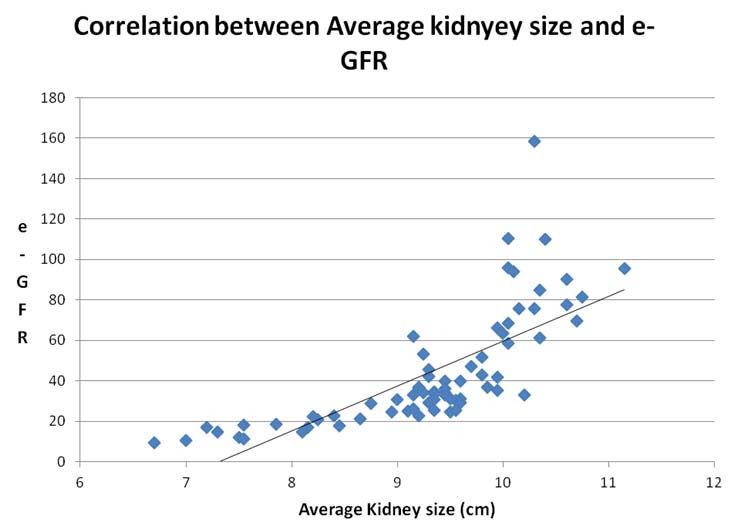
A total of 70 patients were our study participants, out of which 47 (67.1%) were males and 23 (32.9%) were females. The mean age of the study participants was 55.45 ± 8.35 years (range: 40-72 years) [Table/Fig-5]. There was no specific pattern of sonographic grading in different age groups. The findings were not gender dependent and the findings were the same in both sexes. On sonographic evaluation of our study participants; 14(20%) cases showed grade “0”,11(15.7%) cases showed grade “1”, 30(42.9%) cases showed grade “2” and15 (21.4%) cases showed grade “3” renal parenchymal changes. There was no change in grading of renal parenchymal changes between male and females or patients of different age groups. In our study, as the sonographic grading of renal parenchymal changes increased, the serum creatinine also increased in linear pattern [Table/Fig-6]. The tendency of the graph showed linear correlation between the sonographic grading of renal parenchymal changes and serum creatinine. A graph generated by plotting sonographic grading of renal parenchymal changes and eGFR. This graph shows an inverse relationship between the sonographic grading and eGFR [Table/Fig-7]. As the grading of renal parenchymal changes increased, the eGFR decreased. Similarly the serum creatinine had an inverse relationship with eGFR; i.e. as the serum creatinine increased, the eGFR decreased [Table/Fig-8]. The other finding we noted was a correlation between the kidney size and eGFR. As the average kidney size decreased, eGFR also decreased in linear pattern [Table/Fig-9]. Our study showed a linear correlation between sonographic grading of renal parenchymal changes with eGFR [Table/Fig-8].
Descriptive statistics of patients with bilateral medical renal disease (n=70).
| Parameter | Gender |
|---|
| Male (n=47) | Female (n=23) |
|---|
| Mean age (±SD) | 52.5±7.8 | 57.3± 9.3 |
| Mean kidney size (±SD) [cm] | 9.8±0.85 | 9.13±1.15 |
| Serum creatinine (±SD) [mg/dl] | 2.1±0.93 | 2.1±1.2 |
| eGFR (±SD) [ml/ min/1.73 m2] | 46.8±30.4 | 38.4±25.5 |
| Sonographic grading |
| 0 | 9 | 5 |
| I | 7 | 4 |
| II | 21 | 9 |
| III | 10 | 5 |
Correlation between ultrasonographic grading of renal parenchymal changes with serum creatinine.
Correlation between ultrasonographic grading of renal parenchymal changes with estimated glomerular filtration rate (eGFR).
Correlation between the serum creatinine and estimated glomerular filtration rate (eGFR).
Correlation between the average kidney sizes with estimated glomerular filtration rate (eGFR).
Discussion
Sonography is an important non-invasive investigating tool in evaluation of diseases of the kidney [7]. By grading the renal parenchymal changes, the severity of the disease can be assessed [8]. GFR is the most important indicator of renal function. By calculating eGFR using simple available MDRD formula, the reserved renal function and in turn the severity and prognosis of the patient can be evaluated [9]. Various studies have shown accuracy of sonography in assessing the renal parenchymal disease with good sensitivity, though less specificity [10]. Levey et al., have studied the role of eGFR in evaluating chronic kidney disease and in predicting prognosis. The eGFR is one of the important indicator of reseved renal function and the indicator of prognosis. Progressive declining eGFR is associated with higher morbidity and mortality [11]. In our study we attempted in comparing the sonographic grading of renal parenchymal changes, which is useful in initial evaluation of renal disease with the eGFR which is an indicator of reserved renal function and prognosis. We used two independent diagnostic tools to enhance the accuracy of renal assessment. In our study, the correlation between the sonographic grading and the eGFR showed that, increased grading was associated with decreased eGFR. Hence, Sonography can be well used as a preliminary investigating tool, as it is easily available, non-invasive and does not involve exposure to ionizing radiation. By considering eGFR and sonographic grading of renal parenchymal changes the accuracy of assessment of renal ruction will be increased.
Limitation
Neither sonography nor eGFR can point out the specific aetiology for compromised renal function.
Conclusion
eGFR is an important factor which can be used as a factor to predict prognosis in renal diseases. Sonography is a good non-invasive diagnostic tool for evaluation of renal disease. There is good correlation between the sonographic grading and eGFR using MDRD formula. We conclude that by evaluating the kidneys with Sonography and calculating eGFR using MDRD formula the renal status will be more accurately interpreted.
[1]. O’Neill WC, Sonographic evaluation of renal failureAm J Kidney Dis 2000 35(6):1021-38. [Google Scholar]
[2]. Page JE, Morgan SH, Eastwood JB, Smith SA, Webb DJ, Dilly SA, Ultrasound findings in renal parenchymal disease: comparison with histological appearancesClin Radiol 1994 49(12):867-70. [Google Scholar]
[3]. Jerums G, Ekinci E, Panagiotopoulos S, MacIsaac RJ, Early Glomerular Filtration Rate Loss as a Marker of Diabetic NephropathyEuropean Endocrinology 2012 8(1):27-31. [Google Scholar]
[4]. Levey AS, Bosch JP, Lewis JB, Greene T, Rogers N, Roth D, A more accurate method to estimate glomerular filtration rate from serum creatinine: a new prediction equation. Modification of Diet in Renal Disease Study GroupAn Intern Med 1999 130(6):461-70. [Google Scholar]
[5]. Siddappa JK, Singla S, Al Ameen M, Rakshith SC, Kumar N, Correlation of Ultrasonographic Parameters with Serum Creatinine in Chronic Kidney DiseaseJ Clin Imaging Sci 2013 3:28 [Google Scholar]
[6]. Brandt TD, Neiman HL, Dragowski MJ, Bulawa W, Claykamp G, Ultrasound assessment of normal renal dimensionsJ Ultrasound Med 1982 (12):49-52. [Google Scholar]
[7]. Kalantarinia K, Novel imaging techniques in acute kidney injuryCurr Drug Targets 2009 10(12):1184-89. [Google Scholar]
[8]. Page JE, Morgan SH, Eastwood JB, Smith SA, Webb DJ, Dilly SA, Ultrasound findings in renal parenchymal disease: comparison with histological appearancesClin Radiol 1994 49(12):867-70. [Google Scholar]
[9]. National Kidney FoundationBailie GR, Uhlig K, Levey AS, Clinical practice guidelines in nephrology. Evaluation, classification, and stratification of chronic kidney diseaseAm J Kidney Dis 2002 39(suppl 2):S1-266. [Google Scholar]
[10]. Huntington DK, Hill SC, Hill MC, Sonographic manifestations of medical renal diseaseSemin Ultrasound CT MR 1991 12:290-307. [Google Scholar]
[11]. Levey AS, Coresh J, Balk E, Kausz AT, Levin A, Steffes MW, National Kidney Foundation practice guidelines for chronic kidney disease: evaluation, classification, and stratificationAnn Intern Med 2003 139(2):1 [Google Scholar]