Assessment of Anthropometric Indices, Salt Intake and Physical Activity in the Aetiology of Prehypertension
Arsalan Moinuddin1, Rani Gupta2, Yogesh Saxena3
1 Assistant Professor, Department of Physiology, NIMS Medical College, Jaipur, Rajasthan, India.
2 Professor, Department of Physiology, Himalayan Institute of Medical Sciences, SRHU, Jollygrant, Dehradun, India.
3 Associate Professor, Department of Physiology, Himalayan Institute of Medical Sciences, SRHU, Jollygrant, Dehradun, India.
NAME, ADDRESS, E-MAIL ID OF THE CORRESPONDING AUTHOR: Dr. Arsalan Moinuddin, Assistant Professor, Department of Physiology, NIMS Medical College, Jaipur, Rajasthan-303121, India. E-mail : drarsalan.moinuddin@gmail.com
Introduction
Globally, prehypertension is responsible for approximately 62% of cardiovascular and 49% of ischemic heart disease (IHD) episodes. Current data from the Indian subcontinent suggests that prevalence of prehypertension was 47% amongst young urban residents. Considering its serious prognosis, the current study was undertaken to assess risk factors such as for cardiovascular diseases in prehypertensives adult males in Uttarakhand region.
Materials and Methods
This cross-sectional analytical study was conducted in the Department of Physiology, HIMS, Dehradun, over a period of 12 months. Volunteers (20-40 years) were divided into two groups; Group I (Controls): normotensives and Group II (Cases): prehypertensives based on JNC VII classification.
Results
Exercise capacity, determined by peak VO2 consumption was significantly lower in prehypertensive group than the normotensive group (p<0.001). Daily salt intake of pre-hypertensives was significantly greater than the normotensive subjects (p<0.001). Multiple Linear Regression analysis revealed that average baseline SBP increases by 0.34 mmHg for every 1 kg increase in weight and average baseline DBP increases by 0.25 mmHg for every 1 year increase in age.
Conclusion
Exercise capacity was found decreased in pre-hypertensives and they have high daily salt intake. Also, weight and age emerged as independent risk factors for SBP and DBP respectively.
BMI, 6MWT, Peak VO2, Prehypertensive
Introduction
Globally people suffering from hypertension are approximately 1 billion and it is responsible for 7.1 million deaths yearly. According to WHO, prehypertension is responsible for approximately 62% of cardiovascular and 49% of ischemic heart disease (IHD)episodes worldwide. Current data from the Indian subcontinent suggests that prevalence of prehypertension is approximately 47% amongst young urban residents [1,2]. Prehypertension is not a disease but an entity to identify individuals who are at high risk of developing hypertension. Joint National Committee (JNC VII) categorized prehypertensives as individuals with systolic pressure (120-139 mm Hg) and/or a diastolic pressure of (80-89 mm Hg) [3]. They are not the candidates for drug therapy but for lifestyle modifications [3]. Longitudinal data from Framingham Heart Study [2,4] have suggested that prehypertension is associated with more than twofold increase in relative risk from CVD as compared to normal individuals. The aetiology of progression from prehypertension to hypertension is multifactorial. It includes genetic predisposition and other environmental factors such as smoking, alcoholism, diet, physical activity, salt intake, stress, sedentary life style, and weight gain etc [5,6]. It is strongly suggested that the current consumption of salt (9-12g/day) is one of the major factors in increasing blood pressure and subsequently CVD. Many studies revealed that physical exercise reduces the incidence of coronary events by 80% [7] and a low level of physical fitness increases risk of CVD mortality [8]. Exercise capacity was a strong and independent predictor of the rate of progression from prehypertension to hypertension. When exercise capacity exceeded 8.5 METs, the protective effects of fitness were evident [9]. Considering the serious prognosis of pre hypertension, the current study was undertaken to assess risk factors such as for cardiovascular diseases in pre-hypertensive adult males in Uttarakhand region.
Materials and Methods
This cross-sectional analytical study was conducted in the Department of Physiology, Himalayan Institute of Medical Sciences (HIMS), Dehradun, over a period of 12 months. The sampling frame comprises of representative group of residents, employees and students of HIHT University. Ehical clearance from the institutional ethical committee was taken before the study. Sample size (n=44; each group) was calculated deploying the formula for comparing ‘difference of means between the groups’{α=0.05, power (β) = 80% and effective size (es) = 0.6} which gavea sample size of n=44 [10]. Volunteers (20-40 years) were selected from the aforementioned sampling frame based on the JNC VII criteria and were divided into two groups; Group I (Controls): normotensive and clinically healthy volunteers and Group II (Cases): pre-hypertensive and clinically healthy volunteers. Exclusion criteria included history of diabetes mellitus, endocrine disorders, renal diseases, and diagnosed CVD. Written informed consent was taken from the volunteers before ascertainment of study protocol. They were asked to report in the department around 9:00 am without heavy meals and preferably after a good sleep. Initially, relevant medical history was taken which was followed by the assessment of anthropometric parameters of height, weight, waist and hip circumference. Six minute walk test (6MWT) was then performed for the assessment of exercise capacity. A measured corridor course was used for walking. Subjects were instructed to walk from one end to the other at their own pace attempting to cover as much distance as possible in the allotted 6 minutes time. The walk was timed (6 minutes) and distance travelled in six minutes was recorded in meters. The subjects were allowed to stop and rest if necessary but were encouraged to proceed with the walk on recovery. Exercise capacity was then determined by calculating Work Done and Mean Peak VO2 from the below mentioned formulae [11]; Work Done (Kg/m) = Distance travelled (m) x Body weight (Kg) and Mean Peak VO2(ml / kg /min) = 4.948 + 0.023 x Mean 6MWD (m)[12]. Salt intake (grams/day) was calculated as daily sodium intake in food using a food frequency questionnaire (FFQ). The questionnaire was tailored as per the regional dietary habits and grouping of food on the basis of similarity profile. Value of sodium intake was calculated from the dietary record on the basis of cooked food (National Institute of Nutrition) [13] or total no. of packets of salt consumed per month in the family (converted into per day). Composition of top up salt (table salt) per head in the family per day and published recipes for readymade food (wrapped up items) was also taken into account to limit calculation error.
Statistical Analysis
Statistical Analysis was done using SPSS (Statistical Package for the Social Sciences, version 17). The parameters analysed were anthropometric parameters, exercise capacity and salt intake. Independent two sample t-test was used for comparing the means for the above mentioned parameters between the normotensives and pre hypertensives. Pearson correlation was used to study the correlation between the above mentioned parameters. Multiple linear regression analysis was done to evaluate the predictor of baseline SBP after adjusting the effect of age, BMI, WHR, ΔDBP and Peak VO2.
Results
Risk Factor Analysis of our results showed that the demographic and anthropometric parameters of age, weight, height, BMI and WHR were found higher in pre-hypertensive group as compared to normotensive groups but this difference between the groups was statistically non-significant (p>0.05). Exercise capacity as determined by peak VO2 consumption was significantly lower in pre-hypertensive group than the normotensive group (p<0.001). Daily salt intake of pre-hypertensives was significantly greater than the normotensive subjects (p<0.001). Multiple Linear Regression analysis reveals that average baseline SBP increases by 0.34 mmHg for every 1 kg increase in weight and average baseline DBP increases by 0.25 mmHg for every 1 year increase in age.
[Table/Fig-1] shows a slight increase in weight, BMI and WHR among pre-hypertensives as compared to normotensives but this difference observed between the two groups was non-significant (p>0.05). But the cardiovascular parameters i.e. pulse rate, systolic blood pressure and diastolic blood pressure were found significantly higher in pre-hypertensives as compared to normotensive (p<0.001). [Table/Fig-2] compares the exercise capacity parameters and salt in take between normotensives and pre-hypertensives. In pre-hypertensives, the distance covered in 6 minutes, total amount of work done in walking 6 minutes and peak VO2 consumption during the test was significantly reducedas compared to normotensives (p<0.001). Also, the daily salt in take of pre-hypertensives was significantly greater than the normotensives, 21.18±1.18 gm/day (Na+= 8.43±0.47 gm/day) and 9.00±0.48gm/day (Na+=3.60±0.19 gm/day) respectively (p<0.001). [Table/Fig-3] shows correlations of age, weight, BMI, WHR, ΔDBP and peak VO2 with each other among pre-hypertensives. Peak VO2 exhibited significant negative correlation with anthropometric variables i.e. Age (r = -0.54, p <0.001), Weight (r = - 0.44, p <0.001) and BMI (r = - 0.46, P < 0.001). Also, there was a significant positive correlation between weight and BMI (r = 0.90, p<0.001).
Comparative demographic, anthropometric and cardiovascular parameters among normotensives & pre hypertensives.
| S. No | Parameter | Group I (Normotensives) | ASIA grade B |
|---|
| 1. | Age (Years) | 34.11±5.69 | 33.55±5.98 |
| 2. | Weight (Kg) | 62.25±8.31 | 63.32±12.59 |
| 3. | Height (cm) | 166.39±9.98 | 167.23±6.99 |
| 4. | BMI (Kg/m2) | 22.50±2.96 | 22.68±4.38 |
| 5. | WHR | 0.90±0.06 | 0.91±0.44 |
| 6. | Resting PR (beats/min) | 74.93 ± 7.10 | 86.16 ± 10.63*** |
| 7. | Baseline SBP (mmHg) | 106.23 ± 8.19 | 124.86 ± 8.28*** |
| 8. | Baseline DBP (mmHg) | 71.55 ± 5.54 | 83.18 ± 4.87*** |
Data presented as mean±SE; * mark indicates comparison b/w group I & II; *p < 0.05; **p < 0.01; ***p < 0.001, BMI: Body Mass Index, WHR: Waist Hip Ratio, SBP: Systolic Blood Pressure, DBP: Diastolic Blood Pressure
Comparative exercise capacity parameters (6MWT) and salt intake among normotensives & pre-hypertensives.
| S. No | Parameter | Group I (Normotensives)n = 44 | Group II (Pre-hypertensives)n = 44 |
|---|
| 1. | Mean 6MWT distance (m) | 679.36 ± 9.01 | 615.75 ± 12.11*** |
| 2. | Work Done (Kcal/min) | 16.16 ± 0.33 | 14.78 ± 0.40** |
| 3. | Peak VO2 (ml/kg/min) | 20.57 ± 0.21 | 19.11 ± 0.28*** |
| 4. | Salt Intake(gm/day) | 9.00 ± 0.48 | 21.18 ± 1.18*** |
| 5. | Na+ (gm/day) | 3.60 ± 0.19 | 8.43 ± 0.47*** |
Data presented as mean ± SE; * mark indicates comparison b/w group I & II*P < 0.05; **P < 0.01; ***P < 0.001
Correlation of age, weight, BMI, WHR, ΔDBP and peak VO2 with each other among pre-hypertensives.
| Parameter | Age | Weight | BMI | WHR | ΔDBP | Peak VO2 |
|---|
| Age | - | r =0.15 | r =0.12 | r =-0.21 | r =-0.17 | r =-0.54*** |
| Weight | - | - | r =0.91*** | r =0.09 | r =-0.01 | r =-0.44*** |
| BMI | - | - | - | r =0.08 | r =-0.02 | r =-0.46*** |
| WHR | - | - | - | - | r =-0.17 | r =0.12 |
| ΔDBP | - | - | - | - | - | r =0.11 |
| peak VO2 | - | - | - | - | - | - |
Data was analysed using ‘Pearson’ correlation; ‘r’ representing Pearson’ correlation coefficient; *p < 0.05; **p < 0.01; ***p < 0.001
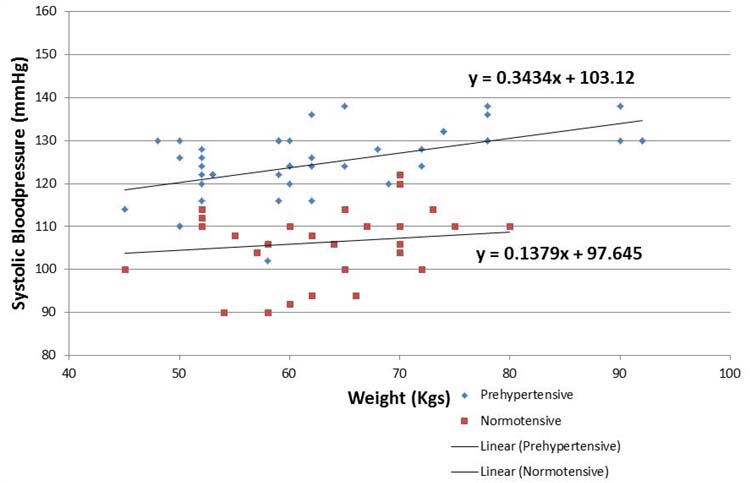
[Table/Fig-4] compares dependency of systolic blood pressure on weight between pre-hypertensives and normotensives using multiple linear regression analysis. Among pre-hypertensives, the slope of best fitted regression line ‘β’ was estimated as 0.34 which means that average baseline systolic blood pressure increases by 0.34 mmHg for every 1 kg increase in weight. As for normotensives, the slope of best fitted regression line ‘β’ was estimated as 0.13 which means that average baseline systolic blood pressure increases by 0.14 mmHg for every 1 kg increase in weight. Thus, the increased steepness of the slope and difference in the aforementioned β coefficient value suggests that weight acts as an independent predictor for increase in baseline systolic blood pressure among pre-hypertensives. Similarly, average baseline DBP increases by 0.25 mmHg for every 1 year increase in age.
Multiple linear regression analysis for bsbp and weight.
Discussion
The current study investigating the risk factors associated with raised blood pressure in pre-hypertensive young adult male population revealed higher weight, BMI and WHR in pre-hypertensives as compared to normotensives. Bracho M et al., conducted a prospective randomized control study on 3167 patients and evaluated the role of anthropometric measures as predictors of prehypertension. They found significant higher measurements of weight, body mass index, hip circumference, waist circumference and hip waist index (p<0.001) among pre-hypertensives with BMI being the strongest predictor of prehypertension [14]. This argument is further supported by Carmem Cristina Beck et al., which determined predictive power of anthropometric indicators as discriminators of high blood pressure. They suggested waist circumference as a predictor of high blood pressure (above 95th percentile), especially in adolescents [15]. Multiple Linear Regression analysis of our results showed a rise of 0.3 mmHg in baseline systolic blood pressure and 0.3 mmHg increase in baseline diastolic blood pressure with every 1 kilogram increase in weight. This pertains to the classic Framingham Study which found10% rise in body weight with an overall 7 mmHg increase in SBP [16]. And, every kilogram excess body weight loss was associated with a decline of 0.3 mmHg and 0.4 mmHg in SBP and DBP, respectively [17]. In Egypt, blood pressure of 5534 subjects were studied by Azza Mohamed Sarry El-Din et al., in relation to obesity and found that percentages of hypertensive individuals increased with age and degree of obesity emerged as an important risk factor for hypertension [18]. The above mentioned factors cause adjustments in renal and cardiovascular functions such as blunted reflex response of heart rate and lumbar sympathetic nerve activity to volume expansion and thus, enhancing afferent arteriolar reactivity to angiotensin II and catecholamines. These adjustments play a key role in both initiation and maintenance of blood pressure [5,6].
Previously, ample evidence suggests that excess salt intake is positively associated with elevated blood pressure and it can be lowered with reductions in dietary salt [19]. In our study, daily salt intake of prehypertensives (21.2±1.2 gm/day) was significantly greater than normotensive subjects (9.0±0.5 gm/day); p<0.001. This is in close coherence to a study conducted in the hilly population of Tehri Garhwal by Saxena P et al., which found that 22% of hypertensive population was consuming salt > 8gm/day and 9% between 6-8gm/day [20]. Our values of salt consumption are on a higher side as per World Health Organization (WHO) salt intake guidelines [21] and can probably be explained on the basis of sample population which mostly included subjects consuming junk food. A meta-analysis by Altun B and Arici Memphasized that salt reduction is associated with 1–5.5 mmHg reduction in SBP with more profound reductions (1.5–6 mmHg) observed in hypertensives [22]. In yet another community trial in Portugal, a salt intake reduction from 21g/day to 12 g/day was associated with a significant decline in blood pressure (13 mmHg in systolic blood pressure and 6 mmHg in diastolic blood pressure) [23]. Excess salt intake poses greater challenge for kidneys to excrete it, failure of which leads to a rise in blood pressure [24]. It is worth mentioning that kidney’s capacity to excrete sodium declines with age and thus small increase in salt intake inducesgreater arterial pressure [25]. This can be in part due to an accelerated fall in glomerular filtration rate (GFR) with age which begins around the age of 30 years and declines to almost 40% at 80 years and also due to attenuation in the number of functioning nephrons. As there is no reduction in salt consumption with age, sodium balance is maintained by increasing fractional excretion of sodium by increased ANP and decreased angiotensin and aldosterone [26]. Thus, owing to these involutional and structural changes in kidney, sodium retention happens once salt consumption exceeds the compensatory mechanism of sodium excretion.
Relationship between physical fitness (maximal oxygen uptake VO2max) and incidence of hypertension was known for quite some time. The Six-Minute Walk Test (6 MWT) is an inexpensive, quick, and a well-tolerated method of assessing physical fitness by measuring functional exercise capacity [12]. In our study, we found peak VO2 consumption significantly lower in pre-hypertensive (19.1±0.3 ml/kg/min) than in normotensive group (20.6±0.2 ml/kg/min) (p<0.001). We have also calculated the work done as product of distance and body weight to estimate functional exercise capacity and found that the total amount of work done in walking 6 minutes by the pre-hypertensive group (14.8 ± 0.4Kcal/min) was significantly lower than the normotensive group (16.2±0.3Kcal/min; p<0.001). This is in concert with a five year prospective Japanese study by Sawada S et al., who enrolled 3305 normotensive subjects and used VO2 max to assess their fitness levels. After 5 years of follow up, relative risk of hypertension (425 subjects) was found to be 1.9 times higher in the least fit group compared with the fittest group thus concluding that low VO2 max level is related to higher hypertension incidence and an improved VO2 max will perhaps prevent development of hypertension [27].
Limitations
Limitations of our study include that we have to rely on the subjects about quantification of salt consumption. Also, for the assessment of salt intake, owing to feasibility criteria we have used 24 hours recall questionnaire instead of the conventional 1 week diet intake chart.
Conclusion
It enlightens some of the modifiable risk factors in pre-hypertensives and in future if performed more systematically will surely identify risk modifiers and predict individual therapeutic benefits.
Data presented as mean±SE; * mark indicates comparison b/w group I & II; *p < 0.05; **p < 0.01; ***p < 0.001, BMI: Body Mass Index, WHR: Waist Hip Ratio, SBP: Systolic Blood Pressure, DBP: Diastolic Blood Pressure
Data presented as mean ± SE; * mark indicates comparison b/w group I & II*P < 0.05; **P < 0.01; ***P < 0.001
Data was analysed using ‘Pearson’ correlation; ‘r’ representing Pearson’ correlation coefficient; *p < 0.05; **p < 0.01; ***p < 0.001
[1]. Yadav S, Boddula R, Genitta G, Bhatia V, Bansal B, Kongara S, Prevalence & risk factors of pre-hypertension & hypertension in an affluent north Indian populationIndian J Med Res 2008 128(6):712-20. [Google Scholar]
[2]. Vasan RS, Larson MG, Leip EP, Kannel WB, Levy D, Assessment of frequency of progression to hypertension in non-hypertensive participants in the FraminghamHeart Study: a cohort studyLancet 2001 358:1682-86. [Google Scholar]
[3]. The Seventh Report of the Joint National Committee on Prevention, Detection, Evaluation, and Treatment of High Blood Pressure: the JNC 7 report. http://www.nhlbi.nih.gov/guidelines/hypertension/jnc7full.pdf/ Accessed 2nd October 2011 [Google Scholar]
[4]. Pitzalis MV, Iacoviello M, Massari F, Guida P, Romito R, Forleo C, Influence of gender and family history of hypertension on autonomic control of heart rate, diastolic function and brain natriuretic peptideJ Hypertens 2001 19(1):143-48. [Google Scholar]
[5]. Dogru MT, Simsek V, Sahin O, Ozer N, Differences in autonomic activity in individuals with optimal, normal, and high-normal blood pressure levelsTurk KardiyolDernArs 2010 38(3):182-88. [Google Scholar]
[6]. Pal GK, Pal P, Nanda N, Lalitha V, Dutta TK, Adithan C, Sympathovagal imbalance in young prehypertensives: Importance of male-female differenceAm J Med Sci 2013 345(1):10-17. [Google Scholar]
[7]. Manson JE, Hu FB, Rich-Edwards JW, A prospective study of walking as compared with vigorous exercise in the prevention of coronary heart disease in womenN Engl J Med 1999 341(9):650-58. [Google Scholar]
[8]. Blair SN, Kohl HW III, Barlow CE, Paffenbarger RS, Gibbons LW, Macera CA, Changes in physical fitness and all-cause mortality. A prospective study of healthy and unhealthy menJAMA 1995 273(14):1093-98. [Google Scholar]
[9]. Faselis C, Doumas M, Kokkinos JP, Panagiotakos D, Kheirbek R, Sheriff HM, Exercise capacity and progression from prehypertension to hypertensionHypertension 2012 60(2):333-38. [Google Scholar]
[10]. Cohen J, Statistical power analysis for the behavioral sciences 1988 2nd edLondonLawrence Erlbaum Associates, Pubishers:550 [Google Scholar]
[11]. Enright PL, The Six-Minute Walk TestRespiratory Care 2003 48(8):783-85. [Google Scholar]
[12]. Carter R, Holiday DB, Nwasuruba C, Stocks J, Grothues C, Tiep B, 6-minute walk work for assessment of functional capacity in patients with COPDChest 2003 123(5):1408-15. [Google Scholar]
[13]. Gopalan G, Rama BV, Balasubramanian S C, Nutritive value of Indian foods 1989 1st edHyderabadNational Institute of Nutrition:68-73. [Google Scholar]
[14]. Bracho M, Esis C, Silva E, Villasmil J, Gonzalez A, Bermudez G, Anthropometric measures as predictors of prehypertension in AdolescentsJournal of Hypertension 2010 28:e479-80. [Google Scholar]
[15]. Beck CC, Lopes Ada S, Pitanga FJ, Anthropometric indicators as predictors of high blood pressure in adolescentsArq Bras Cardiol 2011 96(2):126-33. [Google Scholar]
[16]. Ashley FW, Kanne WB, Relation of weight change to changes in atherogenic traits. The Framinghan StudyJ Chronica Dis 1974 27:103-04. [Google Scholar]
[17]. Stevens VJ, Corrigan SA, Obarzanek E, Bernauer E, Cook NR, Hebert P, Weight loss Intervention in phase 1 of the trials of hypertension preventionArch Intern Med 1993 153(7):849-58. [Google Scholar]
[18]. El-Din AMS, Erfan M, Kandeel WA, Kamal S, El-Banna RAE, Fouad WA, Prevalence of Pre hypertension and Hypertension in a sample of Egyptian Adults and its Relation to ObesityAustralian Journal of Basic and Applied Sciences 2012 6(13):481-89. [Google Scholar]
[19]. Meneton P, Jeunemaitre X, de Wardener HE, MacGregor GA, Links between dietary salt intake, renal salt handling, blood pressure, and cardiovascular diseasesPhysiol Rev 2005 85(2):679-715. [Google Scholar]
[20]. Saxena P, Saxena V, Saxena Y, Bio-social factors associated with hypertension in hilly population of Tehri GarhwalIndian Journal of community health 2011 23(2):81-3. [Google Scholar]
[21]. World Health Organization (WHO). Guidelines: Sodium intake for adults and children. http://www.who.int/nutrition/publications/guidelines/sodium_intake_printversion.pdf. Accessed 10th August 2013 [Google Scholar]
[22]. Altun B, Arici M, Salt and blood pressure: time to challengeCardiology 2006 105:9-16. [Google Scholar]
[23]. Forte JG, Miguel JM, Miguel MJ, de Padua F, Rose G, Salt and blood pressure: a community trialJ Hum Hypertens 1989 3:179-84. [Google Scholar]
[24]. He FJ, MacGregor GA, A comprehensive review on salt and health and current experience of worldwide salt reduction programmesJ Hum Hypertens 2009 23(6):363-84. [Google Scholar]
[25]. Lindeman RD, Tobin JD, Shock NW, Association between blood pressure and the rate of decline in renal function with ageKidney Int 1984 26:861-68. [Google Scholar]
[26]. Kasiske BL, Relationship between vascular disease and age-associated changes in the human kidneyKidney Int 1987 31:1153-59. [Google Scholar]
[27]. Sawada S, Tanaka H, Funakoshi M, Shindo M, Kono S, Ishiko T, Five year prospective study on blood pressure and maximal oxygen uptakeClinExpPharmacol Physiol 1993 20(7-8):483-87. [Google Scholar]