Cirrhosis, is defined as an abnormal liver pathology in which there is diffuse irreversible scarring of the liver parenchyma and replacement by structurally abnormal nodules” [1]. The scoring system used for predicting the cirrhosis was first introduced by Child and Turcotte in 1964 and later revised by Pugh in 1974 [2–5]. Cirrhosis is by far the most common cause of intrahepatic portal hypertension. Portal venous pressure is the blood pressure in the hepatic portal vein and the normal portal vein pressure is 5-10 mmHg. Portal hypertension is defined by HVPG more than 5mmHg, splenic vein pressure greater than 15mmHg, or portal vein pressure (measured surgically) greater than 10mmHg (30 cm water) [2,5]. Portal hypertension can lead to the development of oesophageal varices that are at risk of rupture.
Colour Doppler ultrasound of the hepatic veins has emerged as a non-invasive technique for the diagnosis of portal hypertension and to predict oesophageal varices. The normal hepatic vein waveform is triphasic-retrograde A wave and antegrade S and D waves [Table/Fig-3]. Hepatic vein waveform (HVW) is classified into 3 types - Triphasic: normal pattern, Biphasic: no reversed flow and with or without decreased phasic oscillation and Monophasic: flat waveform [9–11]. Biphasic and monophasic HVW are associated with severe portal hypertension [9–11]. Damping of the hepatic veins is indicative of cirrhosis. Also, hepatic venous waveform and splenoportal index can be used as a useful non-invasive index to predict the presence of oesophageal varices [12].
The aim of the study was to evaluate hepatic venous waveform, damping index, splenoportal index in patients of cirrhosis on Doppler ultrasound, also predict severity of portal hypertension and presence of oesophageal varices.
Materials and Methods
This was a prospective study conducted in the Department of Radiodiagnosis in collaboration with Department of Medicine, VMMC & Safdarjung Hospital, New Delhi, India, between August 2012 to December 2013. Institute ethical clearance committee approval was obtained for the study. Thirty patients of chronic liver disease were included in the study after obtaining an informed consent. Patients with co-existent cardiac or respiratory disease, hepatocellular carcinoma, non cirrhotic portal fibrosis, acute variceal haemorrhage, past history of endoscopic variceal ligation/sclerotherapy were excluded from the study. The patients then underwent gray-scale and colour Doppler Ultrasound examination, Contrast-enhanced Computed Tomography scan (CT) if renal function tests were normal else endoscopy when the renal function tests were deranged. The procedures (invasive and non-invasive) were as per requirements of the treatment procedure.
Based on the clinical (ascites and hepatic encephalopathy) and laboratory parameters (serum bilirubin, serum albumin, and prothrombin time) the patients were divided into three classes namely Child Pugh’s A,B and C according to Child Pugh’s classification [4,5].
Gray scale and Colour Doppler Ultrasound: Ultrasound examination was performed on Philips HD 11XE ultrasound machine using both convex 2-5 and linear 3-12MHz transducers. Patients were sonographically evaluated on gray scale ultrasound for hepatic echotexture, nodularity, hypertrophied caudate lobe, ascites and splenomegaly. Colour Doppler of hepatic veins was done. To trace the hepatic veins, the 2-5 MHz convex probe was placed in the right intercostal space. Hepatic venous blood flows was recorded for more than 5 seconds at the end of normal expiration or in quiet respiration by using a 2-5 MHz transducer with Doppler capability. Doppler waveforms were taken from the right hepatic vein. Middle hepatic vein readings were taken when the right hepatic vein was not well-visualized. Minimum of three recordings were taken and the data considered for analysis was the mean of the readings. The hepatic vein Doppler waveform was classified as triphasic, biphasic or monophasic depending upon the phasicity observed [9–11]. Damping index (DI) was calculated as minimum velocity/maximum velocity of hepatic venous waveform. Damping index > 0.6 was considered significant for portal hypertension. Thereafter, portal vein was assessed using right intercostal approach with subject supine during quiet respiration. Portal vein was longitudinally scanned. Doppler sampling cursor was placed in the middle of trunk with sample width covering approximately half the lumen. The portal vein was assessed for size, respiratory phasicity, flow direction and velocity. The mean portal venous velocity (PVV) in cm/second was recorded. Splenoportal index was calculated in cm/second with the following formula: SPI= SI/ PVV mean (where SI denotes the splenic index, which is a product of maximum transverse and vertical diameter of spleen in centimetres and PVVmean is the mean portal vein velocity). Presence of portosystemic collaterals were assessed by colour Doppler at the gastroesophageal junction (oesophageal varices), splenic hilum, ligamentum teres (recanalized umbilical vein) and in gallbladder fossa.
Computed Tomography (CT): Contrast-enhanced computed tomography of upper abdomen was performed on Philips
Brilliance 40-slice after injecting 100 ml of contrast material (iodine concentration, 370 mg/mL). Biphasic CT images were obtained during the arterial and portal venous phase with 25 and 50-70 seconds delay respectively after injectingthe contrast.
Interpretation of CT: The CT images were reviewed for the liver size, nodularity, any arterial enhancing lesion and oesophageal varices. Presence of discrete enhancing nodular lesions or ill defined enhancing nodular lesions abutting the luminal surface of the oesophageal wall or protruding into luminal space was considered oesophageal varices.
Image analysis (Ultrasound and CT): Ultrasound and CT images were analyzed by three experienced radiologists (Radiologist 1 (N.K.) with 3 years, Radiologist 2 (B.S.) with 7 years, Radiologist 3 (M.K.M) with 25 years of experience in interpreting Doppler Ultrasound and CT scan images. Final conclusion on the findings was made by means of consensus.
Endoscopy: Upper GI Endoscopy was done by an experienced gastroenterologist at another tertiary care teaching hospital to look for oesophageal varices due to resource constraints at our hospital. Ethical clearance was taken for the same. Patients were informed in advance and due consent was taken before the procedure. Endoscopy was done in only those cases in which the renal function tests were deranged.
Statistical Analysis
Descriptive statistics was used to quantitatively describe the frequency of various features observed in our study population. Chi-square and Pearson correlation test was used to study the significant difference and correlation between the variables.
Results
A total of 30 patients (22 males and 8 females) were enrolled in the study. The age group and severity of cirrhosis is summarized in [Table/Fig-4]. Twenty three patients were found in class C, six patients were in class B and only one patient was in class A.
Age wise distribution of patients with severity of cirrhosis (N = 30).
| Age Group | Statistics | Child Pugh’s Class | Total |
|---|
| A | B | C |
|---|
| 26-35 years | n | 0 | 1 | 10 | 11 |
| % | 0% | 16.7% | 43.5% | 36.7% |
| 36-45 years | n | 0 | 2 | 11 | 13 |
| % | 0% | 33.3% | 47.8% | 43.3% |
| 46-56 years | n | 1 | 3 | 2 | 6 |
| % | 100% | 50.% | 8.7% | 20.0% |
| Total | n | 1 | 6 | 23 | 30 |
n=number of patients
Twenty eight patients presented with ascites, out of which 15 (50%) had poorly controlled ascites. All these patients were noted majorly in class Child Pugh’s class C. Only three (10%) patients with cirrhosis had hepatic encephalopathy and all were in class C. Fourteen patients with cirrhosis had S. bilirubin more than 3 mg/dl whereas 11(36.7%) patients with cirrhosis were found with S. bilirubin less than 2 mg/dl. 19 (63.3%) patients had serum albumin less than 3 g/dl and all patients were in class C. Eight (26.7%) patients were found with serum albumin between 3 to 3.5 g/dl, where 4 patients were in class B and 4 patients were in class C. Only 3 (10%) patients had serum albumin levels more than 3.5 g/dl, two patients were in class B and one patient was in class A. 27 (90.0%) patients had prothrombin time >6 sec. Out of these 27 patients, 22 patients were in class C and 5 patients were in class B. Three (10.0%) patients had prothrombin time of 4-6 sec.
On gray-scale Ultrasound examination, 24 (80.0%) patients had splenomegaly whereas splenomegaly was not seen in 6 (20.0%) patients. Splenomegaly was seen in 1,4 and 19 cases of Child Pugh’s class A, B and C respectively. In 4 patients of class C and 2 of class B, splenomegaly was not seen. Among 30 patients, 22 (73.3%) patients had monophasic waveform. Biphasic and triphasic waveforms were seen in 4 (13.3%) cases. Twenty two patients (73.3%) had monophasic waveforms and majority of them were in class C. Four patients (13.3%) had biphasic waveform in which two were from class B and two were from class C. Remaining 4 patients had triphasic waveforms where one belonged to class A, 2 found in class B and one was in Class C. So, as the severity of the liver dysfunction increases, as evidenced clinically by Child Pugh’s scoring system, change in the hepatic vein waveform was observed from normal pattern of triphasic to biphasic and/or monophasic. This distribution of hepatic vein waveform was statistically significantly with the Child Pugh’s class (p<0.05). The same has been illustrated in [Table/Fig-5]. Twenty patients (66.7%) had value of Damping index more than >0.6 where majority of patients (18) belonged to class C and 2 in class B. Ten patients (33.3%) had Damping index ≤0.6; 5 were from class C, 4 were from class B and 1 was from class A. There was a positive correlation between Child Pugh’s total score and Damping index (r = 0.614; p<0.05). Splenoportal Index (SPI) was between 4-8 cm/sec in 11 (36.7%) cases. 10 (33.3%) patients had SPI value between 8.1-12.0 cm/sec and 9 patients (30.0%) had SPI value >12.0 cm/sec. There was weak positive correlation between splenoportal index and Child Pugh’s score (r = 0.269; p=0.15) [Table/Fig-6,7 and 8].
Hepatic venous waveforms according to Child Pugh’s class.
| HVD Findings | Statistics | Child Pugh’s Class | Total |
|---|
| A | B | C |
|---|
| Monophasic | n | 0 | 2 | 20 | 22 |
| % | 0% | 33.3% | 87.0% | 73.3% |
| Biphasic | n | 0 | 2 | 2 | 4 |
| % | 0% | 33.3% | 8.7% | 13.3% |
| Triphasic | n | 1 | 2 | 1 | 4 |
| % | 100% | 33.3% | 4.3% | 13.3% |
| Total | n | 1 | 6 | 23 | 30 |
Chi-square=13.75, p<0.05; n= number of patients
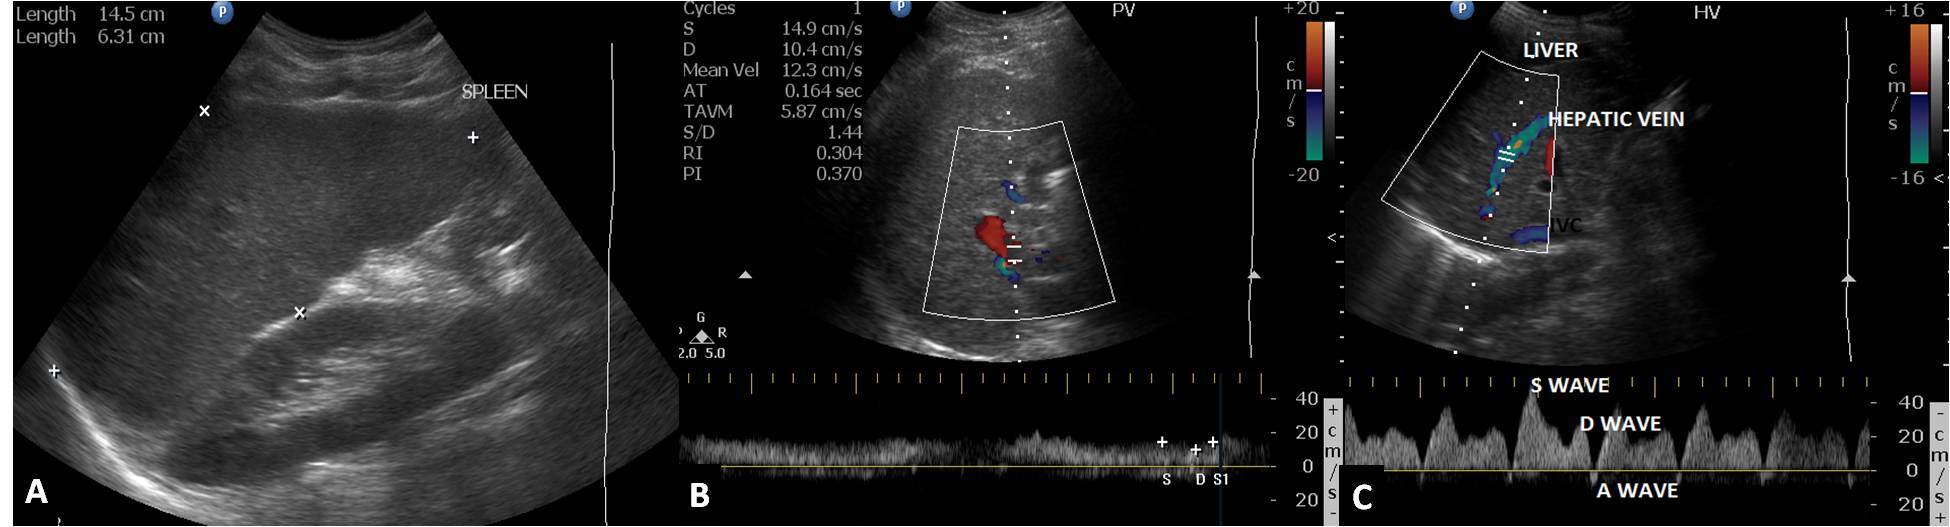
A 49-year-old female diagnosed case of cirrhosis Class A, shows (A) splenomegaly with splenic index measuring 91.3cm2 (B) Colour Doppler of the portal vein showing hepatopetal flow with loss of respiratory phasicity and mean portal velocity of 12.3cm/sec (C) Doppler ultrasound of the hepatic vein showing normal triphasic waveform.
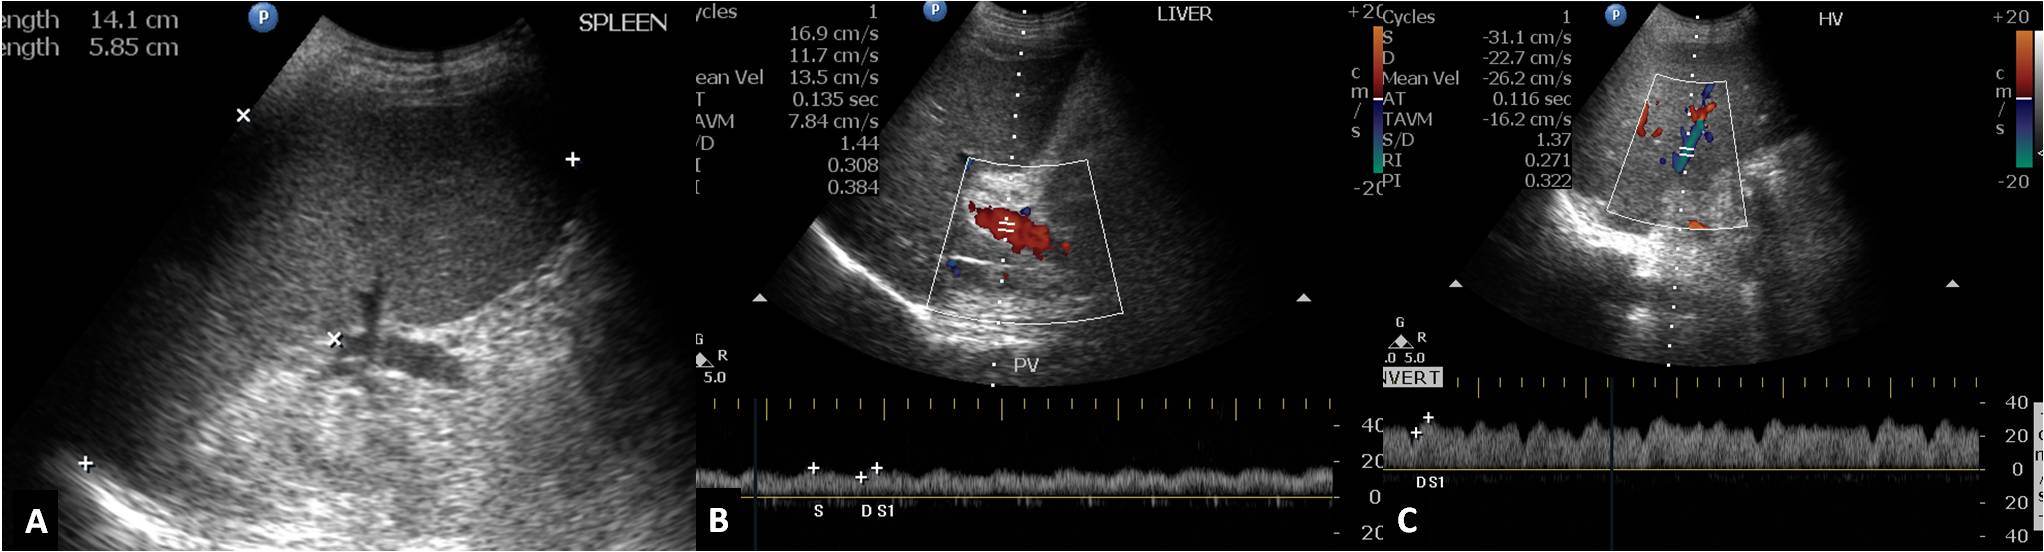
A 47-year-old male known alcoholic with chronic liver disease and portal hypertension classified in Class B (A) Splenomegaly with splenic index 82.3 (B) Hepatopetal flow in the portal vein with maintained phasicity and mean portal vein velocity 13.5cm/sec (C) Biphasic hepatic venous waveform with damping index measuring 0.7 (22.7/31.1).
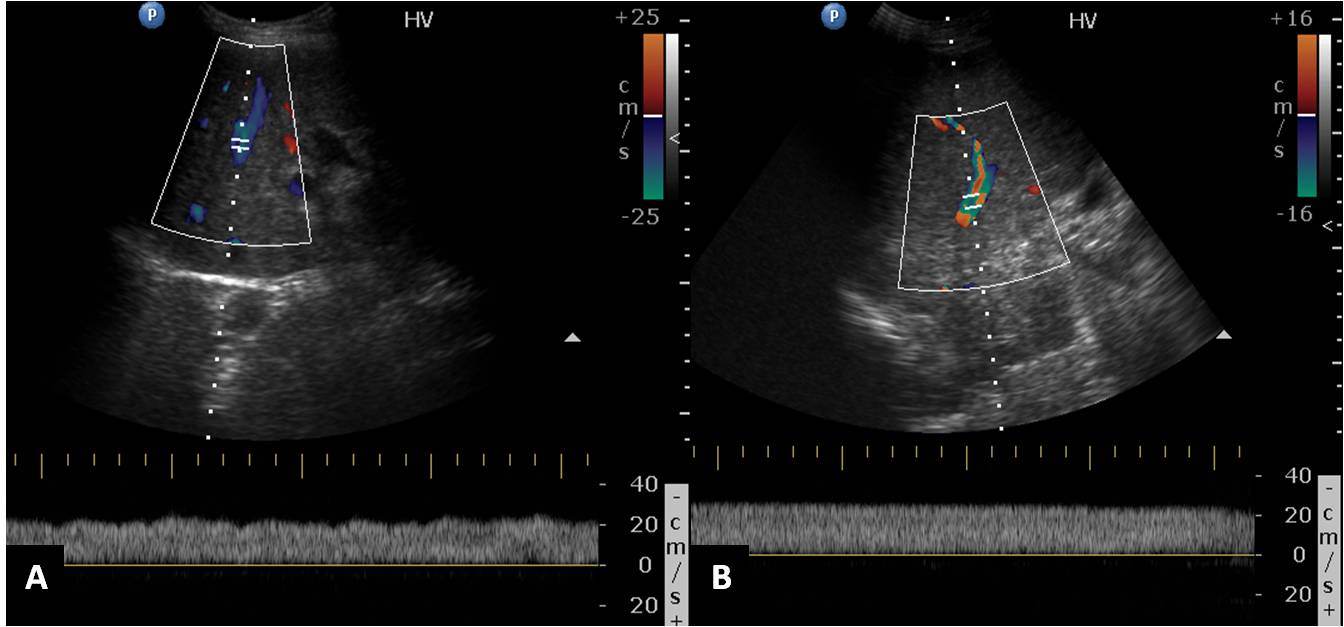
A 45-year-old female diagnosed case of chronic liver disease with portal hypertension classified in Class C (A,B) Doppler ultrasound of right hepatic vein showing monophasic waveform.
Fifteen (50%) cases had oesophageal varices either on CT scan or endoscopy, 13 patients (56.5%) in class C and 2 patients (33.3%) in class B. Rest of the 15 patients did not have oesophageal varices neither on CT scan nor on endoscopy. The association between oesophageal varices and Child Pugh’s class was not significant (p=0.36) in our study. The mean Child Pugh’s score was 11.87± 2.03 in patients with oesophageal varices while in the patients without oesophageal varices the mean Child Pugh’s score was 10.47 ±2.06. This difference was not statistically significant. Out of 15 patients with oesophageal varices, 13 patient (86.7%) had monophasic waveform, 1 patient (6.7%) had biphasic and triphasic waveform each. Nine patients (60%) who had monophasic waveform had no oesophageal varices. This association between hepatic vein waveform and presence of oesophageal varices was not statistically significant. Damping Index was 0.77±0.16 in patients with oesophageal varices whereas it was 0.64±0 25 in patients with no oesophageal varices. This difference was statistically non-significant. In patients with oesophageal varices, the mean SPI value was 12.08±6.15 whereas in patients without oesophageal varices the mean SPI value was 9.03± 4.30. This difference was statistically non-significant. Nineteen patients (63.3%) had no other collaterals, whereas 6 patients (20.0%) had collaterals at splenic hilum. Four patients (13.3%) had recanalized paraumbilical vein whereas only 1 patient was found to have both collaterals. Class A patient had no collaterals at other sites. In class B, one patient had collateral at splenic hilum and other patient had paraumbilical collateral. In class C, 14 patients had no other collaterals, 5 had collaterals at splenic hilum and 3 patients had paraumbilical collateral. This distribution of patient with other collaterals was not significantly associated with Child Pugh’s total score. The Damping Index, oesophageal varices and splenoportal index in various Child Pugh class has been shown in [Table/Fig-9].
Damping Index, oesophageal varices and splenoportal index in various Child Pugh class
| Damping index | Child Pugh’s Class | Total |
|---|
| A | B | C |
|---|
| Damping index |
| >0.6 | 0 | 2 | 18 | 20 |
| 0.6 or <0.6 | 1 | 4 | 5 | 10 |
| Total | 1 | 6 | 23 | 30 |
| Esophageal varices |
| Present | 0 | 2 | 13 | 15 |
| Absent | 1 | 4 | 10 | 15 |
| Splenoportal Index |
| 4-8 | 11 |
| 8.1 to 12.0 | 10 |
| >12.0 | 9 |
Discussion
Cirrhosis is an end stage liver disease and it is the most common cause of portal hypertension [7]. HVPG measurement is invasive as well as expensive with potential for complications in cirrhotics with coagulopathy. There is a need for a non-invasive and a cost-effective method to accurately diagnose portal hypertension and to predict the presence of oesophageal varices. Colour Doppler Ultrasound is safe radiation-free, painless, inexpensive and repeatable method which is well accepted by the patients [9–12]. In our study of 30 patients (male=22; female=8), most of the patients were in third to fourth decade of life with age ranging from 26-56 years (39.53±7.32). Our series had 23 cases in Child Pugh’s class C, 6 in class B and 1 in class A. In a study by Bhutto et al., there were 32 (49.2%) patients in Child-Pugh Class A, 23 (35.4%) were in Class B and 10 (15.4%) patients were in Class C [10]. Compared to studies done by previous authors, our study had more number of patients in Child Pugh’s class C. This may be due to late presentation to the hospital in advanced stage of the disease, being a referral hospital. Twenty eight patients had ascites and majority of them were in class C (76.6%). Mittal et al., in their study of 50 patients found similar association that severity of ascites correlated with the increasing Child Pugh’s score (p<0.0001) [2]. Our study also shows similar findings. Three patients with cirrhosis had hepatic encephalopathy and all were in class C. Mittal et al., showed that higher trends of hepatic encephalopathy was observed in patients with hepatofugal flow in portal vein (p<0.01) and also the Child Pugh’s score was significantly higher in patients with a reversed flow in portal vein. Our study showed similar findings to Mittal et al in relation to serum bilirubin, albumin and prothrombin time.
Twenty four patients (80%) had splenomegaly, distributed in all three Child Pugh’s classes. Of these 24 patients, nineteen were in class C, four in class B and 1 in class A. Rest Six patients (20%) had normal spleen size and were in class B and C. Presence or absence of splenomegaly could not suggest the severity of liver dysfunction. This was also concluded by previous studies.
We did colour Doppler evaluation of hepatic veins in all our patients and found monophasic pattern in 22(73.3%) patients, biphasic in 4(13.3%) and triphasic in 4(13.3%) patients. On correlating this hepatic venous waveform pattern with Child Pugh’s scoring system we found out of 23 patients in class C, twenty (87%) had monophasic waveform, two (8.7%) had biphasic waveform and only one patient (4.7%) had triphasic waveform. In class B, two patients each had monophasic, biphasic and triphasic waveform. Whereas the only patient in class A had triphasic waveform. As the Child Pugh’s score increased, there was conversion of normal triphasic waveform into biphasic to finally monophasic. Hence the relationship of these waveforms had a significant correlation with the Child Pugh’s class (p<0.05). Similar results were observed by Bhutto et al., in their research involving 65 patients [10]. They concluded that relationship of these waveforms had significant relation with hepatic dysfunction (p < 0.012) whereas was insignificant in grading oesophageal varices (p 0.29). Baik et al., in their study on 78 patients found abnormal hepatic vein waveforms in 72 patients [9]. Forty four patients had biphasic, 28 had monophasic and 6 had normal triphasic waveform. They concluded mean HVPG of 14.6±4.3mmHg is suggestive of severe portal hypertension, which was observed in 35(45%) of their patients. They also concluded that monophasic venous flow was associated with severe portal hypertension (HVPG > 15mmHg) and was statistically significant (p<.01). Results of our study and Baik et al., are comparable. In our study, we used Child Pugh’s scoring system to correlate severity of liver disease with hepatic venous waveform whereas Baik et al., used both non-invasive and invasive methods to show correlation between the abnormal hepatic vein waveform and increase in HVPG. Studies by Sudhamshu et al., and Joseph et al., could not establish any correlation between severity of liver disease and hepatic venous waveform [13–15]. Their studies showed that the flat waveforms have no diagnostic value and suggested that role of hepatic blood flow seems to be important suggesting haemodynamic changes rather than liver dysfunction as a plausible cause of change in waveforms. However, Joseph et al concluded that loss of triphasic hepatic venous waveform is highly sensitive in predicting significant varices in patients with cirrhosis [15].
Damping index (DI) is the ratio between the minimum velocity and maximum velocity of the hepatic venous flow. DI > 0.6 was suggestive of portal hypertension. Higher DI values tend to give flat hepatic venous waveforms. In our study DI was 0.02-0.90 (0.702± 0.21). Positive correlation was found between Child Pugh’s total score and DI, therefore higher the Child Pugh’s score, higher was the Damping index value (r = 0.614; p<0.05). Kim et al., in their study of 76 patients found abnormal hepatic venous waveforms in 66 patients (86.8%) [16]. They also found that DI significantly correlated with the grade of HVPG, i.e. with higher HVPG increased DI was observed (p<0.01). They concluded that Damping index of the HV waveform by Doppler ultrasonography is a non-invasive supplementary tool in evaluating the severity of portal hypertension.
Eleven patients had SPI of 4-8 cm/sec, 10 cases had between 8.1-12 and nine had more than 12. In our study there was weak correlation between the SPI value and Child Pugh’s score (r =0.269; p=0.15). Han et al., attempted to assess value of acoustic radiation force impulse (ARFI) for evaluating portal hypertension by correlating the elasticity of liver cirrhosis with Doppler ultrasound mainly splenic index, mean portal vein velocity and splenoportal index [17]. They concluded ARFI was well correlated statistically with Doppler parameters, but was of limited value in predicting portal hypertension directly owing to great variability of Doppler parameters.
Oesophageal varices were present in 15(50%) patients of which 13 patients belonged to class C and two were from class B. Fifteen (50%) patients had no oesophageal varices, out of these ten were in class C. In the patients with oesophageal varices the Child Pugh’s total score mean value was 11.87±2.03 whereas in the patients without oesophageal varices the mean Child Pugh’s total score mean value was 10.47±2.06. This difference was statistically non significant. Similar conclusion was made by Mittal et al in their study group. In our study, out of 15 patients with oesophageal varices 13 patient (86.7%) had monophasic waveform, 1 patient (6.7%) had biphasic and triphasic waveform each [2]. Nine patients (60%) who had monophasic waveform had no oesophageal varices. This association between hepatic vein waveform and presence of oesophageal varices was statistically non significant (p=0.26) and also there was no correlation between dampening index and presence of oesophageal varices. These results were also supported by the study done by Bhutto et al., in 54 patients [10].
Joseph et al., showed that sensitivity of loss of the normal triphasic waveform in detecting large varices is high (95.23%) [15]. The negative predictive value is high (75%) although the positive predictive value (42.6%) and specificity (10%) are low. In class B. one patient had collaterals at splenic hilum and other patient had paraumbilical collateral. In class C, 14 patients had no other collaterals, 5 had collaterals at splenic hilum and three patients had paraumbilical collateral. This distribution of patient with other collaterals was not significantly associated with Child Pugh’s score.
Limitations and Future Prospects
The study population was small in our study. Upper GI endoscopy was not done in all cases to identify varices in our study. Also, HVPG was not done in all cases because of resource constraint and lack of expertise in our institute. Sick patients could not be transferred to higher centre for these investigations. Future studies with damping index ratio (DI ratio= DI expiration/DI inspiration), and difference (ΔDI = DI inspiration – DI expiation) can be done to look for the sensitivity and specificity in predicting portal hypertension.
Conclusion
At present, the gold standard for the measurement of portal pressure is HVPG, which is an invasive procedure with several other drawbacks. So there is need to replace invasive procedure by noninvasive methods, which have maximum accuracy, with none or minimal side effects. Hepatic venous waveform pressure changes and DI have significant relation with the severity of hepatic dysfunction which is measured by Child Pugh’s scoring system. SPI has no relation with the severity of liver disease. Hepatic venous waveform pressure changes, DI and SPI have no value in predicting presence of oesophageal varices. We would like to conclude by saying that Doppler ultrasound may be an excellent non-invasive modality for the assessment of severity of liver disease.
Child Pugh’s scoring classes: Class A: 5-6 points; Class B: 7-9 points; Class C: 10-15 points
n=number of patients
Chi-square=13.75, p<0.05; n= number of patients