Diabetes Mellitus type 2 (T2DM) is a progressive long-term non-communicable disease, which places a significant burden not only on healthcare providers and health system but also on the affected individuals and their families [1]. The total number of people with diabetes worldwide was conservatively estimated to increase from 171 million in 2000 to 366 million in 2030 [2]. Prediction of diabetic epidemic in first quarter of 21st century necessitates worldwide surveillance for initiating preventive and control measures [3].
India has the distinction of being the diabetes capital of the world, where every fifth diabetic in the world resides [4]. The prevalence is only 0.7% for non-obese, physically active and rural population and it increases to 11% for obese, sedentary and urban Indians making the average (combined rural and urban) as 8% [5].
So, it becomes imperative to estimate the prevalence of diabetes in the various regions of India [6]. Presently, the fasting plasma glucose test is used to determine prevalence of diabetes which is invasive and issues of safety of injections loom large. Other simpler screening tests like urine sugar, Madras Diabetes Research Foundation-Indian Diabetic Risk Score (MDRF-IDRS) and Canadian Diabetes Risk Assessment questionnaire (Canrisk) have been developed with varying sensitivity and specificities [7,8].
Keeping this aspect in mind, this research was initiated with the objective to ascertain the validity, viz., sensitivity and specificity of urine sugar test, Canrisk screening and Madras Diabetes Research Foundation-Indian Diabetic Risk Score (MDRF-IDRS) tool against gold standard of both Fasting (F) and Postprandial (PP) plasma glucose tests and deriving an estimate of the population prevalence (by each of these screening tests) of T2DM.
Materials and Methods
It was a community based cross-sectional study conducted in two adjacent rural field practice areas, Barwala village and Poothkhurd with approximate population of 4,800 and 14,000 respectively covered under Department of Community Medicine, Maulana Azad Medical College, New Delhi. The study was conducted over a period of one year. All adults aged 18 years and above residing in above mentioned areas constituted the universe of study population.
The sample size was calculated on the basis of a previous multi-centric study which recorded prevalence of diabetes in rural population as 3.1% [9]. Taking lowest acceptable prevalence rate for the sample as 2% (i.e. the margin of error as 1.1%) with 95% confidence limit, the required sample size for 18,800 rural population was 908 (derived by Epi-info software version 3.3.2). The sample was selected using systematic random sampling method. Considering each household would be having minimum of 3 adult members above 18 years, 376 households i.e., every tenth household was visited to achieve the requisite sample size. However, a total of 1006 subjects were included in the study.
Inclusion and Exclusion Criteria: All members of the study population above 18 years of age were in sampling frame. Antenatal mothers, patients on corticosteroids and known subjects with low renal threshold (e.g. pregnant women) were excluded as these will confound the results. However, it was found that none of the patients was using regularly corticosteroid and renal glycosuric drugs e.g. pyridium or had hormonal disorders, e.g. Cushing’s syndrome, thyrotoxicosis, acromegaly and stress hormones. Known and controlled diabetics were not excluded from the study. They will read as negative by plasma glucose test. For the purpose of final computation of prevalence they were added in the prevalence determined (by blood tests) or derived (by means of mathematical formula by screening tests). However known diabetics were excluded for validation study.
Study Instruments: A pre-designed, pre-tested, semi-structured questionnaire was used containing items to assess identification data and socio-economic status like age, sex, religion, marital status etc. besides risks factors like family history, smoking etc. Canrisk and MDRF- IDRS were used in the study. The questionnaire consists of all items was translated in Hindi by including local terms and back translated in English from Hindi. It was field tested on 20 subjects in rural community. Finally the study protocol was field tested in another locality before using for data collection. Public acceptance of the questionnaire instruments was good. None of the respondent refused the questionnaire.
Canrisk is a screening tool developed by Public Health Agency of Canada to screen for diabetes. It has been validated that this model can effectively distinguish low-risk from high-risk cases [10,11]. The maximum score was 25. MDRF-IDRS has also been validated in Indian setting and its maximum score was 100 [7].
In current study attempts are made to determine the cut-off points for diabetes using gold standards of fasting and post-prandial values of both the above-mentioned questionnaires and determined the optimum sensitivity and specificity.
All participants were also asked to give double void urine sample for urinary sugar estimation by Benedict Test both fasting and postprandial. A double voided urine sample is considered more accurate for purposes of glucose testing.
Data collection: All the individuals above 18 years of age were screened in selected households. Individuals were subjected to fasting and postprandial plasma glucose tests by glucose oxidase method and urinary fasting and postprandial tests by semi-quantitative Benedict test. All blood and urine samples were collected observing safety precautions and standards prescribed in blood collection, at subject’s respective residences. Samples were analysed at the rural laboratory of health center. The reports were communicated to the clients within a week’s time. Two field investigators of the project were trained in the conduction of survey and analysis of samples. The field examiners were taken after scrutinizing their competence in research skills. Ten percent of the samples were also sent to the central laboratory and cross checked. Variation of field and central laboratory results were not statistically significant. Raised fasting glucose was taken as the fasting plasma glucose level of ≥126 mg/dL, according to the diagnostic criteria of the World Health Organization. Raised PPPG was taken as ≥200 mg/dL.
This cross-sectional study had three components which were simultaneously carried out:
1. Determination of true prevalence of Type 2 Diabetes Mellitus, p(B): Prevalence of diabetes by both Fasting plasma glucose (FPG) and postprandial plasma glucose levels (PBS).
2. Determination of cut-off values (Urine test, Canrisk and MDRF-IDRS) and the validity of the screening tests: The same adult subjects (who were subjected to fasting and post-prandial tests) were also screened for diabetes by using non-invasive double void urine sugar test (urine benedicts test), MDRF-IDRS and Canrisk questionnaires. Sensitivity, specificity and predictive values of these tests were determined against plasma glucose testing.
3. Determination of the prevalence of diabetes by individual screening tests, P(A): Prevalence of diabetes, P(A) as detected by the afore-mentioned screening tests was recorded for substitution in the following mathematical formula to estimate the actual prevalence and then compared with the prevalence determined by plasma glucose tests {P(B)}.
Estimation of Prevalence of Diabetes from Screening Tests
Scientists like Gart and Buck had derived an estimate of the true population prevalence (Pe) using the sensitivity (Se) and specificity (Sp) of the screening test and the proportion of subjects positive by that screening test p(A) [12].
Pe = {(P (A) + Sp-1)/(Se+Sp-1)}
The prevalence measured by plasma glucose tests, P(B) was compared with the prevalence estimated (Pe) by these tests by means of above mathematical formula wherein values of the prevalence by each of these tests and sensitivity and specificity of each test was substituted. Sensitivity and specificity of screening test were determined against gold standard of plasma glucose test.
Statistical Analysis
Data analysis was done using SPSS version 16. The results were explained in simple proportion. ROC curve was prepared to find out optimum cut off for Canrisk and MDRF-IDRS.
Ethical issues: Written informed consent was taken from the study subjects. Option to withdraw from the study at any time was kept open. The ethical clearance for the study was obtained from the institutional ethics committee.
Results
A total of 1005 adults were included in the study, out of which 614 (61.1%) were females and 391 (38.9%) were males. Less than half (449/1005 or 44.7%) subjects were in range of 18-35 years and 556 (55.3%) were aged more than 35 years. One-fifth of (21.1%) subjects were illiterate. Nearly all (980/1005, 97.5%) were Hindus, 24 (2.4%) were Muslim. More than three-fourth (787/1005, 78.3%) were married, 143 (14.2%) were unmarried, 73 (7.3%) were widow and 2 (0.2%) were divorced.
Analysis of all the eligible subjects (≥18 years of age) in the population
(A) Plasma Glucose Tests: Both FPG and PPPG have same and high sensitivities (93.47%) and specificities (99.68%) after using them interchangeably (turn-wise) as gold-standard [Table/Fig-1]. In view of the above we have used both of these two plasma glucose tests as gold standard for validation of other proposed tests and questionnaires. The prevalence, P(B) (the true prevalence of Diabetes) determined by either of these tests was 4.6% for the population of 18 years or more.
Validity analysis of fasting against post prandial plasma glucose levels in ≥18 years (n=1005).
| FPG/ Test | PPPG (Gold Standard) | Total |
|---|
| Diabetic≥200mg/dl or≥11.1 mmol/L | Non Diabetic<200mg/dl or<11.1 mmol/L |
|---|
| Diabetic (≥126mg/dl or ≥7mmol/L | 43 (93.5) | 3 (0.3) | 46 (4.6) |
| Non Diabetic (<126mg/dl or <7.0mmol/L) | 03 (6.5) | 956 (99.7) | 959 (95.4) |
| Total | 46 (100.0) | 959 (100.0) | 1005 (100.0) |
Sensitivity: 93.47%, Specificity: 99.68%, PPV: 93.47%, NPV: 99.68%
(B) Urine Test: Validity of Urine Test: Sensitivity of fasting urine (among subjects ≥18 years of age) against FPS was 65.2% and specificity was 99.9%. Most (84.8%) of patients with PPPS ≥200mg% showed post prandial urine test positive and 15.2% of patients with PPPG ≥200mg% showed postprandial urine test negative. Sensitivity of postprandial urine test against PPPG was 84.8% and specificity was 99.7% [Table/Fig-2].
Validation of urine test, Canrisk and MDRF-IDRS against plasma glucose test among ≥ 18 years of age.
| Level ofPlasma glucose | Fasting (FPG) | Total | Post prandial glucose (PPPG) | Total | SensitivityPercent | SpecificityPercent |
|---|
| Screening test score | ≥126mg/dl≥7.0mmol/L | <126mg/dl<7.0mmol/L | | ≥200mg/dl≥11.1 mmol/L | <200mg/dl<11.1 mmol/L | | FPG(%) | PPPG(%) | FPG(%) | PPPG(%) |
|---|
| Urine test Positive | 30 (65.2) | 1 (0.1) | 31 | 39 (84.8) | 3 (0.3) | 42 | 65.2 | 84.8 | 99.9 | 99.7 |
| Urine test Negative | 16 (34.8) | 958 (99.9) | 974 | 7 (15.2) | 956 (99.7) | 963 | | | | |
| CANRISK Score ≥7 | 41 (89.1) | 449 (46.8) | 490 | 38 (82.6) | 452 (47.1) | 490 | 89.1 | 82.6 | 53.2 | 52.9 |
| CANRISK Score <7 | 5 (10.9) | 510 (53.2) | 515 | 8 (17.4) | 507 (52.9) | 515 | | | | |
| IDRS Score ≥60 | 24 (52.2) | 301 (31.4) | 325 | 24 (52.2) | 301 (31.4) | 325 | 52.2 | 52.2 | 68.6 | 68.6 |
| IDRS Score <60 | 22 (47.8) | 658 (68.6) | 680 | 22 (47.8) | 658 (68.6) | 680 | | | | |
| Total | 46 (4.6) | 959 (95.4) | 1005 | 46 (4.6) | 959 (95.4) | 1005 | | | | |
Urine test : FPG: PPV=96.8%; NPV=98.4%; PPPG: PPV=92.8%; NPV=99.3%
CANRISK : FPG: PPV=8.4%; NPV=99.0%; PPPG: PPV=7.7%; NPV=98.4%
IDRS: FPG: PPV=7.4%; NPV=96.76% PPPG: PPV=7.4%; NPV=96.8%
Estimation of Prevalence of diabetes from Urine test: Applying the formula (1) to estimate the prevalence rate of diabetes from sensitivity and specificity of the screening tool as urine Benedict test for Fasting Urine Sugar [Table/Fig-3] is -
= (0.03 + 0.999-1)/ (0.652 + 0.999-1)
= 0.029/0.651 = 0.0445 (4.45%)
Parameters for Prevalence calculation (Pe) from screening tests among Population 18 years of age and above.
| Against gold standard of fasting(≥7.0mmol/L or 126 mg/dl and above) True Prevalence (among above 18 y of age=4.58%) | Against gold standard of PP (≥11.1 mmol/L or 200 mg/dl and above) True Prevalence (among above 18 y of age=4.58%) |
|---|
| Screening test | Cut off | Se | Sp | P(A)* | (Pe)** | Cut-off | Se | Sp | P(A)* | P(e)** |
|---|
| Urine Sugar (double void) | 180 mg/dl | 65.2 | 99.9 | 0.03 | 4.45% | 180 mg/dl | 84.8 | 99.7 | 0.04 | 4.42% |
| Canrisk | 7 | 89.1 | 53.2 | 0.48 | 4.49% | 7 | 82.6 | 52.9 | 0.48 | 4.5% |
| MDRF-IDRS | 60 | 52.2 | 68.6 | 0.32 | 4.3% | 60 | 52.2 | 68.6 | 0.32 | 4.3% |
Where, P(A)* is prevalence determined by screening test and P(e)** is estimated prevalence by each of the screening test.
From the Fasting plasma glucose test (FBG), the prevalence rate of diabetes, P(B), was 4.58% in population ≥18 years.
With the same formula, estimated prevalence for Postprandial Urine Sugar (against gold standard of PPPS) was 4.42% [Table/Fig-3].
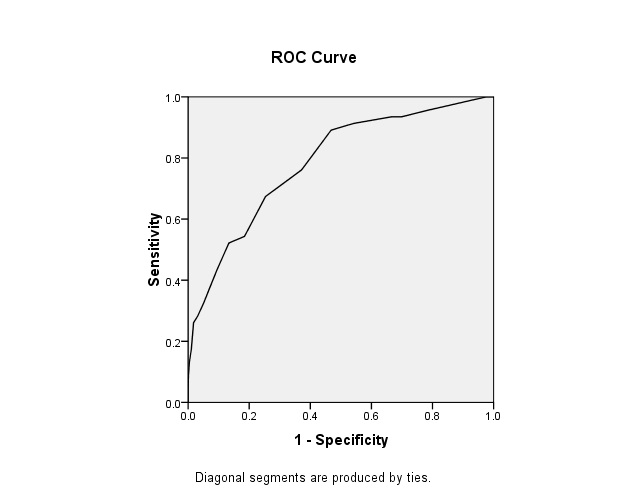
(C) Canrisk Questionnaire: Optimum sensitivity and specificity of CANRISK was at score of 8, 78.1% and 62.9% respectively with FPG. As the scores increased the percentage of diabetics also increased as compared to non-diabetic groups with PPPG also. Here we have taken the sensitivity and specificity somewhat less than that found at cutoff of 8 with FPG. The ROC curve was also plotted for both FPG [Table/Fig-4] and PPPG [Table/Fig-5] found optimum cut off of 8. However, we have chosen 7 for all calculation as suggested by other authors [9].
ROC curve for determining cut off of Canrisk against fasting blood glucose.
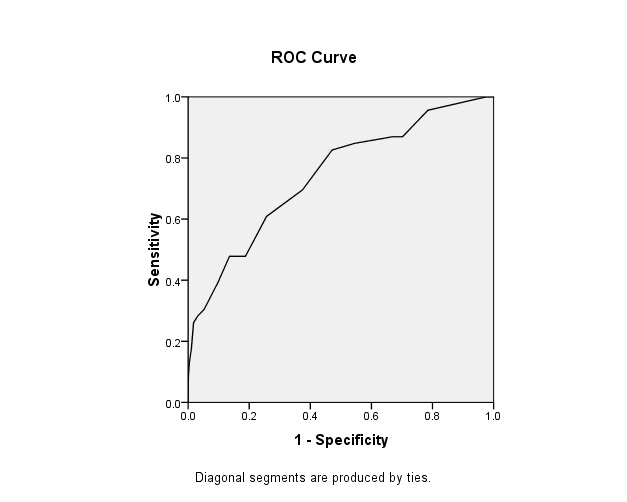
ROC curve of Canrisk against postprandial plasma glucose level.
Receiver Operative Characteristic curve for determining the cut-off for Canrisk score against gold-standard of Fasting plasma glucose (≥7.0mmol/L or 126 mg/dl and above): Area under the curve was 0.78; Cut off at optimum sensitivity and specificity was 8; Sensitivity and Specificity at cut off 8 were 78.1% and 62.9% respectively [Table/Fig-4].
Reciever Operative Characteristic curve for determining the cut-off for Canrisk score against gold-standard of PPPG (≥11.1 mmol/L or 200 mg/dl and above): Area under the curve was 0.74; Cut off at optimum sensitivity and specificity was 8; Sensitivity and Specificity at cut off 8 were 82.6% and 52.9% respectively [Table/Fig-5].
Estimation of prevalence of diabetes with Canrisk: Applying the formula (1) the prevalence rate of diabetes from sensitivity and specificity (against gold standard of FPG) of the screening tool (CANRISK) was estimated as 4.5% and same (4.5%) from PPPG [Table/Fig-3].
(D) Indian Diabetes Risk Score (IDRS): As the cutoff of the Indian diabetic risk score (MDRF-IDRS) increases more than 60 the sensitivity decreases sharply for further increase of specificity with both FPG and PPPG. At cut off 20, the MDRF-IDRS is 100% sensitive but specificity is 0.9%. Similarly at 90 the MDRF-IDRS is 99.4% specific but 2.2% sensitive.
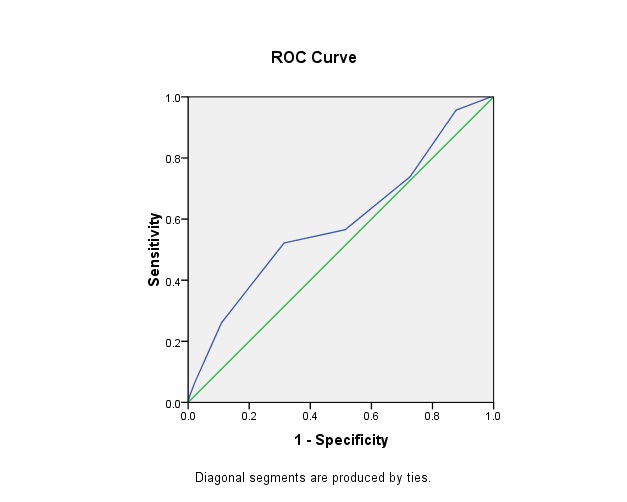
Receiver Operative Characteristic curve for determining the cut-off for IDRS-MDRF against gold-standard of Fasting plasma glucose (≥7.0mmol/L or 126 mg/dl and above): Area under the curve was 0.59; Cut off at optimum sensitivity and specificity was 60; Sensitivity and Specificity at this cut off of 60 were 52.2% and 68.6% respectively [Table/Fig-6].
ROC curve for MDRF-IDRS against fasting plasma glucose.
Receiver Operative Characteristic curve for determining the cut-off for IDRS-MDRF against gold-standard of PP (≥11.1 mmol/L or 200 mg/dl and above): Area under the curve was 0.59; Cut off at optimum sensitivity and specificity was 60; Sensitivity and Specificity at cut off 60 were 52.2% and 68.6% respectively [Table/Fig-7].
ROC curve for IDRS-MDRF against post prandial plasma glucose.

Estimation of Prevalence of diabetes with IDRS: The prevalence rate of diabetes (both for FPS and PPPS) from IDRS (as calculated from the formula) was estimated to be 4.3% which was comparable with true prevalence [Table/Fig-3].
Discussion
Fasting plasma glucose (FBG) test is also a component of screening and diagnostic testing and is often preferred because it is faster to perform and more convenient for the patient. FBG test yields a sensitivity of 40-60% with a specificity of 76% for identifying individuals with diabetes [12,13]. A number of studies in different populations have reported differently on the performance of an FPG of 6.1mmol/ l. They report sensitivities ranging from 58%-87% (median: 81%) and specificities ranging from 75%-98% (median 92%) [14]. In our study both FPG and PPPG have high sensitivity (93.47%) and specificity (99.68%) by using them interchangeably as gold-standards and screening tests. The 2-hour plasma glucose test provides a sensitivity of 97%, with a specificity of 100% in another study, in the U.S. population as well [15]. The HbA1C test provides a retrospective average of glycaemic control for the previous three months, by measuring the binding glucose to hemoglobin during the life span of red blood cells. The HbA1C has a sensitivity ranging from 78-81% and a specificity of 79-84% [16]. We have not studied HbA1C in the present study.
If it is possible to get an estimate of prevalence (close to true prevalence as determined by gold standard blood tests) through screening, non-invasive tests (such as: Urine sugar, Canrisk and MDRF-IDRS), then these screening tests can be used on large samples. This will help in reducing the need of invasive blood tests to assess the prevalence rate in populations in different geographical areas.
Although standards of DM care recommended FPG (Fasting Plasma Glucose) as the best screening method for it; very few studies have also employed the use of urine sugar for screening of DM [17]. However, the validity of the urine stick as a screening tool in some studies have been found to be insufficient, with a sensitivity of less than 20 percent and hence, it was concluded that the urine stick is not a useful screening tool [18]. The better measurements of sensitivity and specificity by urine sugar was observed in our study (compared to aforesaid study) which is because we used double void urine and Benedict’s test instead of dipstix test and which in turn is even better measured by postprandial tests because plasma threshold of 200mg/dl gets closer to renal threshold of 180mg/dl.
In the present study, sensitivity of fasting urine against fasting plasma glucose was 65.2% and specificity was 99.9% while sensitivity of postprandial urine against postprandial plasma glucose was 84.8% and specificity was 99.7%. These findings correlate with the findings of a study which shows that both the sensitivity and specificity of postprandial urine test were high [19].
ROC curves were also plotted against FPG and PPPG to determine the optimum cutoffs for MDRF-IDRS. In the present study at the cut off IDRS value of 60 the sensitivity was 52.2% and specificity was 68.6% which were same and optimum for both FPG and PPPG, which can be compared with the findings of a study in which at the cutoff of IDRS value of 60 the sensitivity is 72.5% and specificity is 60.1% [6]. Both the ROC curves were found close to diagonal, therefore, they are not very good ROC curves and cut-off won’t show the difference in positive and negative results so accurately. In spite of this low area under the curve in ROC for MDRF-IDRS, the estimates of prevalence at various ages were comparable to those with higher sensitivities and specificities.
Limitations
Recall bias in taking history of known diabetes could have affected the results. Similarly who were told by their local doctors sometime they were unqualified practitioners in rural setting, to have high blood sugar on their blood test might not be classified as diabetes. In such situation the Indian diabetic risk score and Canrisk might have given higher scores.
Conclusion
In the study it was observed that prevalence rate of T2DM in rural areas can be estimated by using non-invasive tests such as Urine Benedict’s test that provides same estimated prevalence as true prevalence measured by blood test by using a mathematical formula. Similarly, Canrisk test can also be used on large scale. In other words, we infer that if sensitivity (Se) and specificity (Sp) of a screening test is known in the particular population (which are fixed characteristics of a test and do not change by prevalence and can be determined in a small subsample and not necessarily a big sample), we just need to determine its prevalence by the screening test P(A) and then substitute the three parameters in the mathematical formula to estimate the prevalence (Pe) which would be very close to the prevalence (true) that would have been determined by the gold standard. Application of such screening tests will help in reducing the need of using invasive blood test on whole of the sample of the populace being investigated.
Funding/Support: Indian Council of Medical Research (Ministry of Health and Family Welfare, Government of India) Ansari Nagar, New Delhi-110029.
Role of the Sponsors: The protocol and report of this study has been reviewed by Project Review Group for scientific content. The funding agencies had no other role in the design and conduct of the study; collection, management, analysis, and interpretation of the data; preparation, review, or approval of the manuscript or decision to submit the manuscript for publication.