Development of type 2 diabetes mellitus in obese individual is often preceded by presence of hyperglycaemia (increased blood glucose levels) due to the body’s inability to maintain normal glucose homeostasis [1]. Development of insulin resistance in these individuals has also been well documented and has been proposed as the main aetiopathogenesis of type 2 diabetes mellitus [2]. The precise reason for the development of insulin resistance is still not clear. The effects of exposure of the peripheral tissues (adipose tissue, liver, pancreas and skeletal muscle) to chronic high levels of leptin (hyperleptinaemia) observed in obese individuals has been hypothesized for the development of insulin resistance [3]. Leptin, a 16-kDa polypeptide hormone, primarily regulates energy homeostasis by centrally mediated actions on the hypothalamus. However, more importantly, its action on the pancreas [4] and skeletal muscle [5] plays an important role in the regulation of blood glucose levels. Under normal metabolic conditions, leptin reportedly normalizes hyperglycemia by stimulation of GLUT4 (Glucose Transporter type 4) expression in the skeletal muscle and or by increasing insulin sensitivity in the β-cells [6]. However, the impact of persistently elevated levels of leptin (as seen in obesity) on glucose metabolism has not been widely investigated. We hypothesize that chronic leptin administration would lead to a state of insulin resistance, which in turn could contribute to the aetiopathogenesis of altered insulin receptor and GLUT4 expression in the peripheral tissues. Thus, the aim of this study was therefore to examine the body’s response to a glucose challenge following chronic leptin administration in rats.
Materials and Methods
Animals and Experimental Procedures
Sixteen male Sprague-Dawley rats, aged 13-14 weeks, were housed in polyethylene cages at room temperature (22–24°C), with a 12/12 hour light/dark cycle (7am–7pm), and with ad libitum access to food and water throughout the study period. They were randomized into control and experimental groups with eight rats per group. The experimental group was injected daily with leptin at a dose of 60μg/kg/day in 0.5 ml normal saline subcutaneously for 42 days. This dose of leptin had been based on studies done previously at our laboratory [7]. The control group was injected with an equal volume of saline over the same period. Body weight was measured weekly. The study design was approved by the Animal Users and Care Committee of the Faculty of Medicine, Universiti Teknologi MARA, Malaysia.
Glucose Tolerance Test Procedure
At the end of the 42-day protocol, the rats were anaesthetised and the right jugular vein was cannulated to infuse glucose, while the left carotid artery was cannulated for blood sample collection. A baseline (0 time) blood sample was collected, after which 50 mg of glucose dissolved in 0.5 ml of distilled water was infused intravenously to both the groups at a rate of 100μl/min using the same infusion pump. Blood samples (0.5 ml) were collected at 5, 10, 15, 20, 25 and 30 minutes for glucose and insulin measurements. Muscle biopsy samples were also collected using a biopsy punch (6.0mm Model: BP-50F Brymill Cryogenic Systems, UK) at 0, 15 and 30 min from the gastrocnemii muscle for the estimation of GLUT4 protein content and mRNA expression of GLUT4 and IR (Insulin Receptor).
Fasting Glucose and Plasma Insulin Quantification
In order to study the effect of leptin administration on glucose homeostasis, blood glucose and plasma insulin levels were measured. Blood glucose was estimated using a commercially available glucose oxidase method kit (Eton Bioscience Inc., Oberlin Drive, San Diego, CA, USA). Plasma insulin levels were estimated using commercially available enzyme linked immunosorbant assay (Mercodia Rat Insulin ELISA, Mercodia, Sylveniusgatan 8A, SE-754 50 Uppsala, Sweden). Since, the main mode of action of insulin during a glucose challenge is to increase the peripheral uptake of glucose via GLUT4 transporter, we measured the skeletal muscle GLUT4 content. This was measured using an enzyme linked immunosorbant assay kit (Elba science Rat GLUT4 ELISA, Elba science Biotechnology Co. Ltd, Wuhan, China) after homogenization and protein extraction of the skeletal muscle tissue. For homogenisation, 300 μl PBS (Phosphate Buffered Solution) was added to the tissues and then subjected to two freeze-thaw cycles. Afterwards the tissues were grinded using mortar and pestle and the cells were disrupted using ultrasonic cell disrupter. The resulting suspension was centrifuged for 5 minutes at 5000×g. The supernatant (lysate) was aspirated and assayed for GLUT4 content.
Insulin Receptor and GLUT4 mRNA Expression Analysis using q-PCR
To study the role of leptin on insulin receptor and GLUT4 at the level of the gene expression, we measured Insulin receptor (IR) and GLUT4 mRNA levels by quantitative-PCR using SensiFAST No-ROX one-step kit method (Bioline USA Inc. USA) and BIORAD Sequence Detection System (Biorad, USA). β-actin and GAPDH (Glyceraldehyde 3-phosphate dehydrogenase) were used as internal control or housekeeping gene. Total RNA was isolated from skeletal muscle tissues using Trizol reagent. mRNA expression was measured using qRT-PCR, which were run in triplicates and under standard conditions; 45°C for 10 min, 95°C for 2 min followed by 40 cycles of 95°C for 5 seconds, 60°C for 10 seconds and 72°C for 5 seconds using appropriate primers. The ratio (i.e. fold-change) of gene expression levels in experimental treatment groups relative to control rats was calculated relative to the housekeeping control genes-β-actin and GAPDH [8].
Statistical Analysis
All parameters measured was expressed as mean±standard error of mean (SEM). Statistically significant differences between the control and test groups were analysed using two-way analysis of variance (ANOVA). Differences in repeated measures such as glucose and insulin measurements during glucose tolerance test were determined by repeated measures ANOVA. Post-hoc analysis was done to compare individual groups. The differences were considered significant at p ≤ 0.05.
Results
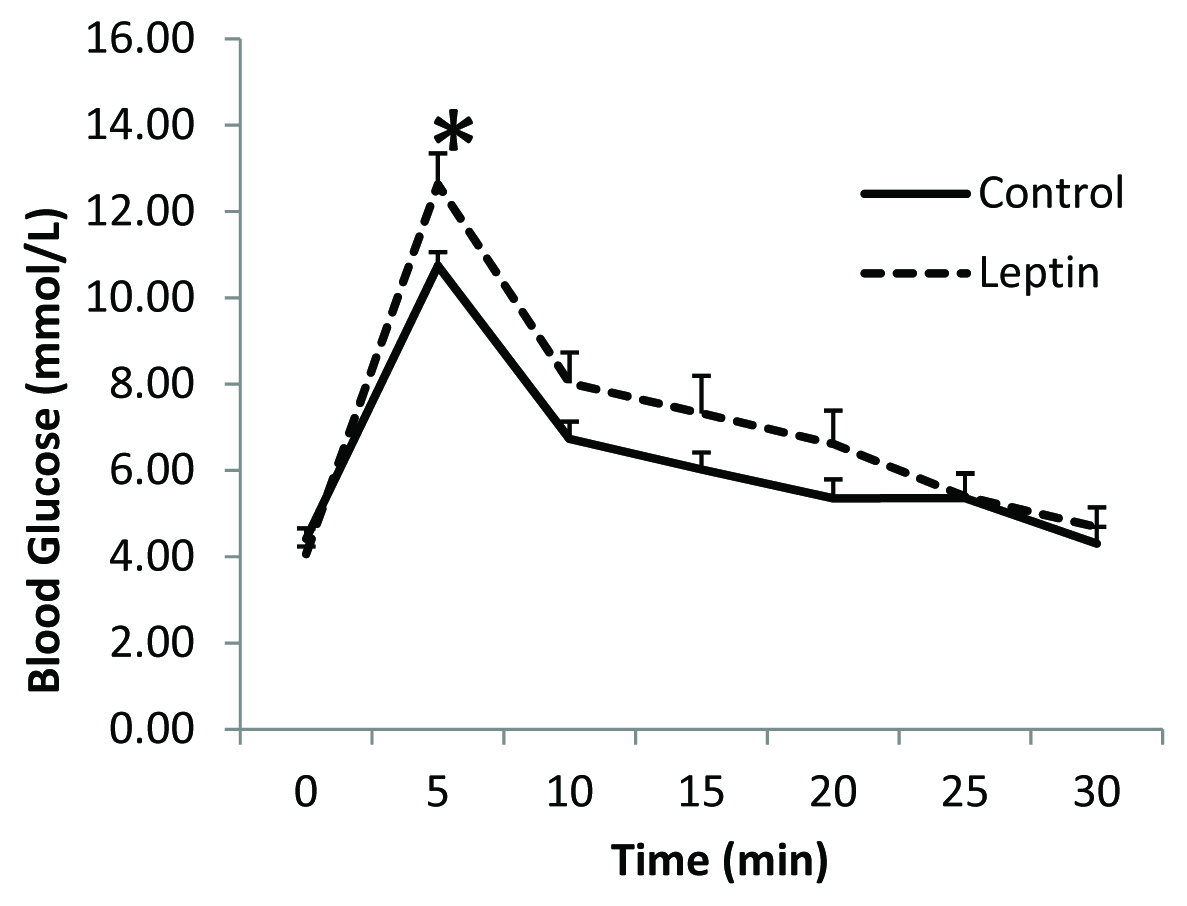
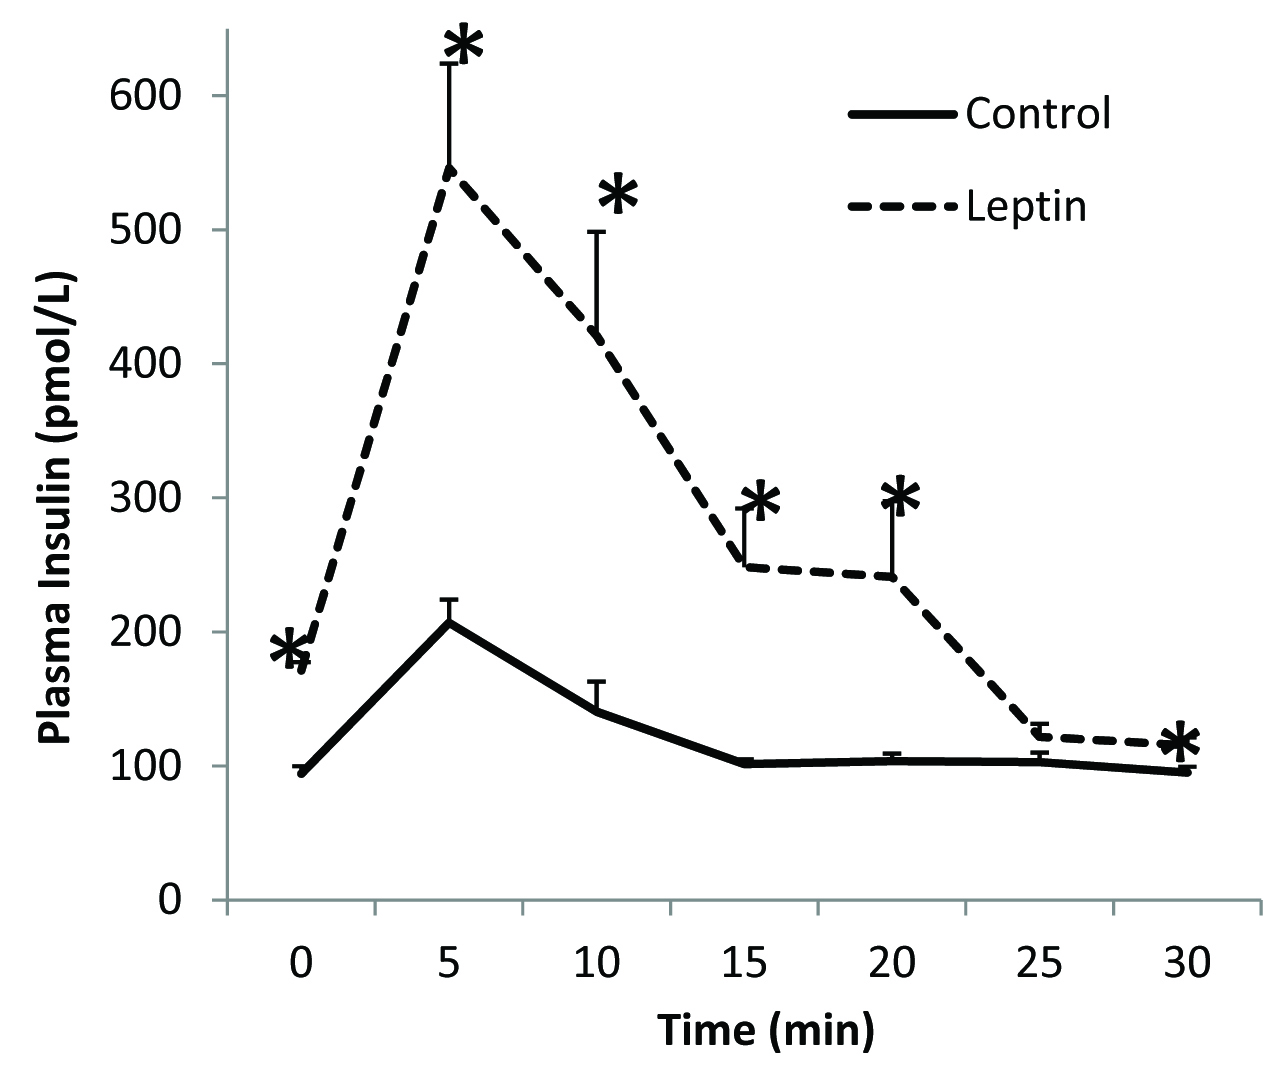
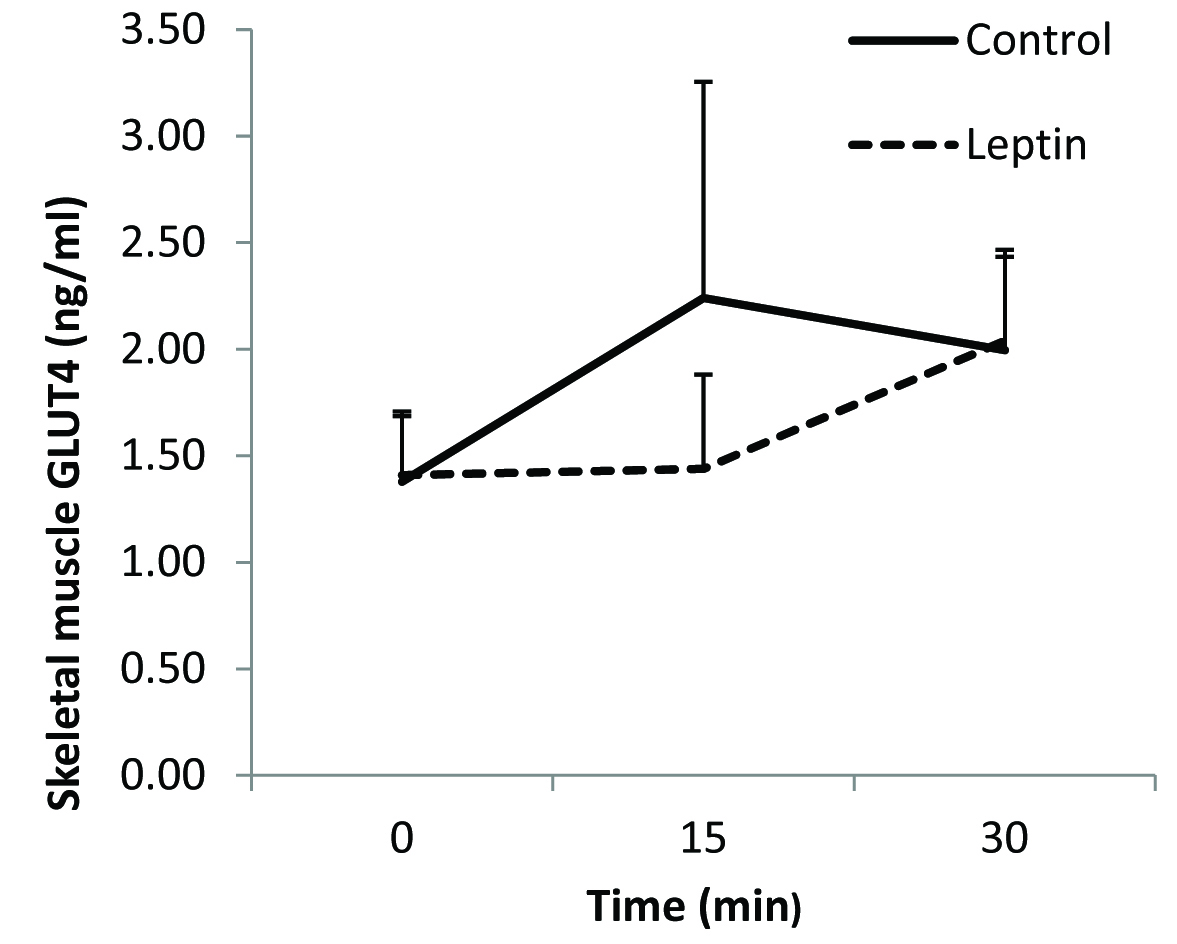
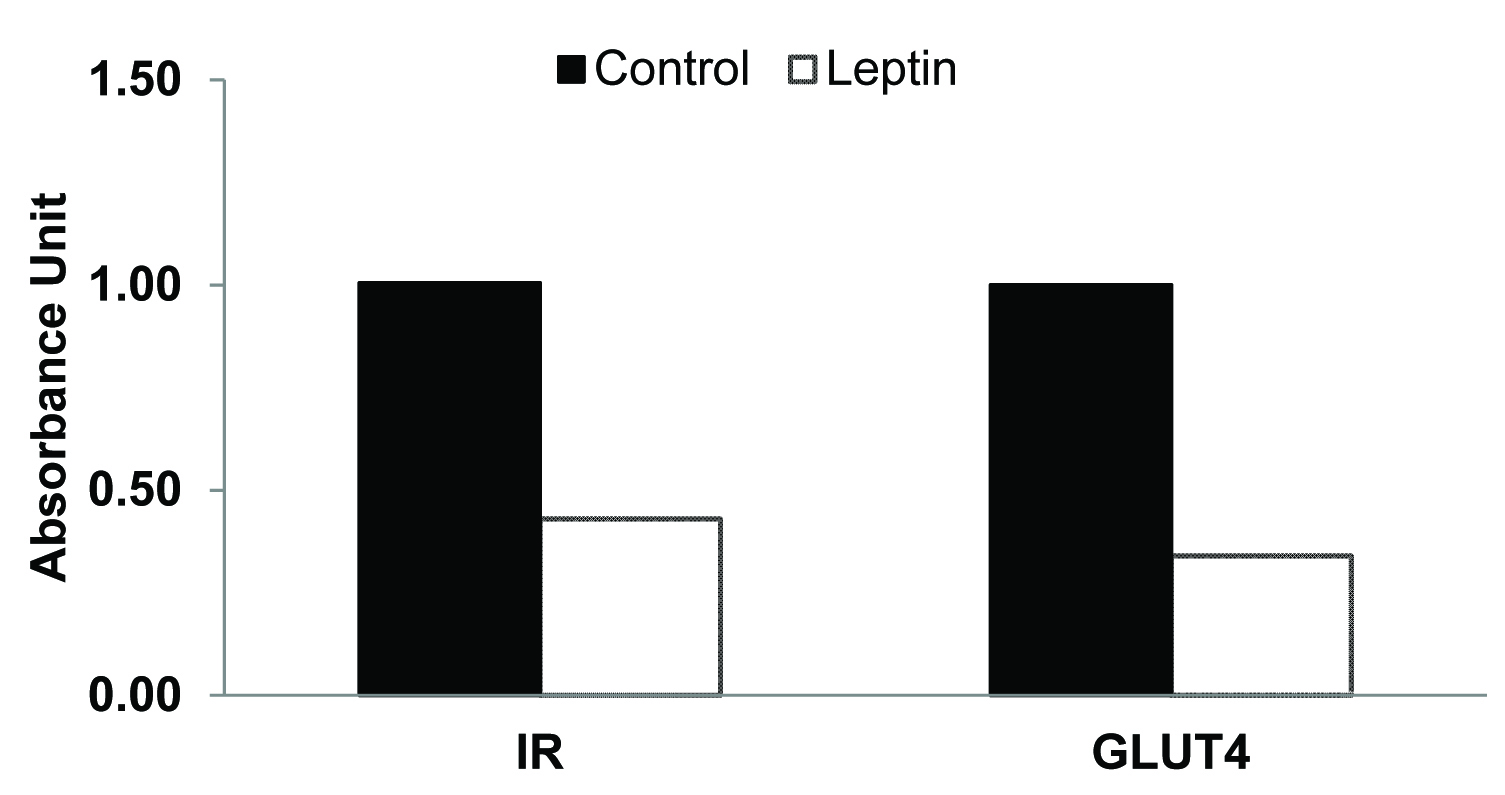
There was no overall significant difference in the fasting plasma glucose levels between leptin treated rats and the controls [Table/Fig-1]. Immediately after the completion of the glucose load at 5 minutes, blood glucose concentration was significantly higher in the leptin treated group when compared to that in the control group [Table/Fig-1]. Although mean plasma glucose concentrations at 10, 15 and 20 minutes were slightly higher than those in the controls the differences were however, not statistically significant. Mean fasting plasma insulin level was significantly higher in leptin treated rats when compared to that in the control group [Table/Fig-2]. After glucose loading, plasma insulin levels were significantly higher at 5, 10, 15, 20 and 30 minutes in leptin treated rats when compared to those in saline treated controls [Table/Fig-2]. No significant differences were evident in skeletal muscle GLUT4 content between the two groups [Table/Fig-3]. Insulin receptor and GLUT4 mRNA expressions were lower when compared to that in their respective controls [Table/Fig-4].
Glucose challenge test following chronic leptin administration
*p < 0.05
Plasma insulin levels following glucose challenge test.
*p < 0.05
Skeletal muscle GLUT4 protein content following glucose challenge test
*p < 0.05
Insulin Receptor (IR) and GLUT4 mRNA expression in skeletal muscle following glucose challenge test
Discussion
In the present study we investigated the effect of chronic exogenous leptin administration on glucose homeostasis in normal Sprague-Dawley rats. Previous studies have shown that injection of leptin directly into the central nervous system significantly decreases glucose stimulated insulin secretion from the β-cells of the pancreas [9]. Similar, findings were seen in ob/ob mice, where leptin administration reduced hyperinsulinaemia even before changes in body weight were seen [10]. However, both the above studies observed the central effects of leptin. Centrally, leptin can affect insulin secretion either through its actions on the hypothalamic leptin receptors leading to activation of melanocortin receptors and thus resulting in a decrease in glucose-stimulated insulin secretion [11], or through increased sympathetic activity [12].
Recent studies have now demonstrated the expression of the long isoform of leptin receptors in the beta islet cells of the pancreas [13]. Thus, it was hypothesised that leptin can have a direct action on the β-cells [14], and thus, can have an effect on insulin secretion. In our study we focussed on the peripheral effects of leptin on glucose homeostasis. We administered leptin at 60 μg/kg/day for 42 days. This dose was arrived at based on our previous study [7] and based on the observation at this particular dose only the peripheral effects of leptin was apparent without its central effect on the hypothalamus. This was proved by the fact that rats did not lose any body weight or appetite while the peripheral effects were observed. Thus, this particular dose of leptin would allow us to mimic the effects of leptin as in an obese chronic hyperleptinaemic individual. In the present study we also did not observe any body weight loss over the 6 weeks of experimental phase in the leptin administered rats.
In this study, there were two important observations during the fasting stage of the glucose challenge test. Leptin administration appears to have caused significant increase in fasting insulin levels creating a state of hyperinsulinaemia [Table/Fig-2]. Initial hyperinsulinaemia is believed to represent a compensatory response of the pancreatic beta cells to insulin resistance [15] in order to maintain normal fasting glucose level, as observed in type 2 diabetes mellitus. Of interest is the finding of Yaspelkis et al., [16], who demonstrated that chronic leptin administration increased glucose uptake and transport in insulin-resistant skeletal muscle. We too observed similar finding in our study, where-in, in spite of the presence of fasting hyperinsulinaemia (i.e. insulin resistant state), fasting plasma glucose in the leptin-treated group was similar (not significantly different) to that of control animals [Table/Fig-1]. Thus the rats were able to maintain normal glucose homeostasis even in the presence of raised insulin levels. This may be explained by a normalization of GLUT4 protein concentration at the skeletal muscle by leptin in the fasted state as seen in our fasting skeletal muscle GLUT4 content, which is comparable to the control group. Since, GLUT4 is usually stored within the cell in specialized compartments called GLUT4 storage vesicles (GSV) and translocated to the cell membrane when needed [17], we assume that chronic administration of leptin was able to maintain normal levels of skeletal muscle GLUT4 content and thus was able to maintain normal fasting glucose level in spite of hyperinsulinaemia.
Secondly, plasma insulin response to a glucose challenge was also significantly greater in the leptin treated rats [Table/Fig-2] along with an increase in plasma glucose levels when compared to control, which was significantly increased at 5 minutes. Thus, it appears that in the fed-state, leptin-treated animals were unable to maintain normal glucose uptake. This is confirmed by the measurement of GLUT4 protein content in the skeletal muscle. GLUT 4 protein content of leptin-treated animals was comparable (not statistically different) with the controls showing the non-responsiveness to insulin in fed state to translocate GLUT4 to the plasma membrane in leptin treated rats [Table/Fig-3]. The observed 50% reduction in mRNA gene expression of insulin receptors and decrease GLUT4 mRNA expression further suggests development of insulin resistance in these leptin-treated rats [Table/Fig-4]. Taken together, the presence of insulin resistance-like state in the treated animals and the normal fasted GLUT4 levels, suggest that GLUT4 translocation and not synthesis was affected.
Limitation
This study has few limitations. Plasma leptin levels were not estimated before and after the administration of leptin. Since, we had chosen normal Spargue-Dawley rats and with the very short half life of leptin in the circulation [18], we presumed that at this dose, exogenous leptin will not cause any significant change to the plasma leptin levels of the rat. Western blot analyses of IR and GLUT4 was not done to substantiate our mRNA expression analysis. We were also not able to show the hepatic insulin responsiveness and hepatic glucose production, which would have helped us to establish leptin’s role in glucose homeostasis regulation.
Conclusion
The findings from our study suggest that chronic hyperleptinaemia decreases expression of insulin receptors in insulin-sensitive tissues and thus promotes the development of insulin resistance. Further investigation is needed to elicit the role of leptin receptor and its intracellular signalling pathway to confirm the findings of our study.