Iron deficiency (ID) is one of the world’s most prevalent nutrient deficiencies [1]. If left untreated, ID can lead to iron deficiency anaemia (IDA). Besides oral iron, both ID and IDA can be efficiently treated with intravenous (IV) iron. Preparations for IV iron therapy that have been available for several years include iron sucrose (IS), sodium ferric gluconate, and low and high molecular weight iron dextran. However, iron dextrans have been associated with dextran-induced anaphylactic reactions (DIARs) [2], and the weaker complex, sodium ferric gluconate, contains larger amounts of labile iron which, upon administration, may result in saturation of the iron-binding capacity of transferrin [3].
Ferric carboxymaltose (FCM) is one of the new-generation polynu-clear iron(III)-hydroxide carbohydrate complexes that was developed to overcome the limitations of previous IV iron preparations [4]. FCM is a very stable complex with a carboxymaltose shell enabling controlled, gradual release of iron within the macrophages of the Reticulo-Endothelial System (RES) [4] minimizing the release of labile iron into the serum [5]. Therefore, FCM can be administered at a single dose of up to 1 g iron in 15 min [6]. Moreover, FCM does not contain dextran or dextran derivatives and, thus, cannot induce DIARs [4,7], despite the fact that hypersensitivity reactions can occur to some extent [6]. Upon IV administration of FCM, iron is distributed to the Mononuclear Phagocyte System (MPS) in the liver, spleen, and in particular bone marrow, and is utilised effectively for red blood cells formation [8]. The efficacy and safety of FCM in correcting ID have been demonstrated in a wide range of indications in numerous clinical studies across diverse patient populations [6,9]. Our previous studies in non-anaemic rats have shown that FCM has a lower potential to induce oxidative/nitrosative stress and inflammation compared to sodium ferric gluconate and dextran-based IV iron preparations, such as iron dextrans, ferumoxytol, and iron isomaltoside 1000 [10–12].
Because FCM is a polynuclear iron-carbohydrate complex, more specifically a nanosized colloidal intravenous iron-based preparation, FCM can be included in the class of non-biological complex drugs (NBCDs) [13]. Due to their complex structure, NBCDs cannot be fully characterised by physico-chemical analyses and their therapeutic performance is largely defined by the manufacturing process [14]. As a consequence, assessment of follow-on products (or better ‘similar products’) developed with reference to such a NBCD should include comparative nonclinical and/or clinical studies that evaluate pharmacokinetics and pharmacodynamics [15]. With our non-anaemic rat model, we could distinguish between iron sucrose originator (IS, Venofer®, a model compound of the NBCD class) and several iron sucrose similars (ISSs) [16,17]. In India, a follow-on product of FCM, referred to as ferric carboxymaltose similar (FCMS is available. In this study, we assessed the potential of this FCMS to induce oxidative/nitrosative stress and inflammation in the non-clinical model and compared the results with those of iron sucrose, the established standard in this model.
Materials and Methods
Molecular weight distribution: Molecular weight distribution was measured by gel permeation chromatography [18] by the Quality Control Laboratory of Vifor (International) Ltd. (St. Gallen, Switzerland).
Animals and treatments: Animal experiments were approved by the Hospital Alemán Ethic Committee and the Teaching and Research Committee and were undertaken according to the NIH Guide for the Care and Use of Laboratory Animals. Animals were housed, fed, and treated with IV iron compounds (40 mg iron/kg body weight) or control solution (equivalent volume) as described previously [11] Briefly, rats were randomised with equal male-female distribution to receive FCMS (Encicarb®, lot LHA11001, Emcure Pharmaceutical, Hinjwadi, India) n=8, IS {Venofer®, Vifor (International) Ltd., St. Gallen, Switzerland} n=8, or saline solution (control) injections n=8, on days 0, 7, 14, 21 and 28. The investigators were blinded to the treatments. Blood and urine samples were collected as described previously [16]. Rats were sacrificed 24 hour after the last IV injection (day 29) and the liver, heart and kidneys were removed for further analyses.
This study included four additional groups treated with various ISSs. The results of these groups have been published separately and, thus, the IS and control group data have already been described elsewhere [17].
Blood pressure: At baseline and 24 hour after each IV iron administration, Systolic Blood Pressure (SBP) and Diastolic Blood Pressure (DBP) were measured by a non-invasive pressure device using volume pressure recording, CODA 2 (Kent Scientific Co., Torrington, CT) as described previously [16].
Haemoglobin, serum iron and transferrin saturation: Hb concentration was determined by SYSMEX XT 1800i (Roche Diagnostic GmbH, Mannheim, Germany). Serum iron was assessed by colorimetric methods using an Autoanalyser Modular P800 with corresponding reagents (Roche Diagnostic GmbH, Mannheim, Germany). Serum transferrin was determined by radial immunodiffusion (Diffu-Plate, Biocientifica S.A., Buenos Aires, Argentina). Transferrin saturation (TSAT, %) was calculated with the following equation: serum iron concentration (μg/l)/total iron binding capacity (μg/l) ×100.
Liver enzymes and kidney parameters: Liver enzymes Aspartate Aminotransferase (AST), Alanine Aminotransferase (ALT), and Alkaline Phosphatase (ALP), were assessed in the blood samples by colorimetric and ultraviolet (UV) methods using an Autoanalyser Modular P800 (Roche Diagnostic GmbH, Mannheim, Germany). Aliquots of urine and sera were assessed for creatinine with the enzymatic UV method (Randox Laboratories Ltd., Crumlin, Northern Ireland) and standard formula was used to calculate creatinine clearance (CrCl). Sulfosalicylic acid method was used to detect proteinuria.
Oxidative stress markers: Samples of the whole liver, heart and kidneys were homogenised in ice cold 0.25 M sucrose solution (1:3, w:v) for the determination of. glutathione (GSH), Cu, Zn superoxide dismutase (Cu, Zn-SOD) and glutathione peroxidase (GPx), and homogenised in 0.05 M sodium phosphate buffer (pH 7.4; 1:10, w:v) for the determination of catalase as described previously [10,16].
Light microscopy, immunohistochemistry and morphometric analysis: Preparation of tissue samples, immunolabelling of specimen, and light microscopy were carried out as described previously [10,11,16]. Iron(III) deposits were quantified with Prussian blue staining. Ferritin was quantified with a goat polyclonal anti-ferritin L antibody (sc-14420, Santa Cruz Biotechnology, Santa Cruz, CA, USA). Markers of inflammation, nitrosative stress and apoptosis were quantified with antibodies against tumour necrosis factor-alpha (TNF-α interleukin-6 (IL-6), nitrotyrosine and caspase 3. Histological sections were studied by an image analyser, Image-Pro Plus 4.5 for Windows (Media Cybernetics, LP Silver Spring, MD, USA). Morphological analyses were performed at magnifications of 100, 400 or 1000 by two blinded, independent observers. Mean values of iron(III) deposits, tissue ferritin, TNF-α, IL-6, nitrotyrosine (percentage of area with positive staining/mm2) and caspase 3 (number of cells with positive staining /mm2) were calculated for each rat.
Statistical Analysis
All statistical analyses were performed as described previously [17]. Values are expressed as mean±SD and a p-value <0.05 was considered significant.
Results
Molecular weight distribution of FCMS: The weight average molecular weight (Mw), number average molecular weight (Mn) and polydispersity (P) of the two FCMS lots (LHA11001/BVB13001) were 129/111 kDa, 95.6/85 kDa, and 1.35/1.31, respectively. The Mw, Mn and P of the two FCMORIG lots (073093/077585) were 157/141 kDa, 94.7/89.5 kDa, and 1.66/1.57, respectively (see supplementary material S1).
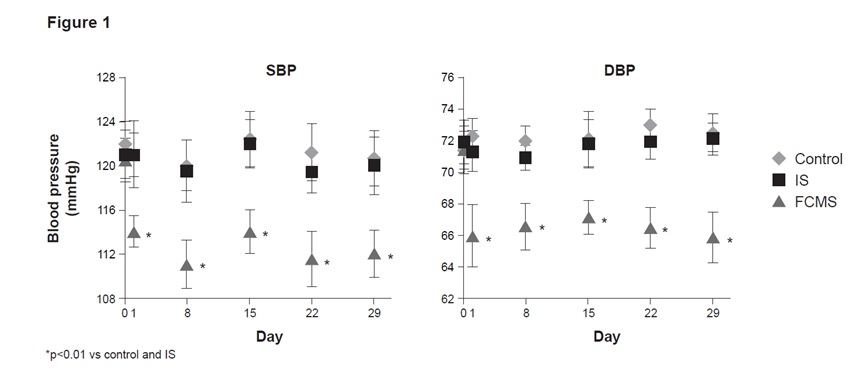
Blood pressure measurements: A significant decrease (p<0.01) both in systolic (SBP) and diastolic blood pressure (DBP) was recorded in the FCMS group compared to the control and the IS throughout the study. The blood pressure values in the IS group were comparable to those of the control group [Table/Fig-1].
Systolic (SBP) and diastolic (DBP) blood pressures. Animals were treated weekly with 40 mg iron/kg body weight iron sucrose (IS) or ferric carboxymaltose similar (FCMS), or with saline solution (control). Data are shown as mean ± standard deviation (n = 8)
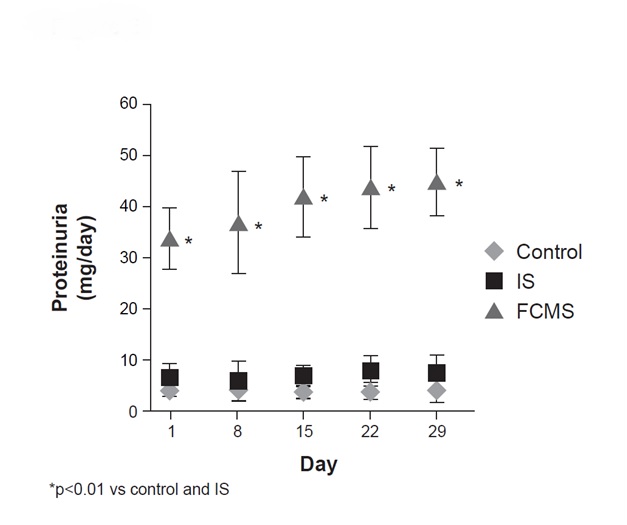
Liver and kidney function: AST, ALT and ALP were significantly increased (p<0.01) in the FCMS group compared to the IS and control groups throughout the study [Table/Fig-2]. Creatinine Clearance (CrCl) did not differ significantly between the groups on days 1, 8 and 15. On days 22 and 29, CrCl was significantly lower (p<0.01) in FCMS-treated animals than in IS-treated animals or in the control group [Table/Fig-2]. IS treatment increased proteinuria only slightly during the study period, but FCMS treatment resulted in significantly higher (p<0.01) levels of proteinuria throughout the study [Table/Fig-3].
Body weight, blood iron parameters, liver enzymes and creatinine clearance (CrCl). Animals were treated weekly with 40 mg iron/kg body weight iron sucrose (IS) or ferric carboxymaltose similar (FCMS), or with saline solution (control). Data are shown as mean ± standard deviation (n = 8) (*p<0.01 vs control)
| Control | IS | FCMS |
|---|
| Body weight (g) |
| Baseline | 238.5 ± 29.5 | 240.1 ± 25.5 | 242.4 ± 27.0 |
| Day 29 | 321.6 ± 30.4 | 316.8 ± 28.1 | 315.3 ± 29.9 |
| Blood iron parameters (baseline) |
| Hb (g/dL) | 15.7 ± 0.8 | 15.6 ± 0.9 | 15.7 ± 0.9 |
| Serum iron (μg/dL) | 295.7 ± 22.4 | 303.4 ± 21.6 | 298.5 ± 20.8 |
| TSAT (%) | 44.9 ± 3.8 | 44.7 ± 4.1 | 45.0 ± 3.9 |
| Blood iron parameters (day 29) |
| Hb (g/dL) | 15.8 ± 0.9 | 15.9 ± 0.8 | 15.8 ± 0.8 |
| Serum iron (μg/dL) | 299.0 ± 19.0 | 396.0 ± 32.0 | 509.0 ± 46.0* |
| TSAT (%) | 45.1 ± 3.1 | 70.5 ± 3.3 | 87.7 ± 4.8* |
| Liver enzymes (day 29) |
| AST (UI/L) | 118.9 ± 16.0 | 129.4 ± 13.0 | 205.5 ± 14.0* |
| ALT (UI/L) | 55.8 ± 11.0 | 59.5 ± 7.1 | 90.9 ± 12.0* |
| ALP (UI/L) | 519.8 ± 27.1 | 550 ± 23.0 | 728.6 ± 30.0* |
| CrCl (ml/min) |
| Day 1 | 2.95 ± 0.11 | 2.84 ± 0.13 | 2.93 ± 0.17 |
| Day 15 | 2.98 ± 0.14 | 2.76 ± 0.10 | 2.78 ± 0.20 |
| Day 29 | 3.03 ± 0.12 | 2.89 ± 0.12 | 2.39 ± 0.18* |
Proteinuria. Animals were treated weekly with 40 mg iron/kg body weight iron sucrose (IS) or ferric carboxymaltose similar (FCMS), or with saline solution (control). Data are shown as mean ± standard deviation (n = 8)
Iron parameters: As expected for non-anaemic rats, no significant differences were observed in the Hb concentrations between the control and IV iron-treated animals [Table/Fig-2]. Serum iron concentration and TSAT were significantly increased (p<0.01) in both IS- and FCMS-treated rats vs control. Both parameters were significantly higher (p<0.01) in FCMS- vs IS-treated rats [Table/Fig-2].
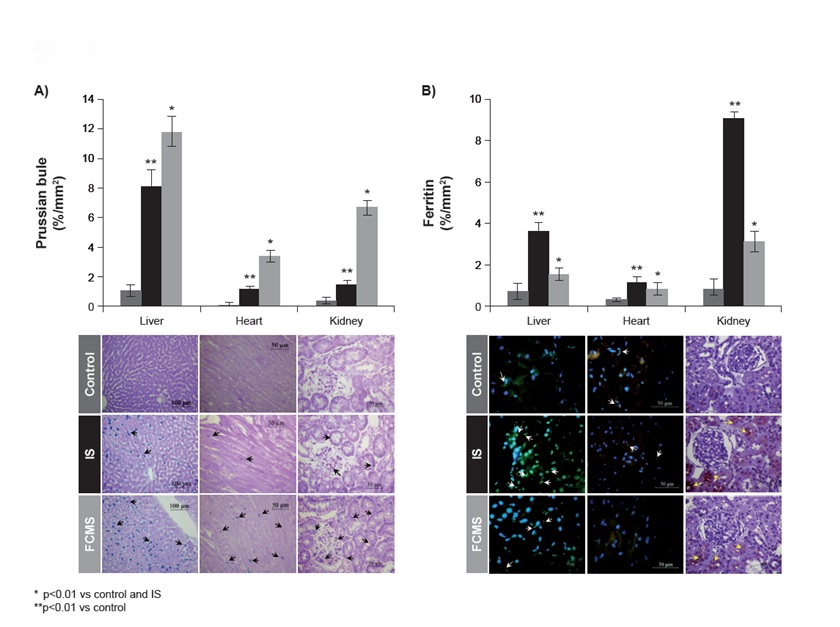
A significantly larger (p<0.01) area for iron(III) deposits [Table/Fig-4a] and L-ferritin [Table/Fig-4b] was observed in both IV iron-treated groups vs the control group. In general, FCMS-treated animals showed significantly higher staining for iron(III) deposits than IS-treated animals, whereas IS-treated animals showed significantly higher immunostaining for L-ferritin in all tissues compared to FCMS-treated animals. In the FCMS group, iron(III) deposits were located both in the Kupffer cells and hepatocytes, whereas in the IS group they were only present in the Kupffer cells [Table/Fig-4a]. In the heart, iron(III) deposits were found in the myocardium and in the kidney mainly in the cortex and in proximal tubular epithelial cells in both IV iron-treated groups [Table/Fig-4a].
Prussian blue (a) and ferritin (b) deposits on day 29. Animals were treated weekly with 40 mg iron/kg body weight iron sucrose (IS) or ferric carboxymaltose similar (FCMS), or with saline solution (control). Data are shown as mean ± standard deviation (n = 8)
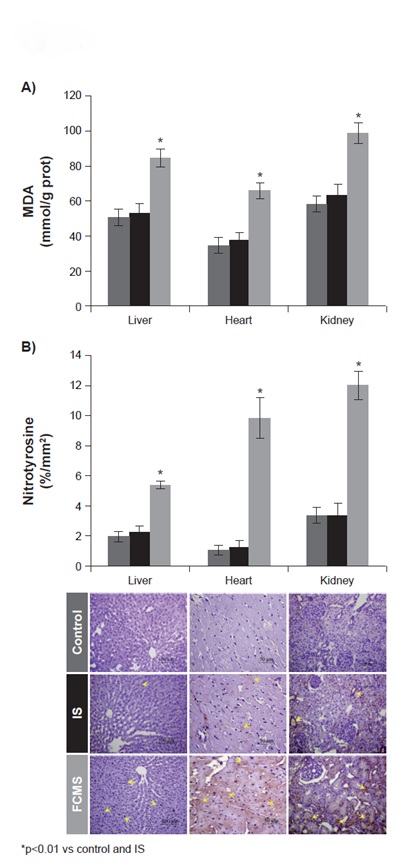
Oxidative stress markers: Lipid peroxidation was significantly increased (p<0.01) in all the tissues of FCMS-treated rats compared to the control and IS groups [Table/Fig-5a]. Activities of Cu, Zn-SOD, catalase and GPx were also significantly increased in all the tissues of FCMS-treated animals compared to the control and IS groups [Table/Fig-6]. Furthermore, GSH:GSSG was significantly lower (p<0.01) in the FCMS group than in the control or IS groups [Table/Fig-6].
Lipid peroxidation (a) and tyrosine nitration (b) on day 29. Animals were treated weekly with 40 mg iron/kg body weight iron sucrose (IS) or ferric carboxymaltose similar (FCMS), or with saline solution (control). Data are shown as mean ± standard deviation (n = 8)
Oxidative stress markers in tissue homogenates on day 29. Animals were treated weekly with 40 mg iron/kg body weight iron sucrose (IS) or ferric carboxymaltose similar (FCMS), or with saline solution (control). Data are shown as mean ± standard deviation (n = 8)
| Control | IS | FCMS |
|---|
| Liver |
| Cu, Zn-SOD (U/mg prot) | 5.0 ± 0.4 | 5.7 ± 0.7 | 10.6 ± 0.8* |
| Catalase (U/mg prot) | 243.9 ± 21.0 | 258.2 ± 24.0 | 400.3 ± 30.9* |
| GPx (U/mg/prot) | 258.7 ± 19.3 | 269.1 ± 21.0 | 383.5 ±17.1* |
| GSH:GSSG | 7.9 ± 0.6 | 7.5 ± 0.5 | 3.8 ± 0.5* |
| Heart |
| Cu, Zn-SOD (U/mg prot) | 10.3 ± 1.2 | 10.6 ± 1.1 | 15.9 ± 0.9* |
| Catalase (U/mg prot) | 25.1 ± 4.7 | 28.7 ± 3.8 | 53.5 ± 3.6* |
| GPx (U/mg/prot) | 139.9 ± 15.8 | 145.4 ± 19.0 | 227.7 ± 18.9* |
| GSH:GSSG | 6.8 ± 0.3 | 6.4 ±0.4 | 3.7 ± 0.3* |
| Kidney |
| Cu, Zn-SOD (U/mg prot) | 5.1 ± 0.7 | 5.3 ± 0.6 | 9.7 ± 0.8* |
| Catalase (U/mg prot) | 137.6 ± 9.8 | 142.5 ± 7.9 | 187.2 ± 8.8* |
| GPx (U/mg/prot) | 92.1 ± 8.2 | 98.4 ± 10.1 | 157.1 ± 10.8* |
| GSH:GSSG | 7.9 ± 0.7 | 7.6 ± 0.5 | 4.4 ± 0.5* |
*p<0.01 vs control
Tyrosine nitration: FCMS-treated animals showed significantly higher (p<0.01) immunostaining for nitrotyrosine in the liver (Kupffer cells), heart (interstitium and cardiomyocytes) and kidneys (tubular epithelial cells) than animals treated with saline [Table/Fig-5b]. IS-treated animals did not show any differences compared to the control group in any of the studied tissues.
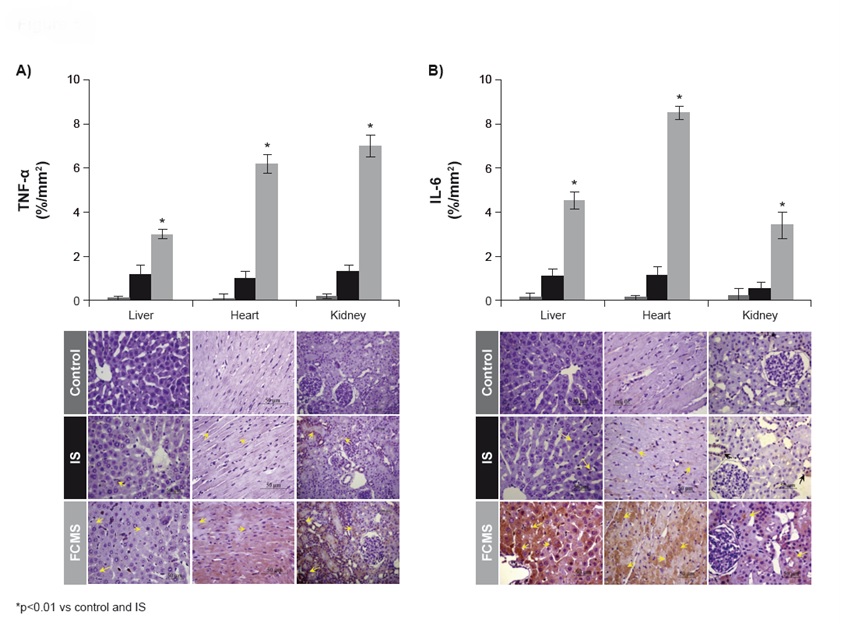
Proinflammatory markers: Both proinflammatory markers TNF-α [Table/Fig-7a] and IL-6 [Table/Fig-7b] were significantly increased (p<0.01) in the liver, heart and kidneys of both IS- and FCMS-treated animals vs control group. However, the levels were significantly higher in the FCMS group than in the IS group.
TNF-α (a) and IL-6 (b) on day 29. Animals were treated weekly with 40 mg iron/kg body weight iron sucrose (IS) or ferric carboxymaltose similar (FCMS), or with saline solution (control). Data are shown as mean ± standard deviation (n = 8)
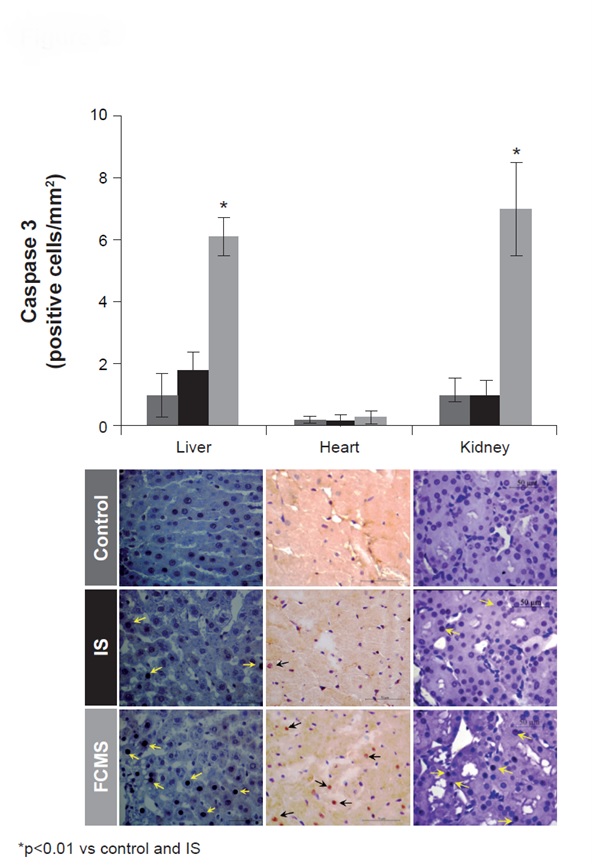
Apoptosis: Immunostaining for caspase 3 was significantly increased (p<0.01) in FCMS-treated animals in the liver, heart and kidneys compared to the IS and control groups [Table/Fig-8].
Caspase 3 on day 29. Animals were treated weekly with 40 mg iron/kg body weight iron sucrose (IS) or ferric carboxymaltose similar (FCMS), or with saline solution (control). Data are shown as mean ± standard deviation (n = 8)
Discussion
Polynuclear iron(III)-oxyhydroxide carbohydrate complexes for IV iron therapy cannot be fully characterised by physico-chemical analyses. Thus, regulatory authorities are considering the requirement of additional preclinical and/or clinical studies in order to show bioequivalence between an original and a copy [15,19]. The non-clinical model used in this study has allowed to identify significant differences in the potential of IS and ISSs to induce oxidative/nitrosative stress and inflammation [16,17] Moreover, the FCM originator (FCMORIG, Ferinject®) has shown effects comparable to those of IS in this model [10,11]. Thus, and due to the fact that IS has been tested numerous times in this model with highly reproducible results, IS was considered as internal standard [16–18].
In this study, administration of FCMS resulted in significantly higher levels of Transferrin Saturation (TSAT) and significantly higher Prussian blue-detectable iron(III) deposits in the analysed tissues than administration of IS. Moreover, levels of ferritin deposits in the FCMS group were much lower than in the IS group. Administration of FCMORIG has repeatedly resulted in TSAT values similar to those obtained with IS as well as in optimal tissue iron distribution indicated by increased ferritin levels in this rat model [10,11]. The unfavourable distribution of iron within the tissues of FCMS-treated rats suggests that iron from FCMS is able to bypass the regulated pathway through resident macrophages of the bone marrow, liver and spleen. The fact that administration of FCMS resulted in higher TSAT values may indicate the formation of larger amounts of non-transferrin-bound iron (NTBI), which may be taken up uncontrolled by the liver, heart and kidneys tissues [3].
The levels of oxidative and nitrosative stress markers, TNF-α and IL-6, as well as caspase 3 levels were all higher in the FCMS group compared to the IS and control groups. In addition, a comparison between the FCMS group of this study and a FCMORIG group of a previous study [11,12] show also higher levels for these markers in the FCMS-treated animals. We have previously reported similar results for various ISSs vs IS and postulated that the combined actions of NO•, TNF-α, and IL-6 may have contributed to the low ferritin levels and, concomitantly, to increased accumulation of iron not stored in ferritin [16,17]. Iron-induced toxicity is often linked to its suboptimal distribution and accumulation to non-hematopoietic tissues. In non-clinical iron overload models, iron has been shown to accumulate within lysosomes in hepatocytes [20], cardiomyocytes [21] and proximal tubular epithelial cells [22]. Lysosomal accumulation of iron may result in subsequent hydroxyl radical-mediated rupture of the lysosomal membrane and leakage of the lysosomal cargo into the cytoplasm, ensuing oxidative and nitrosative stress reactions as well as apoptosis [23]. Accordingly, it is not only the amount of labile iron that may lead to tissue toxicities, but also depends on the properties and metabolism of the administered IV iron preparation [3].
For NBCDs, the manufacturing process largely defines clinically-relevant properties, such as metabolism and biodistribution. The differences in the chromatograms between the FCMS and the FCM lots suggest that the two products are not identical, raising doubt on their equivalence as demonstrated in this study. In addition, the significant differences among the two FCMS lots indicate a manufacturing process that is not standardised. In contrast, the two randomly chosen lots of FCMORIG presented with almost identical chromatograms indicating a highly consistent manufacturing process. Thus, it is conceivable that specific physico-chemical properties of the FCMS complex may lead to differential responses in the macrophages, affecting degradation, release of iron and, ultimately, iron distribution as previously seen with very stable dextran-based IV iron preparations [3]. However, with the current knowledge it is not possible to point out the properties that influence the way how IV iron complexes are metabolised and thus, the fate of released iron.
Although not a direct comparison, it is evident from our results that FCMS does not have the same biological properties as FCMORIG. Clinical studies have reported differences in the efficacy [24] and safety [25,26] between IS and ISSs. Notably, a recently published Case Report described a hypersensitivity reaction which occurred upon injection of a 1 g iron dose of FCMS [27]. Despite the fact that, as recently concluded by an assessment of the European Medicine Agency [28], all IV iron products can induce hypersensitivity reactions, the question remains whether the physico-chemical and biological differences between FCMS and FCMORIG could potentially have contributed to the hypersensitivity reaction following FCMS administration in the reported clinical case. Therefore, as suggested for other non-biological complex drugs [14], both pre-clinical and clinical data are required to demonstrate that FCMS has an appropriate and acceptable safety and efficacy profile and that the benefits outweigh the risks.
Limitation
A potential limitation of the presented study could be the absence of an iron-deficient diet group. However, the design of the study was focused on detecting differences in toxicity rather than efficacy of the different iron preparations.
Conclusion
In conclusion, FCMS had a less favourable safety profile than iron sucrose originator, in our rat model, adversely affecting iron deposition, oxidative and nitrosative stress, inflammatory responses, with impaired liver and kidney function.
*p<0.01 vs control