Iron deficiency anaemia is a major public health nutritional problem affecting all ages. Across the globe, 1.62 billion people are anaemic (24.8%), with the highest prevalence among preschool age children (47.4%) and pregnant women (41.8%). India has one of the highest prevalence of anaemia (74.3%) in the world in general population. Due to physiological changes during pregnancy, iron requirements increases, thus exacerbating the prevalence of anaemia. Among pregnant women anaemia prevalence of 58%-89.6% has been documented in the country [1–3]. It leads the world in prevalence of maternal deaths and also figures among first 10 countries in prevalence of estimated preterm births [4,5]. In the country, the major aetiological factors responsible for anaemia during pregnancy can be attributed to poor dietary iron consumption, low iron bioavailability in Indian diet. Moreover, blood loss due to malarial infection, hook worm infestation, and vitamin B12 deficiency make the situation dismal [6]. Maternal anaemia is one of the important factors which determines the pregnancy outcome and is responsible for increased incidence of premature births, low birth weight, and high perinatal mortality [7]. There are evidences of increasing trend in maternal anaemia [8], in spite of improvement in the health infrastructure [9]. The presence of these evolving trends in determining neonatal outcome suggests that their associational statistics may be fluid. In such a situation, it is imperative that the contemporary prospective studies keep abreast of this rapidly evolving pattern with perspective of standard neonatal outcome measures. In this study, we report the results of association between maternal haemoglobin levels and neonatal outcomes in a sample of urban pregnant women.
Materials and Methods
Participant and Study Design
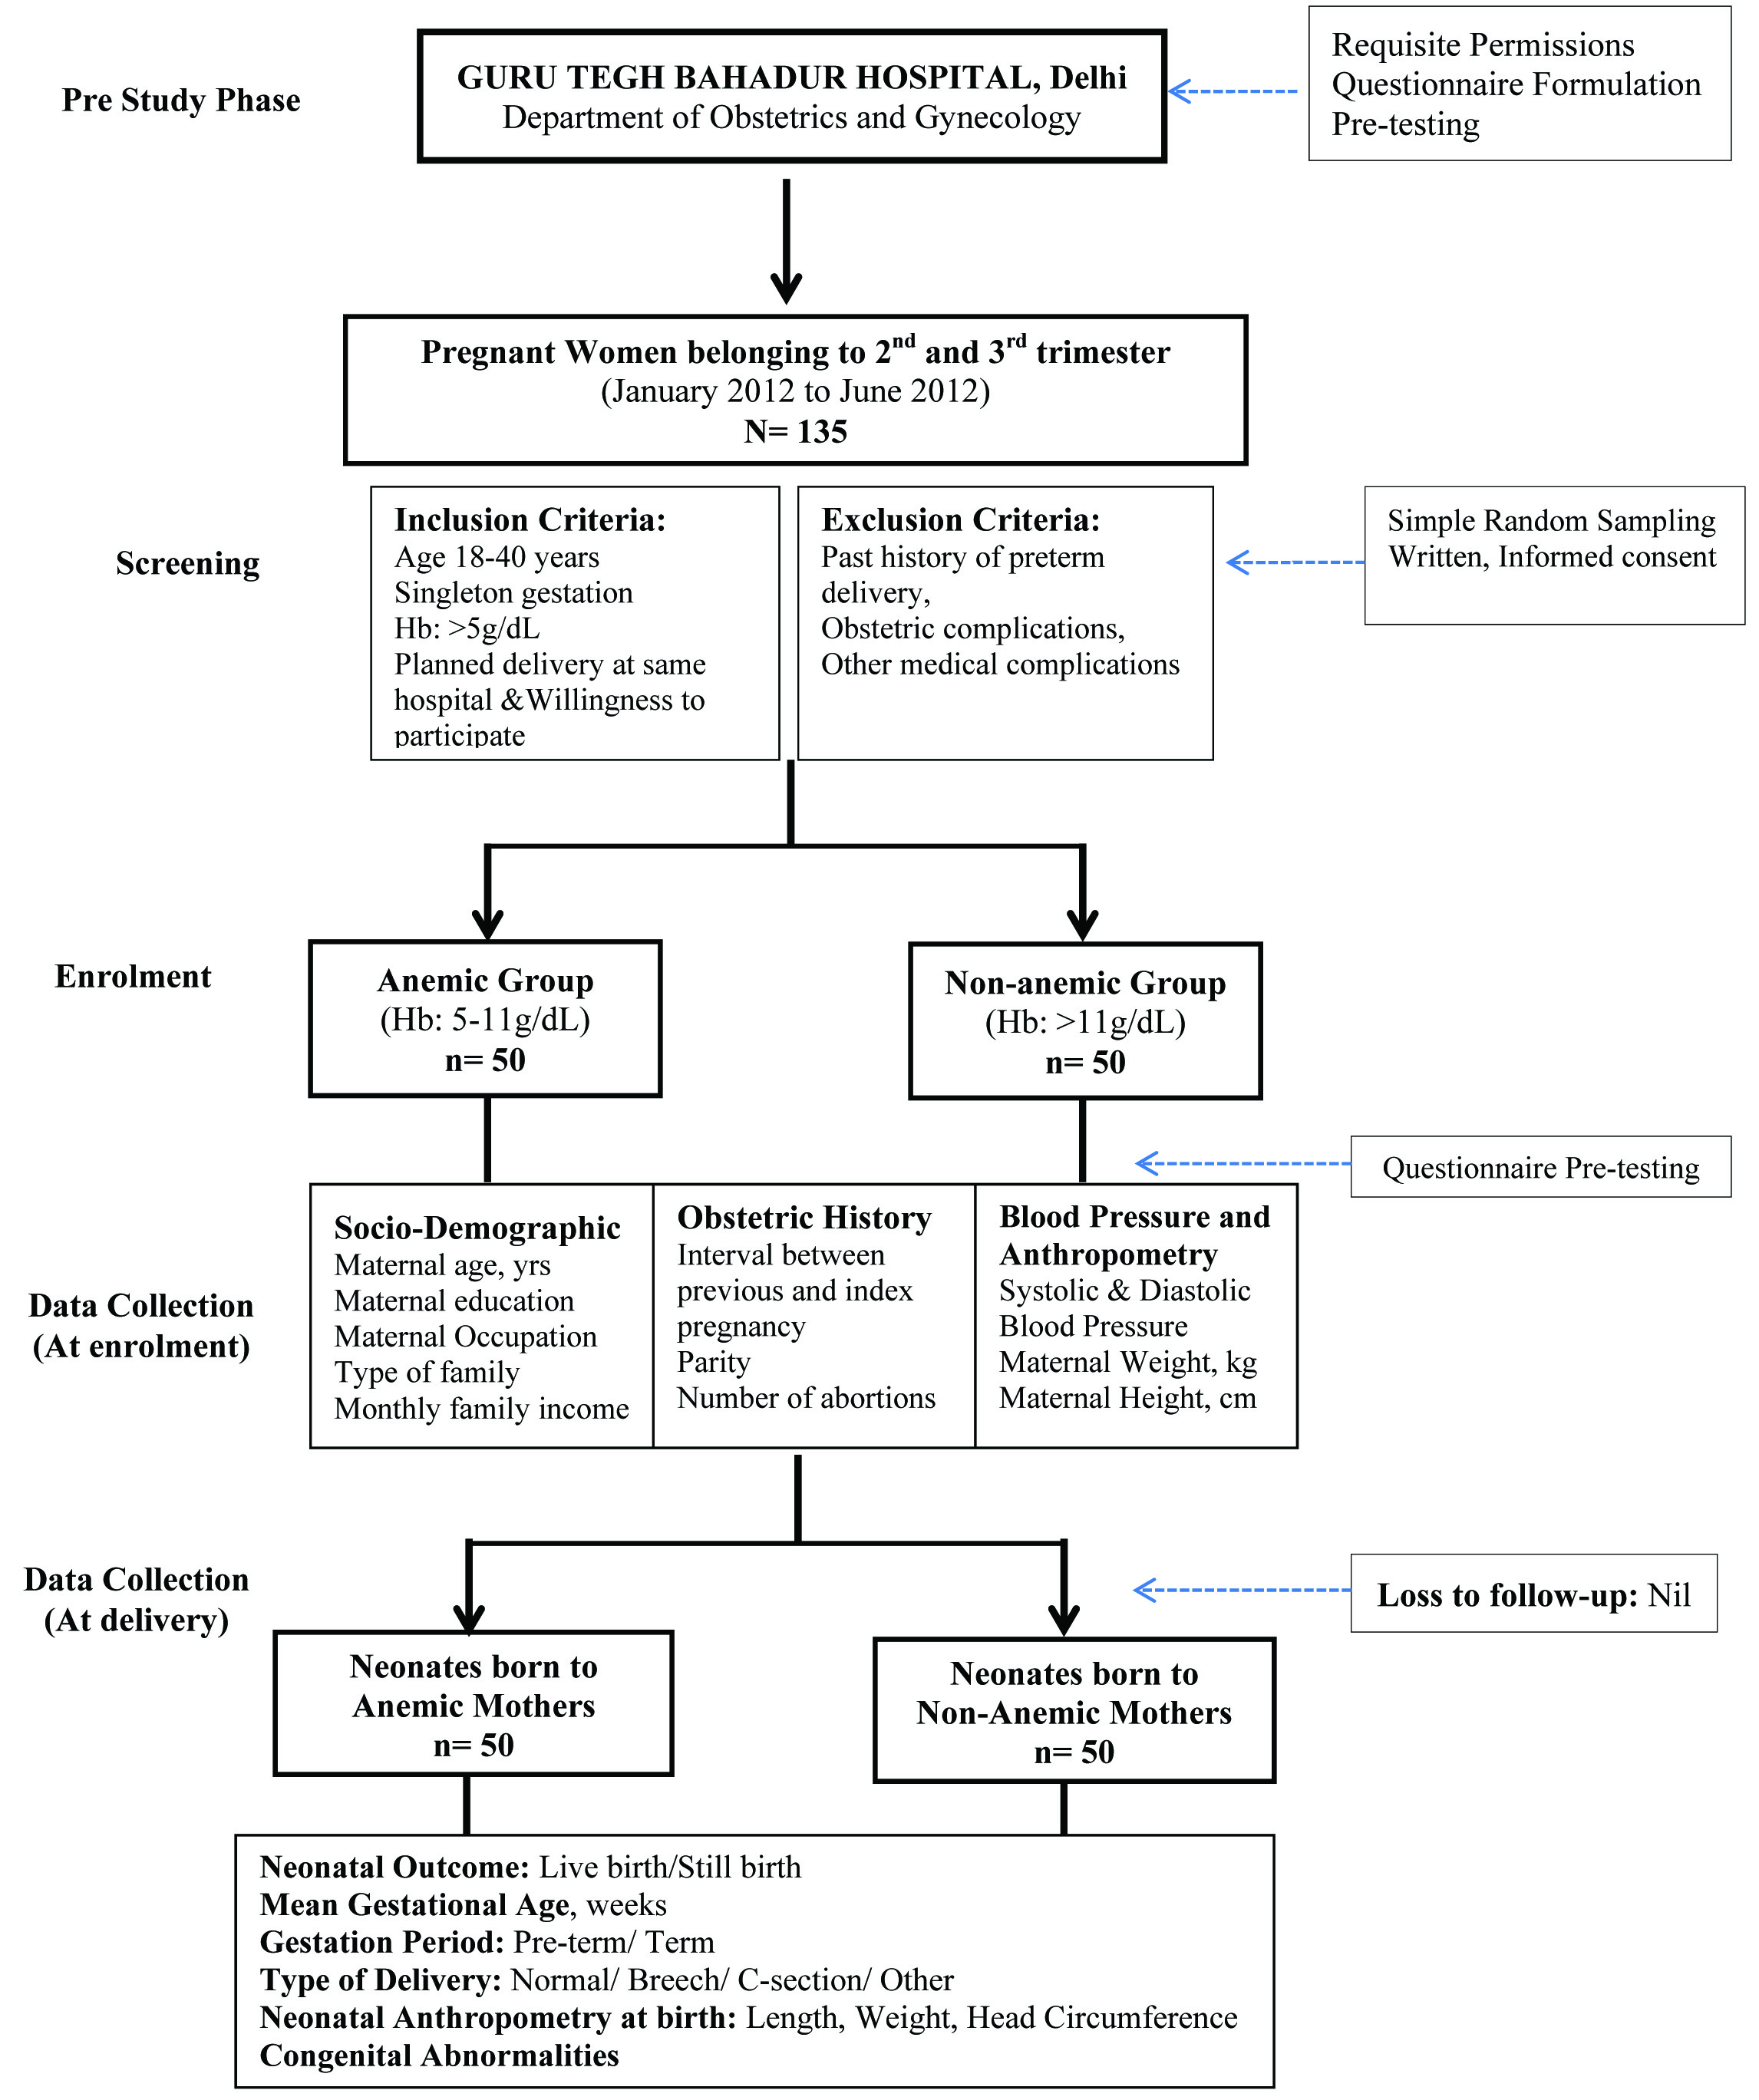
In this prospective cross-sectional study, associations of maternal haemoglobin (measured at 2nd - 3rd trimester) with neonatal outcomes were assessed among anaemic and non-anaemic pregnant women. Flowchart of the study is presented in [Table/Fig-1]. Pregnant women were screened and enrolled from Department of Obstetrics and Gynaecology, Guru Tegh Bahadur Hospital, Delhi, India during January-June, 2012. A total of 135 pregnant women were screened by the medical officer for enrolment. The inclusion criteria were: age 18-40 years; singleton gestation, and prospective plan of delivery at the same hospital. Those with history of preterm delivery, obstetric complications, and presence of other medical conditions except anaemia were excluded. The WHO’s anaemia classification and categorization was adopted for functional definition of haemoglobin conditions; anaemic (serum Hb 5-11g/dL), and non-anaemic (serum Hb>11g/dL) [10]. Requisite permissions in accordance with the institutional guidelines were acquired. Participant information sheet was given and signed understandable consent was obtained. Out of the initial screened and willing volunteers, 100 pregnant women (50 anaemic, 50 non-anaemic) were enrolled by purposive sampling. This ensured a sample which was almost in conformity with the pan-Indian prevalence of pregnancy related anaemia [3].
Study participant flow chart
Data Collection
Prior to data collection, pre-testing of questionnaire was done (n=10), which were excluded from the actual analysis. On the day of the participant’s scheduled ante-natal clinic visit, background information, socio-demographic, anthropometry, obstetric profile and diet preferences of the pregnant women were collected using questionnaire-cum-interview schedule. Blood pressure (measured by sphygmomanometer) was taken by the medical doctor. Maternal anthropometric measurements (height and weight) were taken using standardised techniques. Post-partum outcome of live birth, still birth, gestational age, congenital abnormality, type of delivery was collected. Gestational age was calculated from the first day of last menstrual period. Pre-term birth was defined as the delivery after 24 and before 37 completed weeks of gestation. Still birth was defined as the death of a live foetus during delivery process. At delivery, neonatal anthropometry (length, weight, head circumference) was measured at birth using standardised techniques within 24 hours of birth. Length was measured by infantometer upto 0.1cm, weight by electronic baby scale (0.1kg) and head circumference by non-stretchable tapes (0.1cm). Neonates with birth weight <2.5 kg were defined as those with low birth weight (1.50-2.49 kg), further sub-classifying the birth weight as very low birth weight (1.00-1.49 kg) and, extremely low birth weight (<1.0 kg).
Statistical Analysis
Stata 11 was used for statistical analysis. Descriptive analysis is presented as mean ± standard deviation (continuous variables) and frequencies for categorical variables. Univariate analysis including Student’s independent t-test, chi-square test was carried to determine differences between the groups at 5% level of significance. For further associations, Pearson’s correlation and multivariate linear regression were performed. In multivariate analysis, maternal Hemoglobin (independent variable) was considered as a continuous variable (g/dL) and this was associated with birth outcomes: birth weight, length and head circumference (dependant variables), adjusting for significant maternal confounders which might affect the birth outcomes.
Results
Socio-Demographic and Maternal Anthropometric Profile
[Table/Fig-2] shows the socio-demographic and anthropometric profile of the pregnant women at enrolment. The participating pregnant women were young adults in mid-twenties with normal average body mass index (BMI; kg/m2). Socio-demographic profile including respondent’s education, employment status, family structure and monthly family income (Rs) had no difference between anaemic and non-anaemic pregnant women but age differed between the groups. Majority of them belonged to low income group (57%) and were housewives (97%). Mean height (cm) and weight (kg) of anaemic pregnant women was lower as compared to non-anaemic women [Table/Fig-2].
Comparison of socio-demographic and anthropometric profile of anaemic and non-anaemic pregnant women.
| Variable | Anaemic Group (n=50) | Non-Anaemic Group (n=50) | p-value |
|---|
| Age (y) (mean ± SD) | 25.8 ± 3.8 | 24.0 ± 3.0 | 0.013* |
| Respondent’s Completed Education,n (%)IlliteratePrimaryH.Sec/Senior SecondaryGraduation | 12 (24.0)15 (30.0)21 (42.0)2 (4.0) | 10 (20.0)17 (34%)18 (36.0)5 (10.0) | 0.610# |
| Employment Status, n (%)EmployedHousewife | 1 (2.0)49 (98.0) | 2 (4.0)48 (96.0) | 0.558# |
| Family Structure, n (%)NuclearJointExtended | 16 (32.0)31 (62.0)3 (6.0) | 11 (22.0)33 (66.0)6 (12.0) | 0.370# |
| Monthly Family Income, Rs., n (%)< 1,9992000-39994000-59996000-79998000-9999>10,000 | -7 (14.0)25 (50.0)10 (20.0)1 (2.0)7 (14.0) | -7(14.0)18 (36.0)12 (24.0)6(12.0)7(14.0) | 0.298# |
| Height, cm (mean ± SD) | 152.2 ± 4.9 | 153.3 ± 5.6 | 0.318* |
| Weight, kg (mean ± SD) | 53.7 ± 8.5 | 56.9 ± 8.3 | 0.067* |
| Body Mass Index, kg/m2 (mean ± SD) | 23.1 ± 3.4 | 24.1 ± 3.0 | 0.119* |
* p-value for independent Students t-test; # p-value for chi-square test; significant results are shown in bold; all significances are measured at 5% level of significance
Obstetric Profile, Blood pressure and Haemoglobin
Detailed group-wise obstetric profile is presented in [Table/Fig-3]. The anaemic and non-anaemic group differed significantly in interval between previous & index pregnancy (p=0.031), parity (p=0.009), food preferences (p=0.003). Significant differences in parity was seen between the groups (p=0.009) with majority of the anaemic mothers were bi-parous (60.0%). Consumption of routine iron folic acid tablets was reported in both the groups. Expectedly, mean haemoglobin was significantly different between groups (<0.001) [Table/Fig-4]. Among anaemic pregnant women (n=50), none of the pregnant women were mild anaemic (Hb: 10.0-10.9 g/dL), whereas 78% were moderately anaemic (7.0-9.9 g/dL) and remaining had severe anaemia (5.0-6.9 g/dL). Comparatively lower systolic and diastolic blood pressure was observed in anaemic group (p<0.005) [Table/Fig-4].
Obstetric profile of anaemic and non-anaemic pregnant women.
| Variable | Anaemic Group(n=50) | Non-Anaemic Group (n=50) | p-value* |
|---|
| Interval between previous & index pregnancy, years, n (%)<11-22-3>3NA | 10 (20.0)19 (38.0)8 (16.0)5 (10.0)8 (16.0) | 23 (46.0)15 (30.0)2 (4.0)6 (12.0)4 (8.0) | 0.031 |
| Parity, n (%)Nulli paraPrimary paraBi-parousMulti-parous | 8 (16.0)12 (24.0)30 (60.0)- | 4 (8.0)26 (52.0)18 (36.0)2 (4.0) | 0.009 |
| Number of abortions, n (%)012>2NA | -36 (72.0)6 (12.0)-8 (16.0) | 1 (2.0)36 (72.0)8 (16.0)1 (2.0)4 (8.0) | 0.460 |
| Consumption of IFA tablets, n (%)YesNo | 38 (76.0)12 (24.0) | 40 (80.0)10 (20.0) | 0.667 |
| Food Habits, n (%)VegetarianNon-VegetarianOvo-Vegetarian | 14 (28.0)32 (64.0)4 (8.0) | 29 (58.0)21 (42.0)- | 0.003 |
* p-value for chi-square at 5% level of significance, significant results are shown in bold.
Maternal haemoglobin and blood pressure profile of anaemic and non-anaemic pregnant women
| Variable | Anaemic Group(n=50) | Non-Anaemic Group (n=50) | p-value* |
|---|
| Maternal Haemoglobin, g/dL (mean ± SD) | 7.8 ± 1.14 | 12.2 ± 0.69 | <0.001 |
| Systolic Blood Pressure, mmHg (mean ± SD) | 121.0 ± 12.31 | 126.6 ± 12.3 | 0.026 |
| Diastolic Blood Pressure, mmHg (mean ± SD) | 73.5 ± 9.5 | 80.2 ± 20.6 | 0.042 |
* p-value for Students t-test for independent groups at 5% level of significance
Post-Partum Outcomes
None of the pregnant women had still birth, however mean gestational age was significantly lower in anaemic group (p=0.009) [Table/Fig-5]. Neonatal birth weight (p<0.01), length (p<0.01) and head circumference (p<0.01) were significantly higher in babies of non-anaemic mothers [Table/Fig-5]. Majority of the low birth weight neonates were born to anaemic women. There was no case of congenital abnormality in either of the group and most of the mothers had normal delivery (82%).
Post-partum neonatal outcomes among anaemic and non-anaemic pregnant women.
| Variable | Anaemic Group (n=50) | Non-Anaemic Group (n=50) | p-value* |
|---|
| Neonatal Outcome, n (%)Live BirthStill Birth | 50 (100.0)- | 50 (100.0)- | 1.000 |
| Gestational Age, weeks (mean ± SD) | 35.7 ± 3.84 | 37.5 ± 2.50 | 0.009 |
| Gestation PeriodPre-term (<37 weeks)Term (>37 weeks) | 22 (44.0)28 (56.0) | 15 (30.0)35 (70.0) | 0.147 |
| Birth Weight, kg (mean ± SD) | 2.2 ± 0.69 | 2.5 ± 0.48 | 0.004 |
| Birth WeightNormal Birth Weight (>2.5 kg)Low Birth Weight (1.50-2.49 kg)Very Low Birth Weight (1.0-1.49 kg)Extremely Low Birth Weight (<1.0 kg) | 24 (48.0)17 (34.0)7 (14.0)2 (4.0) | 32 (64.0)17 (34.0)1 (2.0)- | 0.054 |
| Birth Length, cm (mean ± SD) | 44.5 ± 7.66 | 48.7 ± 3.32 | <0.001 |
| Head Circumference, cm (mean ± SD) | 30.9 ± 3.17 | 32.6 ± 1.22 | <0.001 |
| Congenital Abnormality, n (%)YesNo | -50 (100.0) | -50 (100.0) | 1.000 |
| Type of Delivery, n (%)NormalBreechForcepsCaesarean SectionOther | 41 (82.0)5 (10.0)3 (6.0)1 (2.0)- | 45 (90.0)2 (4.0)-2 (4.0)1 (2.0) | 0.214 |
*p-value for students t-test for independent groups at 5% level of significance
Post-Partum Outcomes: Correlations and Associations
In order to develop more confirmatory associations, relationship between maternal haemoglobin using it as a continuous variable was done [Table/Fig-6]. Pearson’s correlation with maternal haemoglobin (g/dL) and birth anthropometry showed significant positive correlation with all three birth outcomes: birth weight (p=0.043), length (0.0104) and head circumference (0.0032) [Table/Fig-6]. Univariate linear regression demonstrated statistically significant associations between maternal haemoglobin (g/dL) (independent variable) and neonatal birth outcomes (dependant variable): birth weight (p=0.004) (Model 1), length (p=0.010) (Model 2) and head circumference (p=0.003) (Model 3) [Table/Fig-7]. These were adjusted for only those maternal confounders (parity, gestational age, interval between previous and index pregnancy, systolic and diastolic blood pressure) which could probably affect the birth outcomes. Multivariate linear regression showed that for every 1g/dL increase in maternal haemoglobin level, birth weight increased by 0.044 kg (p=0.047), birth length by 0.261 cm (p=0.234) and head circumference by 0.152 cm (p=0.080). From all the confounders added in multivariate linear regression, gestational age was found to highly associated with all the three anthropometric birth outcomes (p<0.001) [Table/Fig-7].
Pearson’s correlation between maternal factors and birth outcomes: birth weight, length and head circumference.
| Maternal Factors | Birth Weight (kg) | Birth Length (cm) | Birth Head Circumference (cm) |
|---|
| Pearson’s Correlation | p-value | Pearson’s Correlation | p-value | Pearson’s Correlation | p-value |
|---|
| Haemoglobin (g/dL) | 0.2830 | 0.0043 | 0.2553 | 0.0104 | 0.2922 | 0.0032 |
| Body Mass Index (kg/m2) | 0.3204 | 0.0012 | 0.2455 | 0.0138 | 0.2897 | 0.0035 |
| Gestational Age (weeks) | 0.6057 | <0.001 | 0.5886 | <0.001 | 0.6623 | <0.001 |
| Systolic Blood Pressure (mm Hg) | 0.2705 | 0.0065 | 0.3136 | 0.0015 | 0.2435 | 0.0146 |
| Diastolic Blood Pressure (mm Hg) | 0.0952 | 0.3459 | 0.1387 | 0.1686 | 0.1258 | 0.2122 |
*Significant correlation depicted in bold; tested ay 5% level of significance
Univariate and multivariate linear regression of neonatal birth outcomes: birth weight (kg), length (cm) and head circumference (cm) (dependant variable) with maternal haemoglobin (g/dL) (independent variable) and other significant maternal, confounders
| Variables | Model 1Birth Weight (kg) | Model 2Length (cm) | Model 3Head Circumference (cm) |
|---|
| Co-efficient | p-value | 95%CI | Co-efficient | p-value | 95%CI | Co-efficient | p-value | 95%CI |
|---|
| Univariate Analysis |
| Maternal Haemoglobin* (g/dL) | 0.072 | 0.004 | 0.02-0.12 | 0.655 | 0.010 | 0.15-1.15 | 0.306 | 0.003 | 0.10-0.50 |
| Multivariate Analysis |
| Maternal Haemoglobin* (g/dL) | .043 | 0.05 | 0.000-0.086 | .265 | 0.230 | -0.171-0.720 | 0.152 | 0.082 | -0.019-0.324 |
| Parity (ranking increasing order) | .132 | 0.05 | -0.005-0.270 | 1.491 | 0.034 | 0.113-2.868 | 0.348 | 0.206 | -0.194-0.981 |
| Gestational age (weeks) | 0.094 | <0.001 | 0.061-0.127 | 0.986 | <0.001 | 0.657-1.316 | 0.464 | <0.001 | 0.334-0.594 |
| Interval between last and index pregnancy (yrs) | 0.019 | 0.606 | -0.056-0.095 | -0.416 | 0.278 | -1.174-0.341 | -0.028 | 0.850 | -0.327-0.270 |
| Body Mass Index (kg/m2) | 0.12 | 0.455 | -.0.020-0.046 | -0.059 | 0.729 | -0.396-0.278 | 0.005 | 0.933 | -0.127-0.138 |
| Maternal systolic blood pressure (mm/Hg) | .009 | 0.108 | -0.002-0.020 | 0.112 | 0.05 | -0.001-0.225 | 0.014 | 0.519 | -0.030-0.059 |
| Maternal diastolic blood pressure (mm/Hg) | -0.005 | 0.181 | -0.014-0.002 | -0.040 | 0.363 | -0.124-0.046 | -0.005 | 0.750 | -0.038-0.028 |
*Maternal haemoglobin taken as a continuous variable (g/dL); As birth outcomes are dependent on maternal haemoglobin and other confounders, thus birth weight, length and head circumference considered as dependent variables whereas maternal haemoglobin as independent variable; Multivariate linear regression: adjusted only for those maternal confounders who were found to be statistically significant tested either by Student’s independent t-test and/or Pearson’s correlation
Model1: Univariate Analysis Linear regression analysis associating neonatal birth weight (dependent variable) with maternal haemoglobin (g/dL);Multivariate Analysis Linear regression analysis associating neonatal birth weight (dependent variable) with maternal haemoglobin (independent variable) with other significant confounders; Model 2: Univariate Analysis Linear regression analysis associating neonatal birth length (dependent variable) with maternal haemoglobin (g/dL); Multivariate Analysis Linear regression analysis associating neonatal birth length (dependent variable) with maternal haemoglobin (independent variable) with other significant confounders; Model 3: Univariate Analysis Linear regression analysis associating neonatal birth head circumference (dependent variable) with maternal haemoglobin (g/dL);Multivariate Analysis Linear regression analysis associating neonatal birth head circumference (dependent variable) with maternal haemoglobin (independent variable) with other significant confounders
Discussion
The study highlights the adverse neonatal outcomes among anaemic and non-anaemic pregnant women. As understood by the results, maternal anaemia is a significant risk factor for neonatal birth weight, length, head circumference and gestational age. Univariate linear regression revealed significant associations for neonate birth weight, length and head circumference with maternal haemoglobin level [Table/Fig-6]. Likewise, earlier reports spanning almost last two decades indicate persistence in this relationship between maternal anaemia and low birth weight [11–14]. A meta-analysis summarizing 48 randomized controlled trials and 44 cohort (up till 2012) found that, for each 1 g/L increase in maternal haemoglobin, neonatal birth weight increased by 14.0 (6.8 to 21.8) g [11]. It is approximately double to that of our finding, 7.2g (2.0-12.0). This difference may be accounted by the bias from more representation of studies on high income group and/or malaria non-endemic area in the meta-analysis [11]. Our finding extends the knowledge of positive association between maternal haemoglobin and neonatal birth length [12]. The documentation of this result is important, because the most recent meta-analysis covering 44 cohort studies cites under report age of birth length. This limited power calculation for association between birth length and maternal anaemia and/or haemoglobin [11]. Some studies on Indian population, reported positive relation between maternal haemoglobin and crown heel length. These studies also report derivations similar to our findings on maternal haemoglobin level with head circumference [13,14].
Multivariate regression analysis revealed that parity was associated with neonatal birth weight and length [Table/Fig-7]. This is consistent with findings in Iranian population, where birth weight of the neonates increased significantly with parity [15]. Feleke and Enquoselassie (1999) reported significant association between parity and the birth weight of the neonates in Ethiopian population [16]. Shah et al., explained the similar theme with the help of more elaborate index of neonatal birth size. They reported that low birth weight, small for gestational age, reduction in birth weight were all significantly associated to nulliparity but not with multiparity/grand multiparity [17].
Maternal BMI was associated with neonatal birth weight [Table/Fig-6]. This was in spite of the nearly similar mean BMI (±SD) across groups [Table/Fig-2]. Elhassan et al., reported that low birth weight neonates had mothers with significantly lower BMI and majority (67%) were anaemic as well. However, in spite of these; the study didn’t find association between maternal BMI and birth weight. This may to do with usage of categorical rather than continuous measure of birth weight in regression analysis [18]. In the Indian population, Deshmukh et al., had also shown that maternal BMI is positively associated with birth weight [19]. Neonatal head circumference had significant correlation with maternal BMI [Table/Fig-6], which is nearly similar to earlier reports [20]. It is an important finding because, cognitive abilities of children are positively associated to head circumference at birth [21]. More so, and this relationship has been documented by few studies and need more future investigations.
A significant association between maternal systolic blood pressure (SBP) and neonatal birth weight was seen. An earlier work on hypertensive mothers had shown that higher SBP in clinically hypertensive range has negative effect on birth weight [22]. Higher BP has been shown to be associated with lower birth weight, smaller fetal head circumference and femur length [23]. However, our result of positive correlation between maternal SBP and neonatal birth weight, length and head circumference [Table/Fig-6] is seemingly at odds with these. But, the difference may be accounted by differential constitution of participant with respect to SBP range, method of BP measurement, differences in alcohol, smoking consumption and/or ethnicity. These studies had hypertensive and/or pregnancy related hypertensive participants, while our sample had normotensive participant mothers [23]. An increase of 1mm Hg in diastolic blood pressure (DBP) predicted 5g decrease in birth weight [Table/Fig-7]. This is almost very similar to the findings of a large epidemiological study on American population (n=28,095). The study reported that an increase of 1mm Hg in DBP was associated with 13.5g decrease in birth weight for blood pressure measurements during interval of 28-36 weeks [24].
This study describes an adverse association of low maternal haemoglobin with neonatal outcomes. No loss to follow-up or drop-outs of pregnant women added strength to the study. But sample size may be attributed as its limitation. However, the sample size of the study is still higher than two important Indian studies reporting relation between maternal anaemia and neonatal head circumference [13,14]. Despite this limitation, the findings of this work are similar to those of large sample sized studies [2]. This statistical conclusion of population representative behaviour with a small size is explained by the target population of our study. The majority of the Indian population is in low to middle income. So, a smaller section of sample derived from this group is more statistically favoured to represent the pan population behaviour.
More systematic cohort studies, with larger sample size, with addition measurement of maternal haemoglobin, iron, folic acid, Vitamin B12, mean corpuscular volume would help in more objective assessment of association between maternal anaemia and birth outcome. The continuously evolving trend in maternal anaemia prevalence necessitates that it should be closely documented at the changing associational dynamics with birth outcome.
Limitation
i. Maternal serum iron, folic acid, Vitamin B-12 could not be measured.
ii. Neonatal serum haemoglobin could have given stronger associations with maternal haemoglobin.
iii. Failed to measure APGAR score.
Conclusion
Maternal anaemia is a significant risk factor for adverse neonatal birth weight, length and head circumference.