Exploring Health Situation of Indian Children with Autism Spectrum Disorder Using Autism Treatment Evaluation Checklist (ATEC) in an Urban Area of Odisha: A Case Study
Amit Ghosh1, Preetam B. Mahajan2, Prabhas Ranjan Tripathy3, Biswa Ranjan Mishra4, Sushil Chandra Mahapatra5, Pranati Nanda6
1 Assistant Professor, Department of Physiology, All India Institute of Medical Sciences, Bhubaneswar, India.
2 Assistant Professor, Department of Community, All India Institute of Medical Sciences, Bhubaneswar, India.
3 Assistant Professor, Department of Anatomy, All India Institute of Medical Sciences, Bhubaneswar, India.
4 Assistant Professor, Department of Psychiatry, All India Institute of Medical Sciences, Bhubaneswar, India.
5 Professor, Department of Physiology, All India Institute of Medical Sciences, Bhubaneswar, India.
6 Additional Professor, Department of Physiology, All India Institute of Medical Sciences, Bhubaneswar, India.
NAME, ADDRESS, E-MAIL ID OF THE CORRESPONDING AUTHOR: Dr. Amit Ghosh, Assistant Professor, Department of Physiology, Assistant Professor, AIIMS, Bhubaneswar-751019, India.
E-mail: idamit2010@gmail.com
Introduction
Autism or Autism Spectrum Disorder (ASD) is a complex behavioural disorder in children with uncertain aetiology. Gastrointestinal metabolites have direct impact on brain function with possible role in its causation. Data on burden of Autism in India is sparse.
Aim
The aim of the study was to determine the extent of social, communication and behavioural impairment among children suffering from ASD patientsin Odisha.
Materials and Methods
A cross-sectional study design was used to assess 20 children with ASD in Odisha using an autism treatment evaluation checklist to understand the extent of social, communication and behavioural impairment in them. Of these, 72% children were diagnosed with ASD within 2 to 2.5 years of age and 38.9% patients suffered from diarrhoea together with constipation at the time of the study.
Result
There was moderate impairment in, subclasses I (Speech/language/ communication), II (sociability), III (sensory/ cognitive awareness) and overall score but mild impairment in subclass IV (i.e., health/ physical/behaviour). Possibly, the training programme of the school had positive impact on the behaviour and the health component. Severity of scores in subclasses was less in older children. There is need for training in order to improve the communication and social interaction domain of these children.
Conclusion
This study has provided valuable insight into the health situation of children with ASD. The study has been carried out using ATEC checklist. It points towards the need for training in order to improve the communication and social interaction domain of these children. It also reinforces the necessity to carry out further studies to explore possible link of gastrointestinal metabolites in causing ASD and age related changes in ATEC score of these children.
Body mass index, Behavioural disorder, GI disorder
Introduction
Autism or Autism Spectrum Disorder (ASD) is a complex behavioural disorder in children that either appear at birth or after a period of normal growth (regressive autism). Recent reports indicate that there are 67 million cases of ASD worldwide [1]. According to Centre for Disease Control, the prevalence of autism in USA increased from one in 150 to one in 68 children (aged 8 years) between 2000 and 2014 [2]. Among Asian countries, in South Korea the reported prevalence is approximately 1 in 38 children [3]. Improved diagnostic facilities could partly contribute to increased prevalence rates.
Even though multiple genetic (almost 10 gene) and non-genetic factors including environmental factors have been implicated, the exact causative agent is still unknown [4]. The increasing trends globally, mandate explorative studies to determine the role of some of these environmental factors. More recently, it has become apparent that gastrointestinal metabolites have direct impact on brain function and might be responsible for ASD [5].
In India, however there is no information on trends of autism. Lack of adequate diagnostic facilities; paucity of prevalence, burden of disease studies; low priority in research could be some of the challenges that will have to be addressed.
In 80-90% children with ASD, symptoms appear before the age of three and persist throughout their life span. They seem to develop normally until around 18 to 24 months of age and then they stop gaining new skills [6]. Currently the diagnosis rests on phenotypic expression like impairment in social interaction, impairment in communication and stereotyped behaviour. Available diagnostic methods include - Observation Schedule (ADOS-G), Childhood Autism Rating Scale (CARS), Autism Diagnostic Interview-Revised (ADI-R) and Autism Treatment Evaluation Checklist (ATEC) [7]. ATEC form has been developed by Autism Research Institute and it successfully studies the treatment effect and progress made over defined period of time [8]. Remarkably, ATEC scores also correlate well with the physical symptoms.
Though, there is an universally accepted diagnostic criteria and treatment evaluation method for ASD, it is important to realise that genetic diversity, cultural and environmental differences does influence the behavioural, social communication pattern in children suffering from ASD. In India, there appears to be a paucity of information regarding the extent of social, communication and behavioural impairment among children suffering from ASD patients. Through this study we intend to throw some light on these aspects in children with ASD from the city of Bhubaneswar, in an eastern state (Odisha) of India, using the ATEC check list.
Materials and Methods
A cross-sectional study was carried out between July 2014 and Dec 2014 among children with ASD attending ‘school for speech therapy’ and ‘school for ASD children’ at Bhubaneswar after obtaining ethical clearance from the institutional ethics committee. Out of 40 children attending these schools during this time, 20 were available for the purpose of the study. Since, these children with ASD were admitted to the school based on the diagnosis made by the respective treating paediatrician, it wasn’t necessary to independently verify the diagnosis using standard diagnostic criteria for the purpose of inclusion in the study. The inclusion criteria included children between 2 year and 20 year, non-usage of antibiotics or antifungal medication during the previous one month. Children with severe GI symptoms and enteric infections were excluded from the study. Data was gathered from caregivers of subjects using ATEC form. This one page form is designed to be completed by parents, teachers, or others who see the individual’s behaviour on a regular basis and evaluate them on 77 items. It consists of four subsets scales: I) speech/language/ communication (14 items—score range from 0 to28); II) sociability (20 items— score range from 0 to 40); III) sensory/ cognitive awareness (18 items— score range from 0 to 36); and IV) health/physical (25 items— score range from 0 to 75). Total score can be calculated by adding the score of four subset scale (range of the total scores 0 to 180). Higher the subscale and total score, the more impaired is the subject. If the score closes to or equals to zero, then it becomes difficult to distinguish the child from a non-autistic one and indicate full recovery [10]. [Table/Fig-1] shows the score range and percentile levels, whereas [Table/Fig-2] indicates important benchmark of the scoring and the levels of impairment.
Relationship of ATEC scores and percentile distribution of severity of Autism [9].
| Percentile | Mild autism | 0-9 | 10-19 | 20-29 | 30-39 | 40-49 | 50-59 | 60-69 | 70-79 | 80-89 | 90-99Severe autism |
|---|
| ATEC score | 0-30 | 31-41 | 42-50 | 51-57 | 58-64 | 65-71 | 72-79 | 80-89 | 90-103 | 104-179 | 180 |
Functional status of Autism as per the ATEC score and its correlation with the severity status as per percentile chart.
| ATEC score below 50 | Upto 19 percentile. ATEC<9 fare better, Behaviour more or less normal, able to carry out two way conversations |
| ATEC score between 51 and 103 | Between 20 and 79 percentile level. Child may lead semi-independent lives. |
| ATEC score >104 | More than 80 percentile level. Severely autistics. |
Statistical Analysis
Data was analysed using Microsoft excel 2013. Categorical data was presented using relative frequencies. Numerical data was summarised using mean, median and range. ATEC score was calculated for various subcategories using standard guidelines as mentioned above. Scatter diagram was used to visualise the relationship between BMI and ATEC scores. Categorical data were presented using bar charts wherever appropriate. Radar chart was used to display the performance in four categories under ATEC checklist.
Results
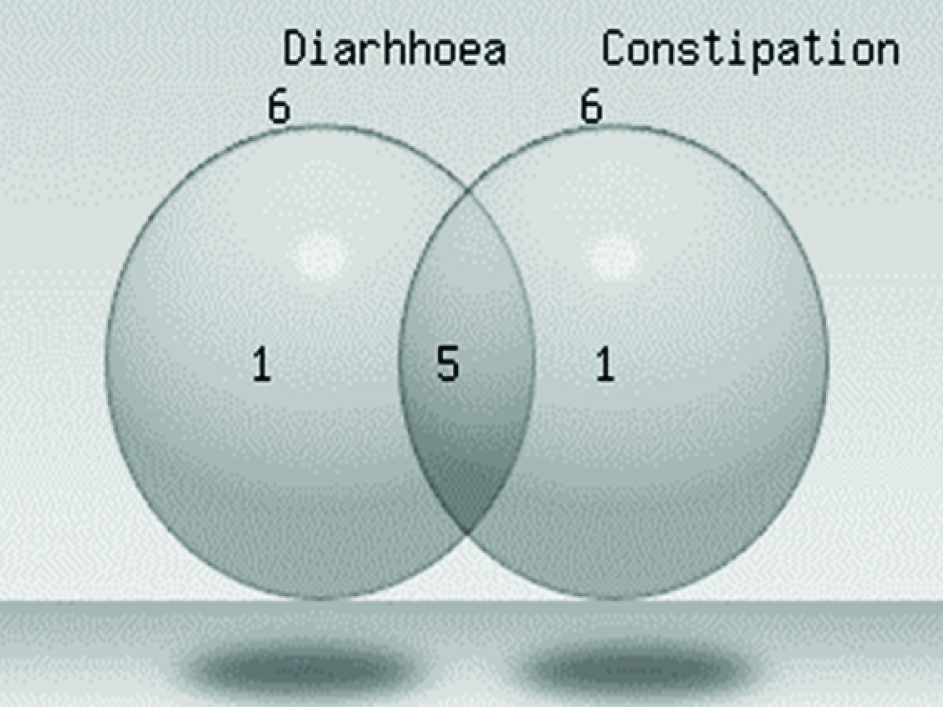
Twenty children in the age group 2 to 20 years participated in the study with male and female ratio of 3:2. Of these, 72% children were diagnosed with ASD within 2 to 2.5 years of age. None of these had severe GI symptoms, though 5 patients suffered from diarrhoea together with constipation, 6 ASD patients had either diarrhoea or 6 ASD patients had constipation [Table/Fig-3].
Venn diagram showing distribution of ASD children as per the gastro intestinal symptoms
The Median scores for each scale was computed and placed as per the percentiles to indicate severity and functional status in each of these domains as shown in [Table/Fig-1,2,4].
Distribution of calculated ATEC outcome scores in different scales as per the percentile ranking of severity of Autism.
| Sub Scale I | Sub Scale II | Sub Scale III | Sub Scale IV | Composite score |
|---|
| Percentile | Range:0-28 | Range:0-40 | Range:0-36 | Range:0-75 | Range:0-179 |
|---|
| Mild |
| 0-9 | 0-2 | 0-4 | 0-5 | 0-8 | 0-30 |
| 10-19 | 3-5 | 5-7 | 6-8 | 9-12 | 31-41 |
| 20-29 | 6-7 | 8-10 | 9-11 | 13-15 | 42-50 |
| 30-39 | 8-10 | 11 | 12-13 | 16-18 | 51-57 |
| 40-49 | 11-12 | 12-13 | 14-15 | 19-21 | 58-64 |
| 50-59 | 13-15 | 14-15 | 16-17 | 22-24 | 65-71 |
| 60-69 | 16-19 | 16-18 | 18-19 | 25-28 | 72-79 |
| 70-79 | 20-21 | 19-21 | 20-21 | 29-32 | 80-89 |
| 80-89 | 22-24 | 22-25 | 22-25 | 33-39 | 90-103 |
| 90-99 | 25-28 | 26-40 | 26-36 | 40-75 | 104-179 |
| Severe |
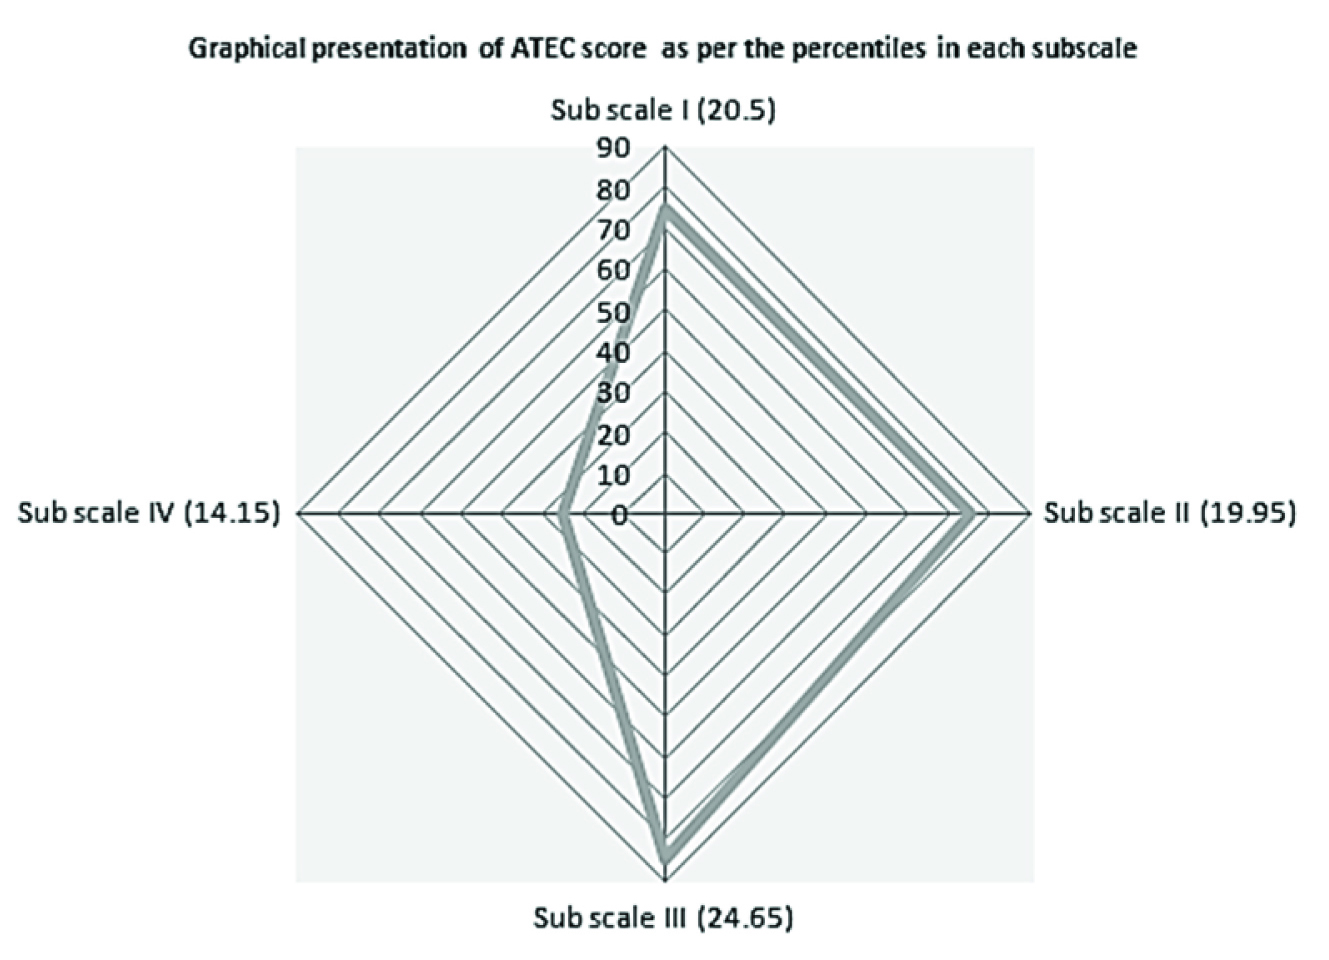
The mean value of score in each subclass and the median total score is shown in [Table/Fig-5]. Speech/language/communication, sociability and sensory/cognitive awareness scores were within the moderate and severe range, whereas health/physical/Behaviour was found to be in mild range. Average total score of autism in these subjects was found to be in moderate category.
Radar chart displaying relative position of ATEC scores for sub scales/subclass I to IV
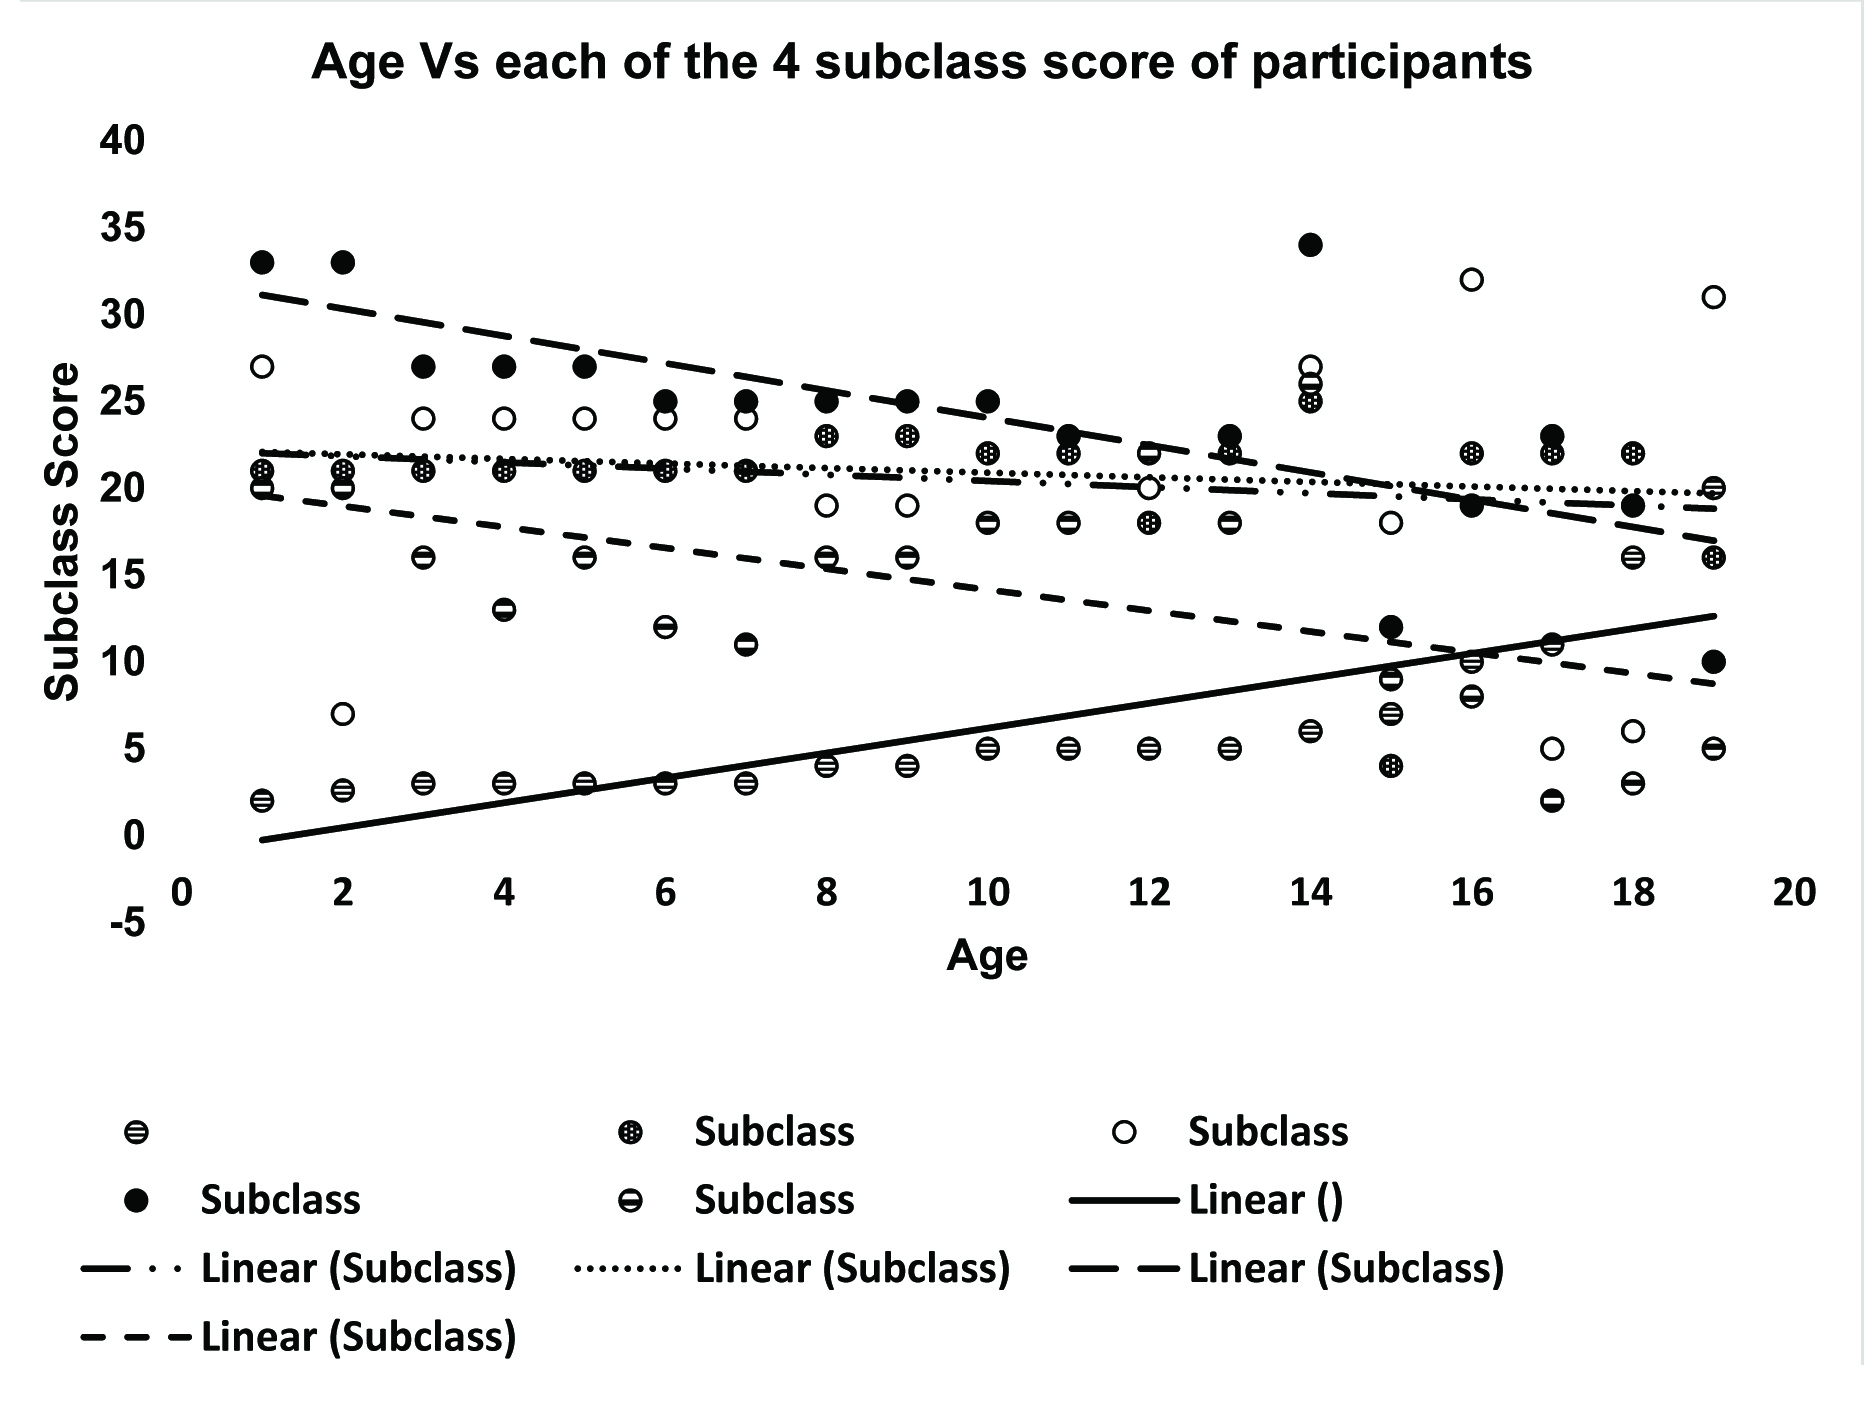
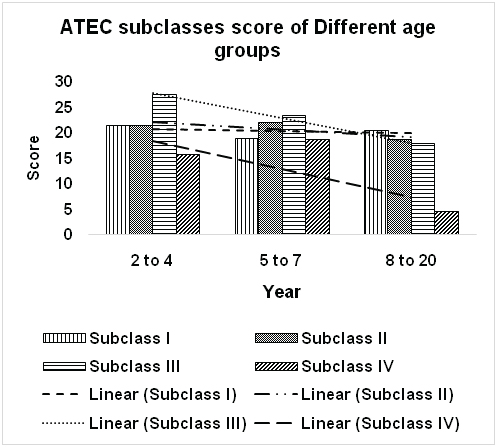
Different subclasses scores of ASD children varied with the age [Table/Fig-6]. This indicates the possibility that the brain activity of these ASD children could be changing with rising age. Variation of subscale scores noticed in 2-4 year, 5-7 year and 8-20 years range is being shown in [Table/Fig-7]. Interestingly, subscales do not vary much within the 7-12 years range [Table/Fig-6].
Variation of Subclass I to IV scores with age of the study population
Showing change of ATEC 4 subclasses score in ASD patients of 3 different age groups. [2 to 4 (n=9), 5 to 7 (n=6), 8 to 20 (n=5)]
Body Mass Index in Children with ASD: BMI was used to classify nutritional status of these children. BMI of majority of the ASD patients (63%) were not in the normal range. Forty seven percent of ASD children were underweight, and 15% were obese or overweight. BMI of most of these ASD patients within 1-7 year age were not in normal range.
Discussion
Autism is a developmental disorder, associated with difficulty in social interaction, impaired communication and repetitive behaviour. The difficulty in communication also causes social isolation. In this study multiple domain of autistic children behaviour was measured by ATEC check list. Result from this study [Table/Fig-4] indicate that the subjects had moderate impairment in, subclasses I, II, III and overall score but mild impairment in subclass IV (i.e., health/ physical/behaviour). Possibly, the training programme of the school had positive impact on the behaviour and the health component.
Though our study found that diarrhoea or constipation or both was common in 60% of the children with ASD, studies done elsewhere have reported up to 70% of children with ASD to have GI related symptoms including abdominal distension, pain, irritability, constipation, diarrhoea, feeding problem [11]. ASD are often associated with chronic inflammatory processes like nodular lymphoid hyperplasia (NLH), enterocolitis, mucosal infiltration of immune cells in small and large intestine [12].
Recently it has been reported that some factors in gut (metabolites, micro flora etc.) may influence ASD [5]. Intra cerebroventricular (ICV) infusions of enteric bacterial metabolite propionic acid (PPA) also induce ASD-like behaviour in rat [13]. PPA can cross the blood brain barrier. Different gut metabolites, like SCFAs (n-butyrate, acetate and propionate), neuroactive peptides of food and serotonin also influence ASD [5]. This could be studied in future studies in children with ASD.
It appears from the scatter gram of age and subclass ATEC scores that the severity of scores is less in older children. Longitudinal data is needed to comment on the relationship between age and ATEC scores and this is one of the limitations of this study. Recently several studies have reported age related changes in autism [14–18]. In autistic individuals, hippocampus (part of the limbic system) is neurologically immature. Hippocampus is responsible for the processing of all sensory input including auditory information. Besides this, hippocampus has a role in learning and memory [19,20]. Age related changes of hippocampus of autistic patients may be important target for treatment. Besides this, variations of gut metabolites along with gut microbiota might also be associated with age related changes and need to be explored further.
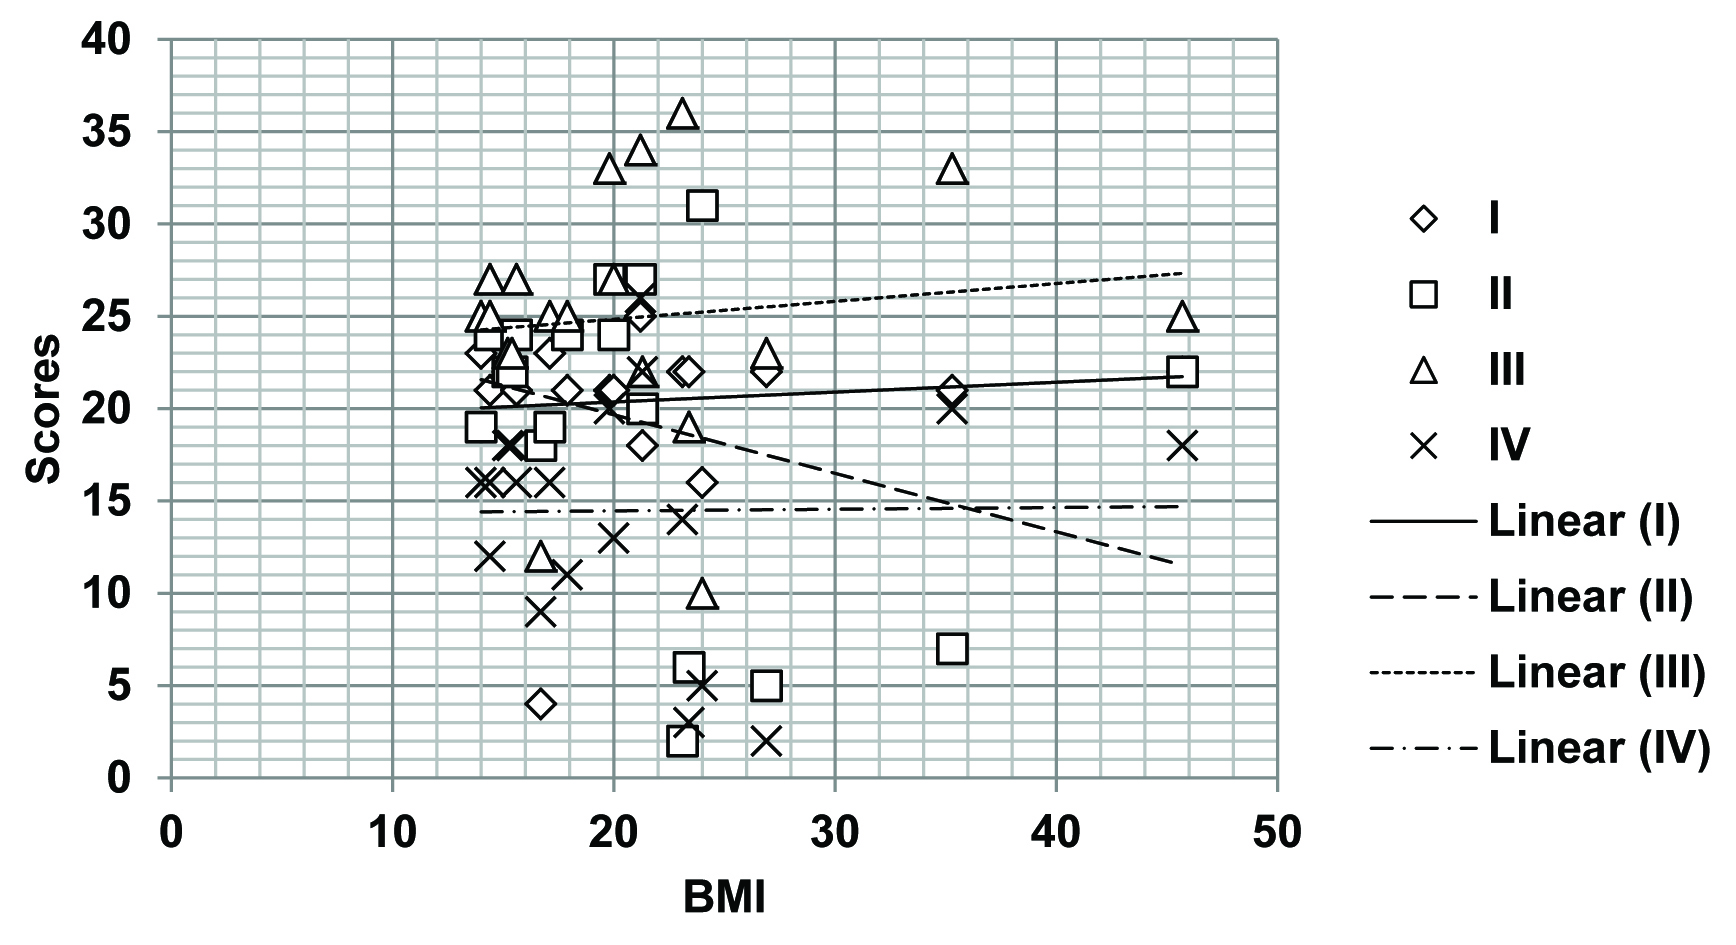
Prevalence of ASD along with growing rate of obesity has been reported from different study sites [21]. In this study, 63% of ASD participants had their BMI within abnormal range. There is positive correlation of BMI with ATEC subclass I, III and IV and negative correlation in case of Subclass II and total ATEC score [Table/Fig-8]. However, much cannot be interpreted from this study as most non ASD children in Indian subcontinent also suffer from malnutrition. The BMI and its association with ASD need to be explored in future studies using different approach.
Relationship between BMI and Subclass 1 to IV ATEC scores for the study population
Conclusion
This study has provided valuable insight into the health situation of children with ASD and paved way for further exploratory studies. Further research will be needed to study the extent to which training will improve the communication and social interaction domain of these children. It also reinforces the necessity to carry out further studies to explore possible link of gastrointestinal metabolites in causing ASD and age related changes in ATEC score of these children.
[1]. Kopetz PB, Endowed EDL, Autism worldwide: Prevalence, perceptions, acceptance, actionJ Soc Sci 2012 8:196-201. [Google Scholar]
[2]. Studies confirm validity of ATEC Report. Statistical Analyses: 2000 May 7. Available from http://www.autism.com/ind_atec_report [Google Scholar]
[3]. Baio J, Prevalence of Autism Spectrum Disorder Among Children Aged8 Years — Autism and Developmental Disabilities Monitoring Network, 11 Sites, United States, 2010. CDCMMWR Surveillance Summaries 2014 63(2) [Google Scholar]
[4]. Peart KN, Prevalence of Autism in South Korea Estimated at 1 in 38 ChildrenYale news 2011 [Google Scholar]
[5]. Chaste P, Leboyer M, Autism risk factors: genes, environment, and gene-environment interactionsDialogues Clin Neurosci 2012 14(3):281-92. [Google Scholar]
[6]. Ghosh A, Bandyopadhyay D, Nanda P, Mahapatra SC, Microbes-Gut-Brain Axis: A Possible Future Therapeutics Target for Gastrointestinal and Behavioral DisorderInternational Journal of Health Sciences and Research 2015 5(1):321-29. [Google Scholar]
[7]. Facts About ASDs [Internet]. CDC - Facts about Autism Spectrum Disorders - NCBDDD. [Cited 2015 Jun 17]. Available from: http://www.cdc.gov/ncbddd/autism/facts.html [Google Scholar]
[8]. Lord C, Risi S, DiLavore PS, Shulman C, Thurm A, Pickles A, Autism from 2 to 9 years of ageArch Gen Psychiatry 2006 63(6):694-701. [Google Scholar]
[9]. Geier DA, Kern JK, Geier MR, A Comparison of the Autism Treatment Evaluation Checklist (ATEC) and the Childhood Autism Rating Scale (CARS) for the Quantitative Evaluation of AutismJ Ment Health Res Intellect Disabil 2013 6(4):255-67. [Google Scholar]
[10]. Al-Ayadhi LY, Al-Drees AM, Al-Arfaj AM, Effectiveness of Auditory Integration Therapy in Autism Spectrum Disorders—Prospective StudyAutism Insights 2013 5:13-20. [Google Scholar]
[11]. Adams JB, Johansen LJ, Powell LD, Quig D, Rubin RA, Gastrointestinal flora and gastrointestinal status in children with autism–comparisons to typical children and correlation with autism severityBMC Gastroenterol 2011 11:22 [Google Scholar]
[12]. Walker SJ, Fortunato J, Gonzalez LG, Krigsman A, Identification of unique gene expression profile in children with regressive autism spectrum disorder (ASD) and ileocolitisPLoS One 2013 8(3):e58058 [Google Scholar]
[13]. Thomas RH, Meeking MM, Mepham JR, Tichenoff L, Possmayer F, Liu S, MacFabe DF, The enteric bacterial metabolite propionic acid alters brain and plasma phospholipid molecular species: further development of a rodent model of autism spectrum disordersJ Neuroinflammation 2012 9:153 [Google Scholar]
[14]. Dickstein DP, Pescosolido MF, Reidy BL, Galvan T, Kim KL, Seymour KE, Developmental meta-analysis of the functional neural correlates of autism spectrum disordersJ Am Acad Child Adolesc Psychiatry 2013 52(3):279-89.e16. [Google Scholar]
[15]. Padmanabhan A, Lynn A, Foran W, Luna B, O’Hearn K, Age related changes in striatal resting state functional connectivity in autismFront Hum Neurosci 2013 7:814 [Google Scholar]
[16]. Aoki Y, Kasai K, Yamasue H, Age-related change in brain metabolite abnormalities in autism: a meta-analysis of proton magnetic resonance spectroscopy studiesTransl Psychiatry 2012 2:e69 [Google Scholar]
[17]. Aoki Y, Abe O, Yahata N, Kuwabara H, Natsubori T, Iwashiro N, Absence ofage-related prefrontal NAA change in adults with autism spectrum disordersTransl Psychiatry 2012 2:e178 [Google Scholar]
[18]. Doyle-Thomas KA, Card D, Soorya LV, Wang AT, Fan J, Anagnostou E, Metabolic mapping of deep brain structures and associations with symptomatology in autism spectrum disordersRes Autism Spectr Disord 2014 8(1):44-51. [Google Scholar]
[19]. Kemper TL, Bauman ML, The contribution of neuropathologic studies to the understanding of autismNeurolClin 1993 11(1):175-87. [Google Scholar]
[20]. Bauman M, Kemper TL, Histoanatomic observations of the brain in early infantile autismNeurology 1985 35(6):866-74. [Google Scholar]
[21]. Wink LK, Early M, Schaefer T, Pottenger A, Horn P, McDougle CJ, Body mass index change in autism spectrum disorders: comparison of treatment with risperidone and aripiprazoleJ Child AdolescPsychopharmacol 2014 24(2):78-82. [Google Scholar]