Oral cancer is one of the major oral health issue faced in developing countries which may lead to death [1]. Oral squamous cell carcinomas (OSCC) arise in apparently normal oral mucosa, but may be are preceded by potentially malignant lesions especially erythroplakia, leukoplakia, speckled leukoplakia, or proliferative verrucous leukoplakia. Oral Leukoplakia (OL) is the best-known potentially malignant lesion which exhibits the histopathologic features of epithelial dysplasia. Oral Verrucous Carcinoma (OVC) is a rare and distinct malignancy which represents 1%-10% of all oral malignancies [2,3].
A difficulty always does exist in managing the potentially malignant lesions so as to assess which lesion will proceed to malignancy. The criteria to determine the future behaviour of potentially malignant oral mucosal lesions are mainly subjective. Histological grading of oral dysplasia has been the only method to determine the presence of potential malignancy and the risk of its progression into cancer. Pathologists differ in the emphasis they place on histopathological features and the interpretation of oral leukoplakia varies from one pathologist to another [4].
In the assessment of potentially malignant and malignant lesions, a great emphasis is placed on the changes of nuclear and cellular size. To overcome the reliability on the subjective examination, a more objective computer aided image analysis is necessary [5].
Keeping the above information in mind, the present study was undertaken to evaluate Cell Area (CA), Cell Diameter (CD), Nuclear Area (NA), Nuclear Diameter (ND) and to assess nuclear cytoplasmic ratio (N/C) in the parabasal and spinous layer of OL, OVC and OSCC with normal oral mucosa using computer aided image analyser software in H&E stained tissue sections.
Materials and Methods
This retrospective study was conducted on 40 tissue sections obtained from paraffin embedded archival blocks of patients diagnosed histologically as oral leukoplakia, oral verrucous carcinoma and oral squamous cell carcinoma. The control group comprised of normal oral buccal mucosa from healthy adult individuals, irrespective of age with no habits. The biopsies were obtained with their consent, from the Department of Oral Surgery, Sri Hasanamba Dental College and Hospital, in India.
The blocks were further divided in four groups as follows-
Group-I: Normal oral buccal mucosa (n=10).
Group-II: Patients diagnosed clinically as oral leukoplakia and histologically diagnosed as epithelial dysplasia (n=10) (all grades-based on WHO grading of epithelial dysplasia) [6].
Group- III: Patients diagnosed clinically and histologically as oral verrucous carcinoma (n=10).
Group- IV: Patients diagnosed clinically and histologically as oral squmous cell carcinoma (n=10) (all grades-Broder’s grading system) [7].
Tissue sections of 5μm thickness were cut using a soft tissue microtome from formalin –fixed, paraffin –embedded tissue blocks. The sections obtained were stained with Harris’s Haematoxylin & Eosin. The stained sections were observed under the microscope for confirmation of the diagnosis.
Interpretation of staining and selection of field: The H&E stained sections were scanned under low power (10 X) to determine the areas that was most evenly stained. Such representative fields were selected carefully in each slide and photographs at 40 X were taken.
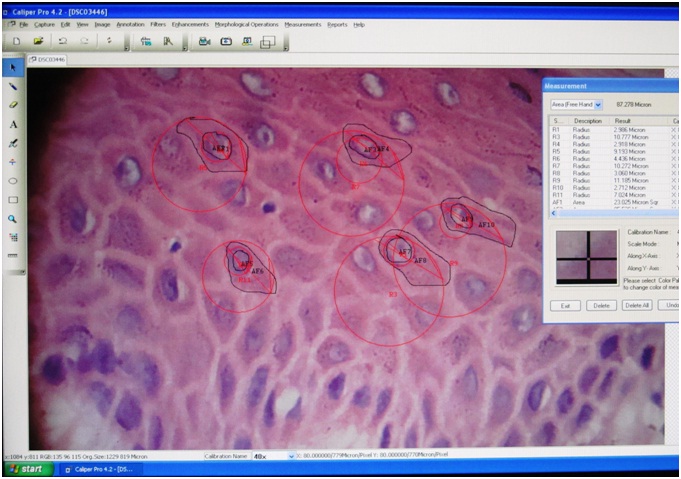
Image analyser software- Image analyser software (Caliper pro 4.2) is a sophisticated computer assisted quantitative morphometric technique used to investigate the cellular and nuclear changes in correlation with the histological behaviour of lesions. In this method, assessment of cytomorphometric parameters was done using computerized images of histological stained sections. The uploaded images were selected & calibrated to required magnification (40X in our study). Further images were reduced to 50% in each X and Y axis which was followed by selection of parameters such as area, radius from measurement table and software automatically gave the results.
Cytomorphometric Analysis
Equipments used
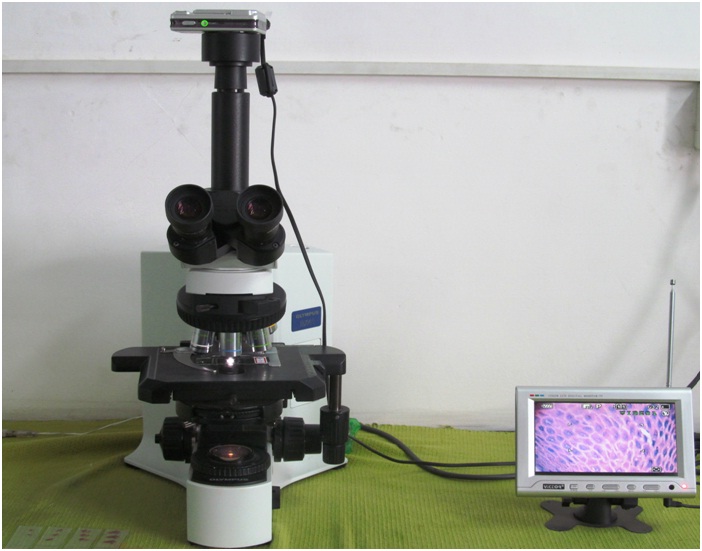
Olympus BX1 research microscope.
3 chip CCD Nikon cooplix L 21Digital camera.
Image analyser software (Caliper pro 4.2).
Slides prepared were examined under a research microscope under 10x objective (Olympus) and camera attached to it (Nikon) [Table/Fig-1]. Slides were carefully scanned for areas of cells, that was most evenly stained and images were taken randomly. Five cells from each image were selected and 10 images (40X) from each slide were taken. Therefore, 50 cells on each slide were randomly selected for examination. This procedure was carried for all ten slides for all four groups. The acquired images were transmitted to a video camera for display on a video monitor. A screen shot of each slide was captured, saved and transferred to the computer for image analysis [Table/Fig-2]. Cells were analysed for CA, CD, NA, ND, N/C in step wise manner, moving the slide from left upper corner to right and then down in order to avoid measuring the same cell again [Table/Fig-3,4,5 and 6]. For measurements, the software was calibrated (40 x) and scale setting was changed from square pixel to square microns and the instructions were followed as given in the manual of software for measuring the cell sizes. The nucleus and cell outlines (nucleus & cell perimeter) were traced for cell area and nuclear area –using free hand cursor on the screen to obtain cell area and nuclear area. Similarly cell radius and nuclear radius were obtained [Table/Fig-7]. Cell diameter, nuclear diameter were calculated manually. The nuclear cytoplasmic ratio was also calculated manually using formula-nuclear area/cytoplasmic ratio (cell area- nucleus area). The measurements were all in microns. All the data was entered to the excel sheet chart and was subjected for statistical analysis.
Showing image analyser software
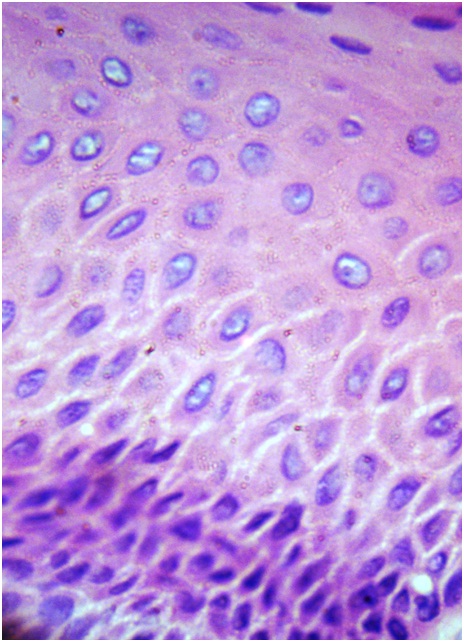
Normal oral mucosa under 40X magnification
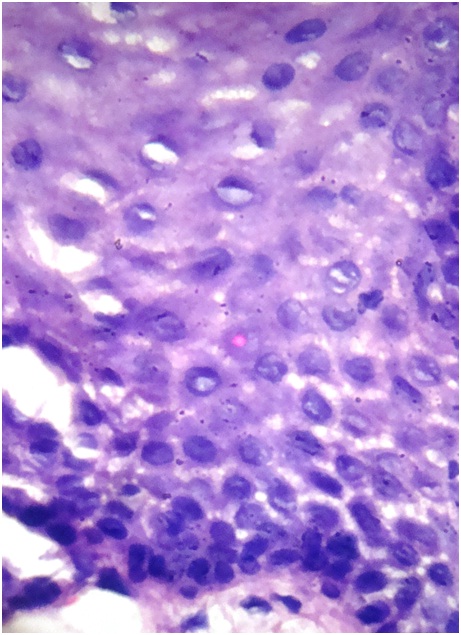
Oral Leukoplakia under 40X magnification
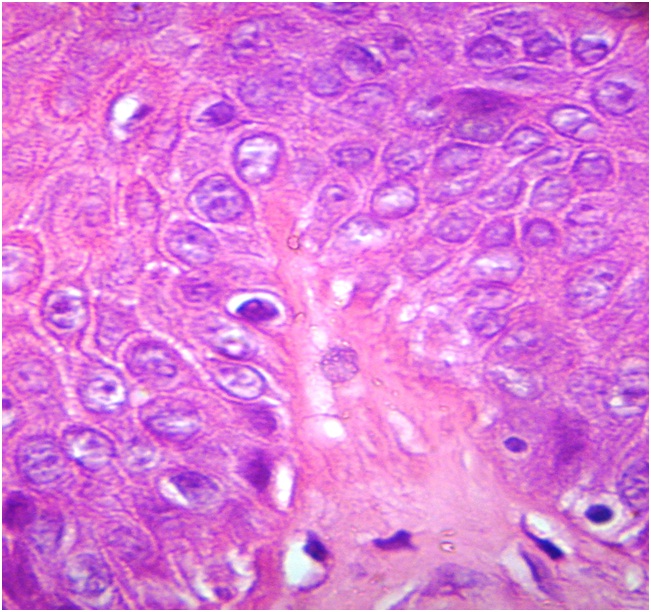
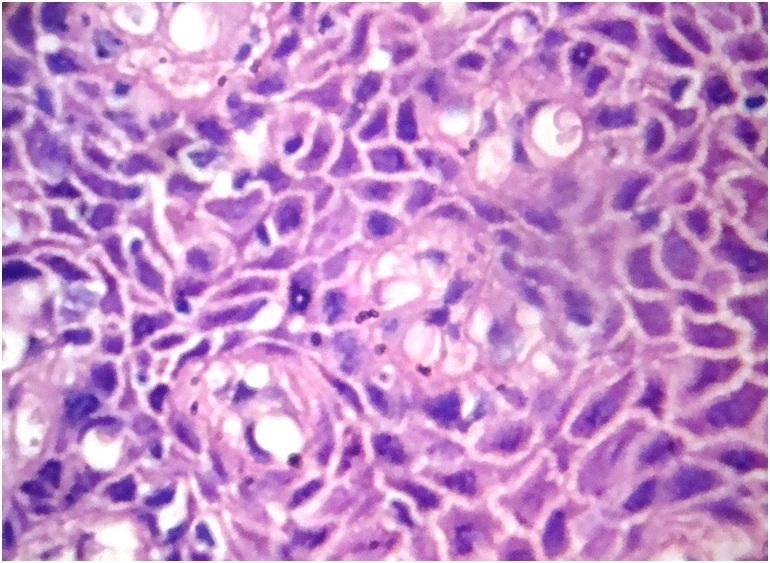
Oral Verrucous Carcinoma under 40X magnification
Oral Squamous Cell Carcinoma under 40X magnification
Descriptions of morphometric measurements
| Total sections |
|---|
| 10 normal oral buccal mucosa+ 10 OL + 10 OVC +10OSCC | 40 sections |
| Number of microscopic fields per section | 10 fields. |
| Number of cells measured per field | 5 cells. |
| Total cells per section | 5 cells x10 fields= 50 cells. |
| Total cells measured | 50 cells x40 sect =2000 |
| Total nuclei measured | 50 cells x40 sect =2000 |
| Total number of measurements | 4000 |
Statistical Analysis
The study and control groups were compared in terms of mean cellular diameter, mean nuclear diameter, mean cellular area, mean nuclear area and mean nuclear-cytoplasmic nuclear ratio using unpaired T-test. A correlation analysis was performed between the CA, CD, ND, NA and N/C at each time of point using one way ANOVA. The p-value less than 0.05 were considered as significant.
Results
Morphometric parameters such as CA, CD, ND, NA and N/C ratio of OL, OVC, OSCC were compared to normal oral mucosa in parabasal and spinous layers.
Comparison of nuclear diameter of normal oral mucosa, oral leukplakia, oral verrcous carcinoma and oral squamous cell carcinoma [Table/Fig-8]. Comparing mean nuclear diameter of OL, OVC and OSCC, there was definite increase in mean nuclear diameter in comparison to that of normal oral mucosa. ANOVA test was done for comparing between the groups and was found to be statistically significant (p<0.001).
Comparison of nuclear diameter of normal oral mucosa, oral leukplakia, oral verrcous carcinoma and oral squamous cell carcinoma.
| N | Mean | Std. Deviation |
|---|
| Normal | 500 | 6.5631 | 2.29868 |
| OL | 500 | 9.1676 | 2.40974 |
| OVC | 500 | 10.6926 | 3.06583 |
| OSCC | 500 | 11.2179 | 3.56746 |
| Total | 2000 | 9.4103 | 3.40038 |
N- total number of samples.
[Table/Fig-9] Comparison of cell diameter of normal oral mucosa, oral leukplakia, oral verrcous carcinoma and oral squamous cell carcinoma. Comparing mean cell diameter of OL, OVC and OSCC, there was mean decrease in cell diameter in comparison to that of normal oral mucosa. ANOVA test was done for comparisons between the groups and was found to be statistically highly significant (p<0.001).
Comparison of cell diameter of normal oral mucosa, oral leukplakia, oral verrcous carcinoma and oral squamous cell carcinoma
| N | Mean | Std. Deviation |
|---|
| Normal | 500 | 19.5445 | 3.36662 |
| OL | 500 | 16.6588 | 3.89610 |
| OVC | 500 | 15.7205 | 3.84504 |
| OSCC | 500 | 14.6909 | 4.17064 |
| Total | 2000 | 17.1537 | 4.21183 |
Comparison of nuclear area of normal mucosa, oral leukplakia, oral verrcous carcinoma and oral squamous cell carcinoma: [Table/Fig 10]. Comparing mean nucleus area of OL, OVC and OSCC, there was definite increase in mean nucleus area in comparison to that of normal oral mucosa, which was statistically highly significant (p<0.001)
Comparison of nuclear area of normal oral mucosa, oral leukplakia, oral verrcous carcinoma and oral squamous cell carcinoma
| N | Mean | Std. Deviation |
|---|
| Normal | 500 | 13.0377 | 3.24686 |
| OL | 500 | 21.9835 | 2.38693 |
| OVC | 500 | 35.1538 | 8.34105 |
| OSSCC | 500 | 64.4560 | 20.59295 |
| Total | 2000 | 33.6577 | 22.48398 |
Comparison of cell area of normal oral mucosa, oral leukplakia, oral verrcous carcinoma and oral squamous cell carcinoma [Table/Fig 11]. Comparing mean cell area of OL, OVC and OSCC, there was definite increase in mean cell area in comparison to that of normal oral mucosa. ANOVA test was done for comparisons between the groups and was found to be statistically highly significant (p<0.001).
Comparison of cell area of normal oral mucosa, oral leukplakia, oral verrcous carcinoma and oral squamous cell carcinoma
| N | Mean | Std. Deviation |
|---|
| Normal | 500 | 69.1221 | 8.28748 |
| OL | 500 | 72.0553 | 6.39325 |
| OVC | 500 | 93.1094 | 22.02453 |
| OSCC | 500 | 141.3860 | 39.74971 |
| Total | 2000 | 93.9400 | 37.15916 |
Comparison of nuclear cytoplasmic ratio of normal oral mucosa, oral leukplakia, oral verrcous carcinoma and oral squamous cell carcinoma: [Table/Fig 12]. Comparing mean nuclear cytoplasmic ratio of OL, OVC and OSCC, there was definite increase in mean nuclear cytoplasmic ratio in comparison to that of normal mucosa which was found to be statistically highly significant (p<0.001).
Comparison of nuclear cytolasmic of normal oral mucosa, oral leukplakia, oral verrcous carcinoma and oral squamous cell carcinoma
| N | Mean | Std. Deviation |
|---|
| Normal | 500 | 0.2331 | 0.05047 |
| OL | 500 | 0.4407 | 0.04281 |
| OVC | 500 | 0.6082 | 0.05925 |
| OSCC | 500 | 0.8092 | 0.08725 |
| Total | 2000 | 0.5229 | 0.22121 |
Discussion
Epithelial dysplasia is the term used to describe the histopathological changes seen in potentially malignant lesions of the oral mucosa. OSCC of the head and neck is a heterogeneous disease with complex molecular abnormalities. OVC is characterized with its broad border of pushing infiltration of a non-dysplastic squamous epithelium, displaying hyperkeratosis and elongated rete pegs [3,8].
There is lot of subjective variability in assessment of OL with inter examiner agreement and intra examiner reproducibility. Thus, there was a need for more objective means of assessment of OL. This interest turned towards applying sophisticated technique of computer assisted cytomorphometry to investigate the cellular and nuclear changes in correlation with the histological behaviour of the lesions. The results have been more reliable, objective and reproducible [5].
In our study comparing the normal oral buccal mucosa with OL, OVC and OSCC showed increase in NA, ND, CA, N/C which was consistent with other previous studies [9,10]. Similarly when comparing OL with OVC and OSCC, there was increase in NA, ND, CA and N/C ratio in OVC and OSCC, which was also in accordance with other previous study results [8].
Our study results concluded that- cytomorphometric parameters in image analyser software can act as a quantitative sophisticated tool to differentiate normal mucosa from OL, OVC and OSCC. We observed that, in all cases NA, ND, CA and N/C ratio were increased with CD decreased. Our study also showed nuclear parameters like NA, ND and N/C ratio as more important and authentic parameters rather than cellular parameters in diagnosis of potentially malignant and malignant lesions. We found that, there was increase in cellular and nuclear size with increased N/C in OL which can act as valuable objective means for assessment of OL and to predict their malignant potential quantitatively avoiding subjective bias. Results showed statistically significant difference in nuclear and cellular parameters between OVC and OSCC with increased nuclear cytoplasmic ratio in OSCC.
On contrary, few previous studies have showed decrease in CA & Increase in CD which is not in agreement with our study, where we found increase in CA & decrease in CD. However further studies on larger sample size has to be conducted for better results and reproducibility [11,12].
Smitha T et al., carried out a study on morphometry of the basal cell layer of oral leukoplakia and oral squamous cell carcinoma using computer –aided image analysis and concluded that morphomeric parameters like nuclear perimeter and nuclear area, cellular perimeter and cellular area gradually increased from normal oral buccal mucosa to leukoplakia, reaching highest value in OSCC [5].
Ragavendra TR et al., conducted a study of morphometric computer-assisted image analysis of parabasal and spinous layers oral epithelial cells in normal epithelium and oral leukoplakia [13]. They concluded that nuclear parameters showed a statistically significant change than cellular parameters in dysplasia. This study was consistent with our study results where nuclear parameters were significantly increased from normal to OL with increased N/C ratio in OL.
Conclusion
Based on the results of our study, cytomorphometric analysis is a fairly reliable and useful method to detect potentially malignant and malignant lesions from normal oral mucosa. Although there are number of techniques to diagnose potentially malignant lesions, none of them help us in identifying its prognostic significance. Overall our study concludes, technique of cytomorphometric image analysis offer an opportunity to quantify the nuclear and cellular parameters associated with potentially malignant and malignant tumours providing an objective basis for grading oral leukoplakia’s and malignant tumours.
N- total number of samples.