Alcohol is the second most energy dense macronutrient and has an appetite enhancing effect, which may lead to an increase in energy intake, inducing an increase in body mass index (BMI) [4,5]. As it is well known that obesity and overweight are major health problems in this era. It has been strongly related to risk of many chronic diseases like cardiovascular diseases, cancer, etc.
Alcohol’s effect on human body and its harmful implications are well known as well as its overall beneficial effects were also universally accepted like its cardioprotective effect, whereas its effect on body weight remains an enigma. A dual relationship exists, whereby a pattern of alcohol consumption may be beneficial while heavy drinking is detrimental. The aim of the study is to find the association between pattern of alcohol consumption and BMI.
Materials and Methods
Sample size & Source: A cross sectional study was conducted between December 2013-May 2014 among Five Health Institutions i.e., one Medical College, one Dental College, one Ayurvedha College, one Pharmacy College and one Nursing College. All health institutions in Bagalkot city were taken into consideration one college from each category (Medical, Dental, Ayurvedha, Pharmacy and nursing) were taken into study. As no Indian studies were available on this topic (i.e., alcohol consumption and its effect on BMI), the general prevalence of alcohol use among college students was considered for sample size determination. Based on study done by Khosla V et al., taking prevalence of 31.9% and relative precision of 15% the sample size was calculated using the formula n=4pq/d2 [6]. Thus the sample size estimated was 380 students. Data were collected in five health institutions, with total strength of 1900 students. Sample was collected in population proportion to each college.
After being approved by institutional ethical committee, a predesigned, semi structured questionnaire was used to collect the data. The questionnaire was validated via pilot study. Students less than 18 years and current smokers were excluded. After obtaining written consent the alcohol consumption, smoking history, pattern of food intake, other covariates and BMI were noted.
Measures
Alcohol Consumption: Alcohol consumption is the independent variable here. Students who had consumed atleast 12 drinks of any type of alcoholic beverage in their entire life and one or two drinks in the past 12 months were considered as current drinkers. Among current drinkers two variables were considered i.e., Quantity and Frequency [7].
First, Quantity (number of drinks consumed, on average, on drinking days) was categorised as 1,2,3 and ≥4 drinks / drinking day. Second, Frequency (number of drinking days in the past 12 month) was defined according to gender specific quintiles and categorised into five quintiles. Among males, quintile of frequency approximated as following categories: quintile-1, 1-11 drinking days/week; quintile-2, 1-3days/month; quintile-3, 1day/week; quintile-4, 2days/week; quintile-5, 3-7days/week. Among females, quintile of frequency approximated as following categories: quintile-1, 1-2 drinking days/week; quintile-2, 3-11days/year; quintile-3, 1day/month; quintile-4, 2-4days/month; quintile-5, 2-7days/week [7].
Smoking: Smoking status was determined by asking “Have you smoked at least 100 cigarettes in your entire life?” Respondents who replied “yes” were considered as current smokers and were excluded from the study. Respondents who had consumed more than 100 cigarettes in their life time but now have quit smoking and not have smoked for past 12 months were considered as abstainers and were included in the study [8].
Food Intake: Two things were considered here. First normal pattern of food intake, second food intake while alcohol consumption. For normal pattern of food intake, previous day diet history was used to assess the food intake. For food intake while drinking alcohol consumption, on an average drinking day, what is the normal pattern of food intake i.e., alcohol consumption in empty stomach, what is used to dilute the alcohol? type of snacks, average amount Of snack intake.
Covariates: Covariates include age, sex, place, socio economic status, current place of stay; leisure physical activity and family history of alcohol consumption were considered.
Statistical Analysis
Results were tabulated using Microsoft excel 2007. All analysis was performed using Open Epi, version 2.3.1. Results were presented in mean, standard deviation and proportions. Significance was tested using chi-square. Odds Ratio was calculated to find the association. For all practical purpose p-value less than 0.05 was considered as statistically significant.
Results
Out of 380 students 32.37% were boys and 67.63% were girls. The mean age of the study participants was 20.85 ± 1.20 years. In which 99 were current alcohol drinker. Among which 21 current tobacco smokers were excluded and 78 students were considered for the study.
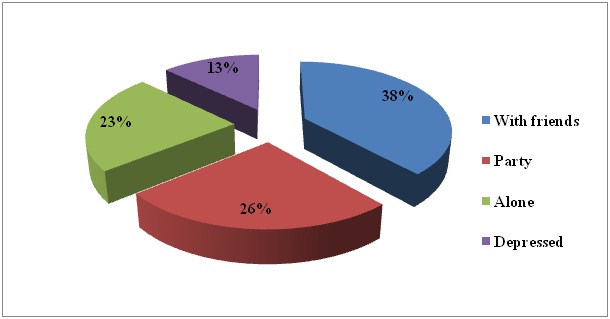
Alcohol Consumption [Table/Fig-1]: The prevalence of alcohol consumption was 20.53%. The mean age of alcohol drinkers was 21.08±1.28 years. Majority of alcohol drinkers were males (62.82%) (p <0.01){OR-4.38, 95%CI (2.59-7.40)}. Most of alcohol consumers belong to medical college (47.4%) followed by dental college (21.79%) (p<0.0084). Where Students belong to Class II socio economic status (32.05%) of modified BG Prasad consumed more alcohol, which is followed by class I and class III i.e., 26.92% and 23.08% respectively. Majority of current alcoholics (62.81%) had at least one of their family members consume alcohol, which was statistically highly significant (p<0.01) {OR-5.11, 95%CI(3.01-8.67)}. The mean age of starting alcohol consumption was 18.32 ± 2.84 years. The most common reason for starting was friends compulsion (30.77%) followed by curiosity to try (15.38%). When asked on what circumstance does alcohol consumption increases? Majority of responses were with friends (38.46%) followed by party (25.64%) and alone (23.08%).
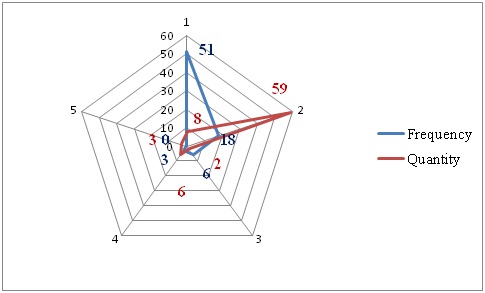
Distribution of study subjects according frequency and quantity of alcohol consumption
Alcohol Consumption & BMI [Table/Fig-2]: The mean BMI of current drinkers was 21.4±2.89. As quantity increases from 1drink/drinking day to ≥4 drinks/drinking day, BMI increased from 20.49 (95%CL 14.66-26.33) to 22.66 (95%CL 12.62-32.70). As frequency increased from low to high quintiles of drinking days/year, BMI significantly decreased (p <0.003) from 21.44 (95%CI 20.31-22.58) to 20.38 (95% CI 13.05-27.72). The most preferred snacks taken along with alcohol was deep fried non-vegetarian snacks (62.4%) followed by chips (23.2%). Least frequent drinkers consume more snacks when compared to regular drinkers; mostly they prefer non vegetarian snacks (82.36%) [Table/Fig-3,4].
Distribution of study subjects according to preference of alcohol consumption situation
Distribution of study subjects according to age, sex, college, place and alcoholics in the family (*Statistically significant)
| Drinks Alcohol | Yes | | No | | Total | x2 | p value | Odds Ratio (95% CI) |
|---|
| Age | 19years | 7 | 8.97% | 43 | 14.24% | 50 | 3.403 | 0.49 | |
| 20years | 19 | 24.36% | 84 | 27.81% | 103 |
| 21years | 27 | 34.62% | 96 | 31.79% | 123 |
| 22years | 14 | 17.95% | 52 | 17.22% | 66 |
| 23years | 8 | 10.26% | 25 | 8.28% | 33 |
| 24years | 2 | 2.56% | 1 | 0.33% | 3 |
| >25years | 1 | 1.28% | 1 | 0.33% | 2 |
| Total | 78 | 100.00% | 302 | 100.00% | 380 |
| Sex | Male | 49 | 62.82% | 84 | 27.81% | 133 | 33.39 | <0.01* | 4.38 (2.59-7.40) |
| Female | 29 | 37.18% | 218 | 72.19% | 247 |
| Total | 78 | 100.00% | 302 | 100.00% | 380 |
| College | Medical | 37 | 47.44% | 83 | 27.48% | 120 | 13.65 | 0.008* | |
| Dental | 17 | 21.79% | 63 | 20.86% | 80 |
| Ayurvedha | 10 | 12.82% | 65 | 21.52% | 75 |
| Nursing | 8 | 10.26% | 47 | 15.56% | 55 |
| Pharma | 6 | 7.69% | 44 | 14.57% | 50 |
| Total | 78 | 100.00% | 302 | 100.00% | 380 |
| Current place of stay | Home | 10 | 12.82% | 55 | 18.21% | 65 | 0.332 | 0.282 | 0.66 (0.31-1.36) |
| Hostel | 65 | 83.33% | 243 | 80.46% | 308 |
| Private | 3 | 3.85% | 4 | 1.32% | 7 |
| Total | 78 | 100.00% | 302 | 100.00% | 380 |
| Family member drinks? | Family member drinks | 49 | 62.82% | 75 | 24.83% | 49 | 40.69 | <0.001* | 5.11 (3.01-8.67) |
| Family member doesn’t drink | 29 | 37.18% | 227 | 75.17% | 29 |
| Total | 78 | 100.00% | 302 | 100.00% | 380 |
| Relationship | Father | 39 | 79.59% | 35 | 46.67% | 74 | 13.35 | <0.01* | 4.45 (1.94-10.21) |
| Grand father | 0 | 0.00% | 9 | 12.00% | 9 |
| Brother | 1 | 2.04% | 0 | 0.00% | 1 |
| Other relatives | 9 | 18.37% | 31 | 41.33% | 40 |
| Total | 49 | 100.00% | 75 | 100.00% | 124 |
Discussion
The prevalence of alcohol consumption in this study was high (20.53%) when compared to results obtained by Girish N et al., in Bangalore (13%), Kokiwar PR et al., (12.9%) and Mohanan P et al., (5.7%) [9–11], whereas study done by Khosla V et al., in Punjab shows prevalence of 31.9% [6]. There is an increase in heavy episodic drinking (3.16%) which was observed in this study, when compared to study done in Andhra Pradesh (1.4%) by WHO [12].
Majority of the study participants who consume alcohol were 21years (34.62%) followed by 20 years (24.36%). Similar observation was seen in study done by Khosla V et al., (Mean age 21±15) and higher in studies done by Kumar S et al., (66.29%), Kangule D et al., (61.26%) and Mohanan et al., (64.63) [6,13,14,11]. The majority of alcohol drinkers were males (62.82%) which was similar to other studies, whereas the prevalence among females (37.18%) was on the higher side when compared to Kumar S et al., (6.7%) [13], Khosla V et al., (5.2%) [6]. It was observed that students staying away from home (83.33%) i.e., without parental monitoring, started consuming alcohol after 1 or 2 years of joining college. This was mainly due to peer pressure (30.77%). Compulsion from friends was the most common reason for initiation of alcohol consumption this was consistent with other studies also. Stress due to academic expectation, curiosity along with peer pressure and fear of being let alone are the common factors whichinitiated alcohol consumption.
Urbanization and westernization has made alcohol consumption almost inevitable. More than one fourth (23%) said they prefer alcohol consumption alone, which in turn increases the frequency and quantity of alcohol consumption as they don’t have to convince their friends each time. Family history of alcohol consumption has a significant impact on students starting to consume alcohol. Relationship of the family member who consume alcohol has also a significant impact. On asking which family member consume alcohol? Father was the most common answer (79.59%) followed by other relative (18.37%) and brother (2.4%) [Table/Fig-3].
Distribution of study subjects according to alcohol consumption pattern and BMI
| Frequency | No of subjects | Mean | 95% CL |
|---|
| 1 | 51 | 21.44 | 20.31, 22.58 |
| 2 | 18 | 21.43 | 20.13, 22.74 |
| 3 | 6 | 21.23 | 18.14, 24.33 |
| 4 | 3 | 20.38 | 13.05, 27.72 |
| 5 | 0 | 0 | 0 |
| Total | 78 | | p=0.003 |
| Quantity |
| 1 | 8 | 20.49 | 14.66, 26.33 |
| 2 | 59 | 21.25 | 18.73, 23.76 |
| 3 | 2 | 18.5 | 12.14,24.85 |
| 4 | 6 | 21 | 17.48,24.51 |
| 5 | 3 | 22.66 | 12.62,32.70 |
| Total | 78 | | p=0.53 |
Most studies state that people do not compensate for the alcohol energy by decreasing non-alcohol food energy intake [15–17]. Alcohol energy is usually added to total energy intake. Therefore heavy alcohol drinkers tend to consume more energy than non-drinkers. The other way by which alcohol intake may alter body weight regulation i.e., Ethanol is not stored in the body, but it is oxidized in preference over others. Metabolic studies show that ethanol energy is used with preference when compared with that of a carbohydrate and protein meal and that it reduces fat oxidation. There is no reason to claim that ethanol energy does not play a role in energy balance regulation [17].
It was found that increase in quantity and frequency has marginal change in BMI. But it actually shows inverse effect. Based on previous studies it was found that moderate alcohol consumption is a marker of moderate living [18,19]. As there is a social transition, alcohol consumption has become a custom. Due to modernization, behavioural change and impact of media there is a acclimatization of lifestyles (i.e., diet, exercise) by the individuals which helps in compensating potential weight gain even though they consume more alcohol [15,16].
Limitation
Limitation of the study is that the data was collected by questionnaires, i.e., self reporting, the possibility of recall/memory bias and masking of data cannot be ruled out. It was overcome by asking the questionnaire to be answered anonymous.
Conclusion
In recent years, the alarming rise of average body weight has been considered seriously. Yet given the popularity and association generally focus on high calorie food items and lack of physical activity. Increase in consumption of relatively high caloric content of most alcohol beverages, alcohol consumption would seem to represent another potential target area in the battle against obesity. Yet changing in lifestyle has made alcohol a mandatory social custom, harmful effects should be emphasized so as to prevent the younger generation from falling into chronic alcoholism. At the same time further studies has to be done to get a complete understanding about effect of alcohol on human body especially to find its association with obesity.