Assessing the Validity of Friedewald’s Formula and Anandraja’s Formula For Serum LDL-Cholesterol Calculation
P. Krishnaveni1, Vanitha MN Gowda2
1 Postgraduate Student, Department of Biochemistry, M S Ramaiah Medical College and Hospitals, Bangalore, India.
2 Associate Professor, Department of Biochemistry, M S Ramaiah Medical College and Hospitals, Bangalore, India.
NAME, ADDRESS, E-MAIL ID OF THE CORRESPONDING AUTHOR: Dr. Vanitha MN Gowda, Associate Professor, Department of Biochemistry, M S Ramaiah Medical College and Hospitals, MSR College Road, MSR Nagar, MSRIT Post, Mathikere, Bangalore– 560054, Karnataka, India.
E-mail: vanithasukesh@hotmail.com
Introduction
An important aspect of the assessment of cardiovascular risk for a dyslipidemic subject is the estimation of serum Low-Density Lipoprotein Cholesterol (LDL-C). There are many homogenous assays currently available for the estimation of serum LDL-C. Most clinical laboratories determine LDL-C (mg/dL) by Friedewald’s formula (FF), LDL-C = (TC) - (HDL-C) - (TG/5). Recently Anandaraja and colleagues have derived a new formula for calculating LDL-C, AR-LDL-C = 0.9 TC- (0.9 TG/5)-28.
Aim & Objectives
The aim of the study was: a) to determine if, and to what extent, LDL-C level was underestimated/overestimated when it was calculated using the formulae compared with direct measurement of LDL-C, and b) to determine which of the calculated formulae show maximum correlation with direct LDL cholesterol method at different TG levels.
Setting & Design
A cross-sectional study.
Materials and Methods
Record analysis was done from the 370 (TG <400mg/dl) lipid profile reports of patients above 18 years. LDL-C estimation was done by homogenous assay and also calculated using the Friedewald’s Formula and Anandaraja’s Formula.
Results
The mean LDL-C levels were 105.17± 43.4, 102.98 ±42.5, and 98.20 ±43.7 mg/dl for D-LDL-C, F-LDL-C and AR-LDL-C, respectively. A good correlation was found between the calculated LDL-C methods and Direct Low-Density Lipoprotein Cholesterol method (D-LDL-C) assay, that is, F-LDL-C versus D-LDL-C (r = 0.937) and AR-LDL-C versus D-LDL-C (r= 0.918). Bland–Altman plot for FF-LDL-C & AR-LDL-C showed minimal negative bias.
Conclusion
FF-LDL-C correlated maximally with D-LDL-C estimation at all levels of triglycerides except at TG < 100mg/dl. At TG < 100mg/dl, Anandaraja’s Formula works better. FF-LDL-C can be used in place of D-LDL-C when the direct method cannot be afforded.
Cardiovascular risk, Cholesterol calculation, Direct assay, Dyslipidemia, Homogenous assay, Low density lipoprotein, Method comparison
Introduction
Elevated serum Low-Density Lipoprotein Cholesterol (LDL-C) concentration is a well-known atherogenic risk factor with a high predictive value for coronary heart disease [1]. The National Cholesterol Education Programme (NCEP) Adult Treatment Panel III (ATP III) recommends a goal of maintaining serum LDL-C concentration < 100mg/dL as optimal. Serum LDL concentration is also the basis for initiating appropriate treatment and patient’s risk stratification [2]. Therefore, it is important for the analysis of serum LDL-C levels to be precise and accurate.
The gold standard for measuring LDL-C level is beta (β) quantification (the separation of lipoproteins by combining ultracentrifugation and precipitation with poly-anions) [3]. Beta quantitation is not suited for routine use, as it is expensive, laborious, requires ultracentrifugation, requires large volumes of samples, is time consuming and requires expensive instruments [4]. Therefore, its use is confined to research and specialized laboratories [5].
Homogenous assays for direct LDL cholesterol (D-LDL-C) estimation were developed in 1998 [3]. The Cholesterol Reference Method Laboratory Network of the Centres for Disease Control and Prevention has approved the use of five commercially available homogenous assays for LDL-C estimation [3]. The high cost of these assays, however, limits their use in most of the Indian laboratories.
In routine practice, most clinical laboratories estimate LDL-C concentrations in serum by Friedewald formula from the concentrations of Total Cholesterol (TC), Triglyceride (TG), and High-Density Lipoprotein Cholesterol (HDL-C). The calculation of LDL-C by the traditional Friedewald’s formula (F-LDL-C) is: F-LDL-C (mg/dl) = TC-HDLC - TG/5 [6]. The LDL-C calculated using Friedewald’s formula correlates well with LDL-C measured by beta quantification, but doesn’t come without any limitations. The Friedewald’s formula cannot be used for LDL-C calculation when the subject is not fasting, when serum TG >400 mg/dl or < 100mg/dL [7] or in patients with type III or type I hyperlipoproteinaemia [8]. A fasting sample is mandatory for F-LDL-C because the Friedewald formula assumes that the triglyceride to cholesterol ratio in Very Low Density Lipoprotein (VLDL) is constant. This ratio is altered in non-fasting samples (containing chylomicrons and chylomicron remnants). Consequently, if a non-fasting sample is used for F-LDL-C, there would be an overestimation of VLDL-C and underestimation of LDL-C [6]. The use of this formula is also not recommended for Type II diabetes mellitus, nephrotic syndrome and chronic alcoholic patients, because, in these conditions too, the triglyceride to cholesterol ratio in VLDL is altered [9–11].
Recently, a new formula for calculation of LDL-C has been proposed by Anandaraja et al., The calculation of LDL-C proposed by Anandaraja et al., (AR-LDL-C) is AR-LDL-C = 0.9 TC- (0.9 TG/5)-28 [12]. The use of only two variables- TG and TC in this formula is more likely to reduce analytical errors that are expected when Friedewald’s Formula is used.
Many studies done to compare the direct methods of estimation of serum LDL cholesterol with LDL cholesterol calculation by Friedewald’s and Anandaraja’s formulas have shown conflicting results [13–15].
This study was therefore undertaken, to determine if, and to what extent, LDL-C level is underestimated/overestimated when it is calculated using the formulae compared with direct measurement of LDL-C (D-LDL-C) and to determine which of these calculated formulae (F-LDL-C, AR-LDL-C) show maximum correlation with D-LDL-C method at different TG levels.
Materials and Methods
A cross-sectional study was undertaken after obtaining clearance from the Ethical committee of the Institution. Data was collected from lipid profile reports, after analysis of the serum samples received from patients who had come for lipid profile investigation to the biochemistry laboratory of our institutional hospitals. The study period was from June 2015 to August 2015. A record analysis from these reports was done. All subjects above the age of 18 years who came to the biochemistry laboratory for a complete lipid profile investigation were included in the study. Subjects with Serum Triglycerides ≥ 400 mg/dl were excluded. The sample size of a minimum of 159 subjects was calculated based on a study by Ahmadi et al., [7], observed that the correlation coefficient between direct and indirect (Friedewald’s formula) method was r=0.976. In the present study expecting to get similar result with 90% power, 95% confidence level and population correlation coefficient as 0.96, it was decided that the study requires a minimum of 159 subjects. Serum samples of patients who came for a complete lipid profile investigation was collected and processed as per standard laboratory protocols, with due aseptic precautions, after confirming 10–12 h of overnight fasting, in plain vacutainer vials. The serum was separated by centrifugation and analysed subsequently on Roche Cobas 6000, c501 autoanalyser as per standard laboratory practices. The following tests constitute a complete lipid profile in our laboratory: Total cholesterol [16], HDL [17] and D-LDL-C [6] measured by enzymatic colorimetric methods and triglyceride measured by enzymatic method with glycerol blank. After the lipid profile analysis and report despatch, the data was collected and LDL-C calculated using Friedewald’s formula (F-LDL-C) and Anandaraja’s formula (AR-LDL-C).
Statistical Analysis of Data
The data obtained was entered into Microsoft Excel sheet and statistical analysis was performed with the same. The results were analysed and presented as numbers and mean±standard deviation (SD). The study subjects were divided into four groups based on the serum Triglycerides (TG) levels (mg/dL) -group I: TG — <100mg/dL, group II: TG — 100-199 mg/dL, group III: TG — 200-299 mg/dL & group IV: TG – 300-399mg/dL. LDL-C assay and calculation using the different formulae was compared at different levels of TG. The mean difference and mean percentage difference (PD) was calculated as was done by a previous study [18], using the formula: PD calculated LDL—C = (calculated LDL—C – D—LDL—C)/ D—LDL—C × 100. Student t-test and Pearson’s correlation was used for comparing the differences in LDL—C concentrations. The level of significance was taken as p < 0.05. Bland–Altman graphical plots were used in order to measure or analyse the degree of agreement between the direct LDL-C assay method and formulae for LDL-C calculation.
Results
The comparative study was done on lipid profile records of 370 patients. There were 125, 121, 81and 43 patients in group I, II, III & IV respectively. Out of the 370 samples for which analysis was done, 212 (57.3%) were received from the male patients and 158 (42.7%) were from females. The mean age of the patients was 48.4 ± 14.9years. The mean TC was 173.32 ± 48.7 mg/dl. The mean LDL-C levels were 105.17± 43.4, 102.98 ±42.5, and 98.20 ±43.7 mg/dl for D-LDL-C, F-LDL-C and AR-LDL-C, respectively [Table/Fig-1]. The calculated formulae underestimate LDL—C by 2.2 mg/dL and 7 mg/dL by Friedewald’s and Anandaraja’s respectively, in comparison to the direct method.
Demographic detail of study subjects
| Total number of subjects included in the study | 370 |
| No. of males | 212 |
| No. of females | 158 |
| Mean Age of subjects in years | 48.4 ± 14.9 |
| Mean±SD Serum TC (mg/dL) | 173.32 ±48.7 |
| Mean±SD Serum TG (mg/dL) | 165.47 ± 93.7 |
| Mean±SD Serum HDL-C (mg/dL) | 37.24 ± 14.7 |
| Mean±SD Serum D-LDL-C(mg/dL) | 105.17± 43.4 |
| Mean±SD Serum F-LDL-C (mg/dL) | 102.98 ±42.5 |
| Mean±SD Serum AR-LDL-C (mg/dL) | 98.20 ±43.7 |
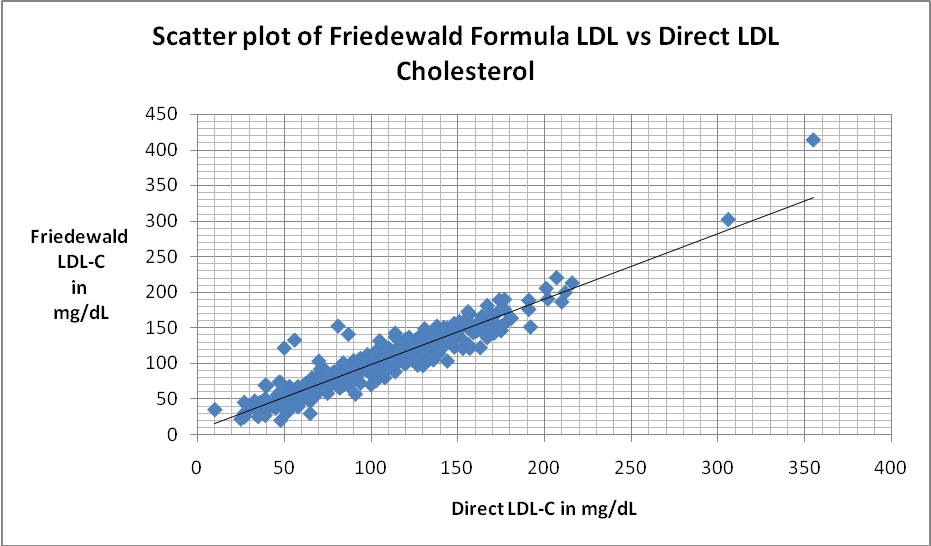
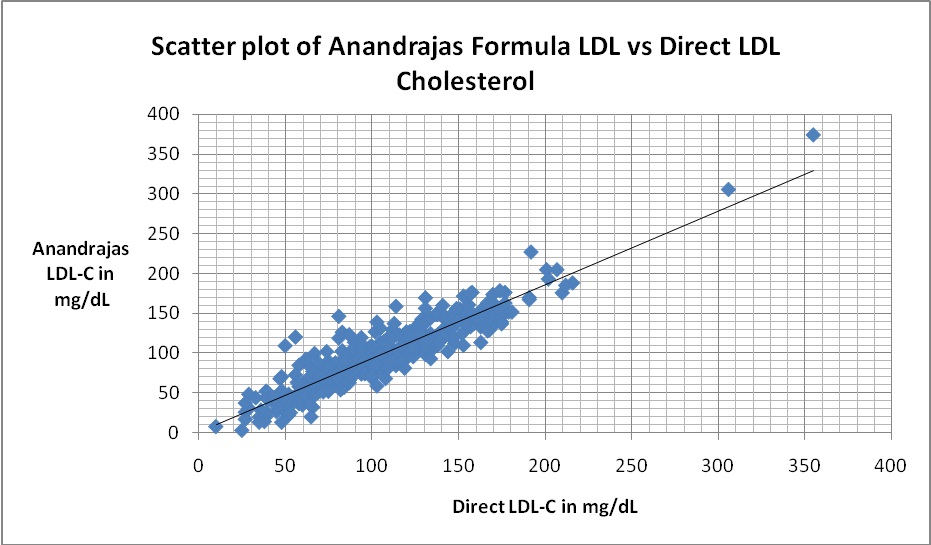
On calculating the mean PD, it was found that F-LDL-C differs by 2.07% from the D-LDL-C which was much lower in comparison to AR-LDL-C (6.62) [Table/Fig-2]. A strong correlation was found between all calculated LDL-C methods and D-LDL-C assay, that is, F-LDL-C versus D-LDL-C (r= 0.937) [Table/Fig-3] and AR-LDL-C versus D-LDL-C (r= 0.918) [Table/Fig-4].
Showing Mean Percentage Difference and Pearsons Correlation coefficient
| Mean difference in mg/dL | Mean Percentage difference | Correlation (r) |
|---|
| F-LDL-C vs D-LDL-C | -2.19 | -2.07 | 0.937 |
| AR-LDL-C vs D- LDL-C | -6.97 | -6.62 | 0.918 |
Scatter plot of Friedewald’s LDL cholesterol against direct LDL cholesterol There was a correlation of r = 0.937
Scatter plot of Anandraja’s LDL cholesterol against direct LDL cholesterol. There was a correlation of r = 0.918
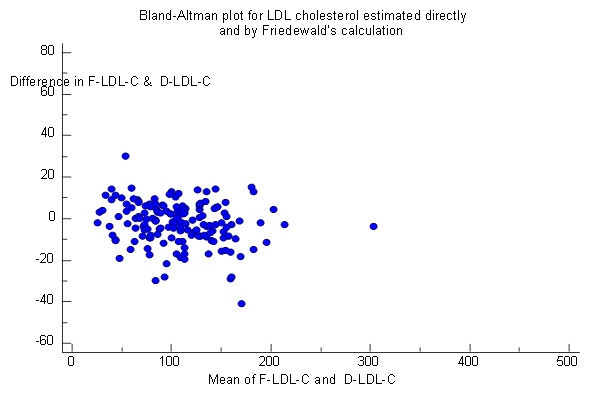
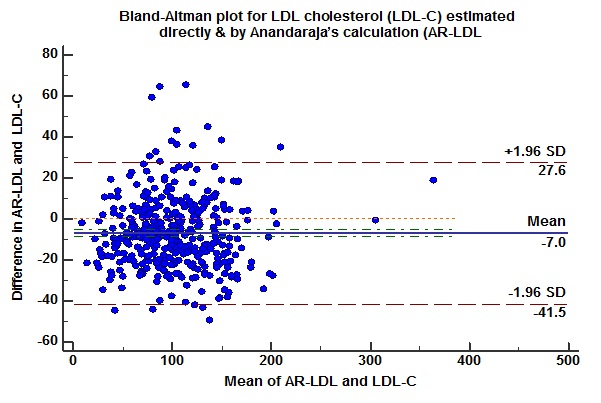
To find the agreement between the direct and calculated LDL methods, Bland–Altman Plot was prepared [Table/Fig-5,6] but the negative bias in them indicates that although they correlate to one another they cannot be used in place of direct LDL except the Friedewald’s method where the negative bias was minimum.
Bland–Altman plot for direct LDL-C and LDL-C calculated by Friedewald’s formula showing negative bias. Mean: −2.2 (negative bias), standard deviation (SD): 15.29, mean +2 SD: +27.8, mean −2 SD: −32.2
Bland–Altman plot for direct LDL-C and LDL-C calculated by Anandraja’s formula showing negative bias. Mean: −6.96 (negative bias), standard deviation (SD): 17.63, mean +2 SD: +27.6, mean −2 SD: −41.5
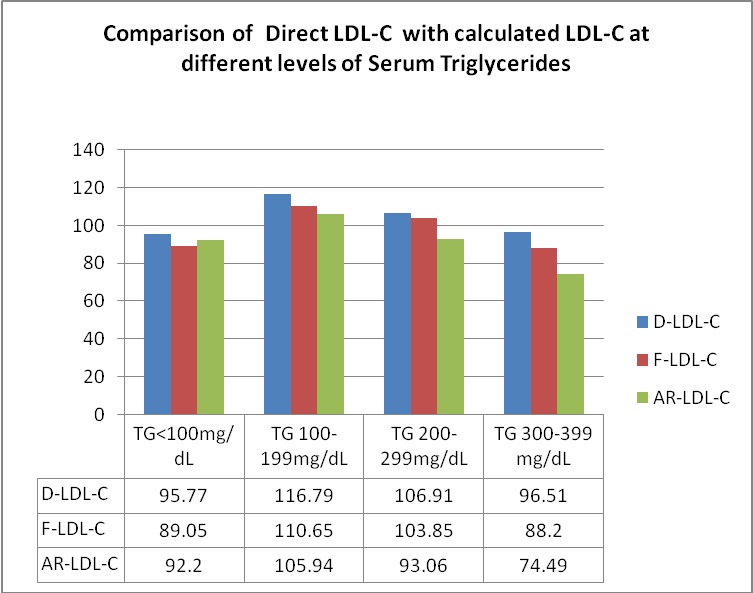
Comparison of LDL-C results at different levels of TGs showed statistically significant difference (p<0.001) between measured values and those calculated by Friedewald’s and Anandaraja’s formulae [Table/Fig-7,8]. There was underestimation of LDL-C by calculation at all the levels of TGs. This underestimation was maximum at TG levels of 300-399 mg/dl for both the formulae. The mean difference between Friedewald’s Formula LDL and Direct LDL Cholesterol was highest (8.30 mg/dL) at TG levels 300-399mg/dL and least (3.05mg/dL) at TG levels 200-299mg/dL respectively. The mean difference between Anandaraja’s Formula LDL and Direct LDL Cholesterol was highest (22.01 mg/dL) at TG levels 300-399mg/dL and least (3.57mg/dL) at TG levels<100mg/dL respectively.
Mean difference and percentage difference between Direct LDL-C with calculated LDL-C at different levels of TG
| F-LDL-C vsD-LDL-CMeandifference in mg/dL | F-LDL-C vsD-LDL-CMeanPercentagedifference | F-LDL-CvsD-LDL-Cp value | AR-LDL-CvsD-LDL-CMeandifferencein mg/dL | AR-LDL-CvsD-LDL-CMeanPercentagedifference | AR-LDL-CvsD-LDL-Cp value* p<0.05 |
|---|
| TG<100 n=125 | -6.72 | -7.0 | 0.34 | -3.57 | -3.70 | 0.21 |
| TG 100-199 n=121 | -6.14 | -5.25 | 0.25 | -10.85 | -9.29 | 0.01* |
| TG 200-299n=81 | -3.05 | -2.8 | 0.10 | -13.84 | -12.94 | 0.01* |
| TG 300-399 n=43 | -8.30 | -8.60 | 0.19 | -22.01 | -22.81 | 0.25 |
Comparison of direct LDL-C with calculated LDL-C at different Levels of Serum Triglyceride
Discussion
It is imperative for the analysis of serum LDL-C levels to be precise and accurate. This is because serum LDL-C concentration is a well known atherogenic risk factor. It is also the basis for risk stratification of Coronary Heart Disease as well as the deciding factor for treatment strategies. The relationship between LDL-Cholesterol levels and Coronary heart disease risk is continuous over a broad range of LDL levels from low to high [1,2]. This cross-sectional study was untaken to assess the validity of using Friedewald’s and Anandaraja’s formulae to report a person’s serum LDL-C level. A good correlation was observed between the calculated parameters and directly measured LDL-C levels. The correlation was 0.937 between F-LDL-C and D-LDL-C. This finding is similar to that found in a study done by Kapoor et al., and other studies where the correlation ranged between 0.78 to 0.93 [13,18,19]. The correlation was 0.918 between AR-LDL-C and D-LDL-C in the present study which is also similar to other studies [13,18,19]. Bland Altman plots showed a negative bias in spite of the good correlation mentioned above. This could be due to a difference in the results obtained by the direct and calculated methods. Friedewald’s and Anandaraja’s formulae underestimated the D- LDL-C by 2.2% and 7% respectively. This is similar to a study done by Kamezaki et al.,, which found an underestimation of D-LDL-C of 5.9% with FF LDL-C and a study by Gasko et al.,, where it was found that D-LDL-C was underestimated by F-LDL-C by 3.44% [15,20]. At different levels of TG, the study found that calculated LDL was always lower than the directly measured LDL-C. This difference increases at higher levels of TGs. This is similar to other studies [13]. The mean difference between F-LDL-C and D-LDL-C was highest (8.30 mg/dL) at TG levels 300-399mg/dL and least (3.05mg/dL) at TG levels 200-299mg/dL respectively. The mean difference between AR-LDL-C and D-LDL-C was highest (22.01 mg/dL) at TG levels 300-399mg/dL and least (3.57mg/dL) at TG levels<100mg/dL respectively. A study done by Kamal et al., has similar findings[19].
Limitations
A major drawback in the present study was that we did not take into consideration the co-morbidities of each study subject. These co-morbidities could also have a role in influencing calculated LDL-C levels. The performance of the Friedewald’s formula under the different HDL-C levels could also have been studied.
Conclusion
We conclude that, calculated LDL-C results and D-LDL-C show good correlation. The negligible negative bias causes a statistically significant difference in results on comparing measured and calculated LDL. AR-LDL-C gives a higher percentage of error compared to F-LDL-C, especially at high TG levels but works better than F-LDL-C only at TG levels < 100mg/dL. Therefore, Friedewald’ s formula is better than Anandaraja’ s formula for calculating LDL-C in a more cost effective manner and can be used in large population studies.
Authorship Criteria: P. KRISHNAVENI: Study conception and design, Acquisition and analysis of data, literature search, Writing and Drafting of manuscript and shall be the overall guarantor.
VANITHA GOWDA MN: Analysis and interpretation of data, literature search, Writing and Drafting of manuscript, Critical revision.
Funding: All the authors acknowledge the M S RAMAIAH MEDICAL COLLEGE & HOSPITALS for providing ample opportunity and encouragement towards completing this project.
[1]. Castelli WP, Garrison RJ, Wilson PW, Abbott RD, Kalousdian S, Kannel WB, Incidence of coronary heart disease and lipoprotein cholesterol levels. The Framingham studyJAMA 1986 256(20):2835-38. [Google Scholar]
[2]. Expert Panel on Detection, Evaluation, and Treatment of High Blood Cholesterol in AdultsExecutive Summary of the Third Report of the National Cholesterol Education Program (NCEP) Expert Panel on Detection, Evaluation, and Treatment of High Blood Cholesterol in Adults (Adult Treatment Panel III)JAMA 2001 285(19):2486-97. [Google Scholar]
[3]. Centers for Disease Control and Prevention. Cholesterol Reference Method Laboratory Network (CRMLN) [Internet] Atlanta (GA): Centers for Disease Control and Prevention; [cited 2015 October 14th]. Available from: http://www.cdc.gov/labstandards/crmln_clinical.html [Google Scholar]
[4]. Turkalp I, Cil Z, Ozkazanc D, Analytical performance of a direct assay for LDL-cholesterol: a comparative assessment versus Friedewald’s formulaAnadolu Kardiyol Derg 2005 5(1):13-17. [Google Scholar]
[5]. National cholesterol Education Program Working Group on Lipoprotein Measurement: Recommendations on Lipoprotein Measurement. NIH Publication No 95-3044, Bethesda, MD; 1995;31–34 [Google Scholar]
[6]. Rifai N, Warnick GR, Measurement of lipids, lipoproteins, and apolipoproteins. In: Burtis CA, Ashwood ER, Bruns DE, edsTietz Textbook of Clinical Chemistry and Molecular Diagnosis 2006 4th edSt. Louis, MissouriElsevier Saunders:938-952. [Google Scholar]
[7]. Ahmadi SA, Boroumand MA, Gohari-Moghaddam K, Tajik P, Dibaj SM, The impact of low serum triglyceride on LDL-cholesterol estimationArch Iranian Med 2008 11(3):318-21. [Google Scholar]
[8]. Rifai N, Warnick GR, McNamara JR, Belcher JD, Grinstead JF, Frantz M. Measurement of low-density-lipoprotein cholesterol in serum: a status reportClin Chem 1992 38:150-60. [Google Scholar]
[9]. Joven J, Villabona C, Vilella E, Masana L, Alberti R, Valles M, Abnormalities of lipoprotein metabolism in patients with the nephrotic syndromeN Engl J Med 1990 323:579-84. [Google Scholar]
[10]. Matas C, Cabré M, La Ville A, Prats E, Joven J, Turner PR, Limitations of the Friedewald formula for estimating low-density lipoprotein cholesterol in alcoholics with liver diseaseClin Chem 1994 40(3):404-06. [Google Scholar]
[11]. Rubiés-Prat J, Reverter JL, Sentí M, Pedro-Botet J, Salinas I, Lucas A, Calculated low-density lipoprotein cholesterol should not be used for management of lipoprotein abnormalities in patients with diabetes mellitusDiabetes Care 1993 16(8):1081-86. [Google Scholar]
[12]. Anandaraja S, Narang R, Godeswar R, Laksmy R, Talwar KK, Low density lipoprotein cholesterol estimation by a new formula in Indian populationInt J Cardiol 2005 102:117-20. [Google Scholar]
[13]. Martin SS, Blaha MJ, Elshazly MB, Brinton EA, Toth PP, McEvoy JW, Friedewald-estimated versus directly measured low-density lipoprotein cholesterol and treatment implicationsJ Am Coll Cardiol 2013 62(8):732-39. [Google Scholar]
[14]. Gupta S, Verma M, Singh K, Does LDL-C estimation using Anandaraja’s formula give a better agreement with direct LDL-C estimation than the Friedewald’s formula?Indian J Clin Biochem 2012 27(2):127-33. [Google Scholar]
[15]. Gasko R, Low density lipoprotein cholesterol estimation by the Anandaraja’s formula-confirmationLipids Health Dis 2006 5:18 [Google Scholar]
[16]. Greiling H, Gressner AM, Lehbruch der Klinischen Chemie und Pathobiochemie 1995 3rd edStuttgart/New YorkSchattauer [Google Scholar]
[17]. Sugiuchi H, Uji Y, Okabe H, Irie T, Uekama K, Kayahara N, Miyauchi K, Direct measurement of high-density lipoprotein cholesterol in serum with polyethylene glycol-modified enzymes and sulfated alpha-cyclodextrinClin Chem 1995 41(5):717-23. [Google Scholar]
[18]. Kapoor R, Chakraborty M, Singh N, A Leap above Friedewald formula for calculation of low-density lipoprotein-cholesterolJournal of Laboratory Physicians 2015 7(1):11-16. [Google Scholar]
[19]. Kamal AHM, Hossain M, Chowdhury S, Mahmud NU, A comparison of calculated with direct measurement of low density lipoprotein cholesterol levelJCMCTA 2009 20:19-23. [Google Scholar]
[20]. Kamezaki F, Sonoda S, Nakata S, Otsuji Y, A direct measurement for LDL-cholesterol increases hypercholesterolemia prevalence: comparison with Friedewald’s calculationJ UOEH 2010 32:211-20. [Google Scholar]