Childhood obesity is increasing rapidly worldwide and is one of the most serious public health challenges of the 21st century. The problem is steadily affecting many low and middle income countries, particularly in urban settings and its prevalence is increased at an alarming rate [1]. Excessive weight in children is a cause of major concern. Obesity is a chronic disease, a global epidemic both in developed and third world countries. Many factors like physiology, biochemistry, anatomy, metabolic and social interactions play a role in making a human body prone to obesity and overweight, which is nothing but comparison of lean body mass to excess of body fat [2]. Sedentary activities like watching television has resulted in increased non nutritive food consumption like snacking and less meal eating leading to obesity [3]. This in turn has resulted in greater calorie consumption and decreased fruit and vegetable consumption. Sedentary life style and nonnutritive greater calorie consumption have triggered the time bomb of obesity early in life [4]. Many variables have been attributed for individual choice and prevalence of food like availability, economic, social, cultural and behavioural factors. But the main driving force of an individual choice of food is closely link to taste and sensory properties of food [5]. There is a dramatic increase of obesity over the past 3 decades and around 25% of children are overweight and obese [6]. Right from the vedic ages bitter taste was used as an indicator as a poisonous substance or taken in smaller quantities as a medication. Probably it is perceived that bitter is bad and hence not eaten. Poisons kill quickly and this bitter taste prevents such untoward incident leading to classic refection response [7]. Thus most of us are very sensitive to this bitter taste perception, which is a safety mechanism for survival of an individual. Humans have a very low threshold for this bitter taste. But this sense of taste bitter is genetically controlled which is either present/absent in individual making them susceptible to food choices. In this study we have taken into consideration this bitter tasting ability to scientifically study the food choices/preferences and its effect on overall health, growth and development and food choices of preschoolers. PROP (6 n propylthiouracil) paper strip is a useful tool in determining genetic sensitivity for different taste sensations. In our study we used PROP as it can be tasted at very low concentration [8]. Children tend to reject/prefer a food based on their genetic sensitivity [1]. So, the present study was carried out with an aim is to determine the body mass index among tasters and non-tasters preschool children using 6-n-propylthiouracil.
Materials and Methods
The present study was conducted in the Department of Pedodontics and Preventive Dentistry, Modern Dental College and Research Centre, Indore in 2013-15. Five hundred healthy school going children between 3-6 years of age and both the genders were randomly selected from different play schools, nurseries, private and government schools. After getting the permission from the school authorities the study design was explained to parents and a written consent in their regional language was obtained. These children were randomly selected following these inclusion and exclusion criteria.
Children with known medical/hereditary condition that can affect salivary flow alter the taste sensation or necessitate diet modifications.
No known allergy/history of adverse reaction to 6-n -propylthiouracil.
Participant co-operation and acceptance of the study procedure.
Children under any medication and antibiotics three months before the study.
Children who did not fall under American society of Anesthesiologist (ASA) physical status of class I [9].
Preparation of the PROP Strips
PROP strips were prepared using Whattman filter paper. The paper was cut into square pieces of 2x2 cm dimensions and sterilized using an autoclave at 121°C for 15 min. The strips were weighted and stored in desiccators till further use.
A 6-n-propylthiouracil (10mg/ml) was dissolved in 5ml of ethyl alcohol in a beaker and the previously cut filter paper strips were soaked in this for one hour for the complete absorption of the drug. The strips were removed and were allowed to dry at room temperature. The weight of the strips after drying was determined and recorded. The difference was calculated to access the actual amount of drug impregnated on the paper. The weight difference showed an average 1.2 mg of drug on the paper [1].
PROP Sensitivity Test
The impregnated square papers were used to classify the 500 children in the age group of 3-6 years as tasters/non tasters. The paper was placed on the dorsum of the tongue for about 30 seconds to elicit the bitter sensation. The subjects were asked if they tasted anything? If there was no response, then they were asked whether it tasted like paper. Participants who responded it tasted like paper/no taste were classified as non-tasters. If the respondent said it tasted bad or yucky they were classified as tasters. Ambiguous/conflicting responses were retested at a later time to verify or conclude to categorize them. Facial expressions were also observed to corroborate the response of taste [1].
Calculation of Body Mass Index
Children were measured for their height and weight after removing their footwear. Height was measured using a stature meter. Weight was measured using an electronic weighing machine to nearest 0.1 kg. The weight was recorded over the reading stabilized.
The values were then compared to the values given by centre for diseases control and prevention values. The four categories advocated were:
Category I - Underweight with BMI for age less than 5th percentile
Category II - Normal with BMI for age greater than or equal to 5th percentile and less than 85th percentile
Category III - Overweight with BMI for age greater than or equal to 85th percentile and less than 95th percentile
Category IV - Obese group children with BMI greater than or equal to 95th percentile [10].
Statistical Analysis
Data analysis was done using Statistical Package for Social Sciences (SPSS) version 21. Frequency, percentages, mean, standard deviation (SD), median, minimum and maximum values of variables in taster and non taster group were calculated.
Categorical variables (percentages and frequencies) were analysed using Pearson’s Chi square test. A p-values <0.05 were considered statistically significant.
Result
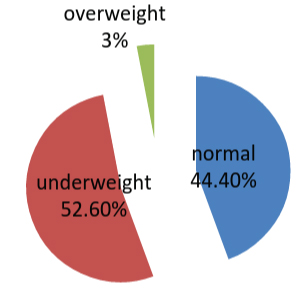
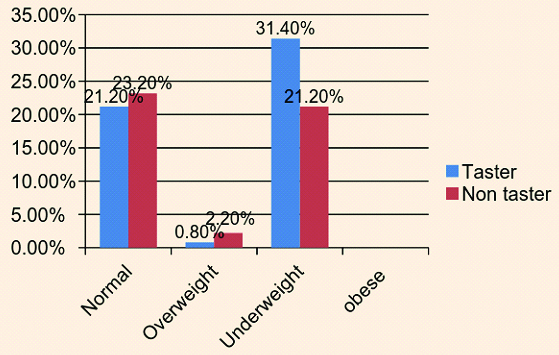
The study included 500 male and female school going children in the age group of 3-6 years. The children were categorized according to body mass index as normal, underweight and overweight [Table/Fig-1]. In overweight category there was higher percentage of children as non-tasters (73.30%) whereas, lowest percentage was seen in underweight children. Tasters were higher in underweight and lowest in overweight categories of children. Normal category was in between them. This relationship was statistically significant i.e. (p= 0.007) [Table/Fig-2]. This signifies the effect of nutritional status (BMI) on the taste perception of the children [Table/Fig-3].
Pie chart showing BMI distribution
Total distribution of BMI categories in tasters and non tasters
| Nutritionalstatus | Taste perception | Total | X2 Value | p-Value |
|---|
| Non-tasters | Tasters | |
|---|
| Under weight | 10621.2% | 15731.4% | 26352.6% | | |
| Normal | 11623.2% | 10621.2% | 22244.4% | 12.0 | |
| Over weight | 112.2% | 4.8% | 153.0% | 0.007(S) |
| Obese | 0% | 0% | 0 % | |
| Total | 233 | 267 | 500 | |
| 46.6% | 53.4% | 100.0% | |
Distribution of tasters and non-tasters among various BMI categories
Discussion
The role of genetics was evoked many a times but its exact nature was never understood. This vague and incomplete understanding the role of genetics has made pioneers of dental research to take a peek into huge potential minefield. Time and again the questions of why only a selected few are affected by these dental conditions while others were immune to it. A common factor which was previously taken for granted has popped up before the scientific community i.e. role of eating habits. This study was carried out to see the taste perception among young children, their food preferences (eating habit) and BMI implications.
All children were subjected for taste perception test by using these PROP strips and classified into taster and non-taster groups by the subject’s taste perception. The children were easily categorized into taster and non-tasters, as tasters found PROP extremely bitter and non tasters stated it as no taste or as good as paper [11].
Our study revealed 53.4% of them are tasters and 46.6% of them were non-tasters, which was in accordance to the global distributions as mentioned below. Overall, about 75% of humans find PROP as bitter in taste, and they are classified as “tasters.” The proportion of non-tasters varies between populations across the globe. In West Africa, 3% of the population is blind to the bitter taste of PROP, but in China the proportion ranges between 6% and 23%, Caucasian North American populations exhibit a non-taster frequency of about 30% and in India it has been reported to be as high as 40% [12]. In a study by Rupesh and Nayak, non-tasters were 19%, medium tasters 49% and supertasters 32% whereas Lumeng et al., found 77.78% tasters and 22.2% non tasters [8,13] [Table/Fig-4].
BMI status of various studies
| Parameters | Rupesh /nayak [8] | Kelleret al., [17] | Hedge andSharma [18] | Lumenget al., [13] | Fischeret al., [19] | Our study |
|---|
| BMI | _____ | Non taster children showed increased BMI compared to tasters | Obese and overweightwere mostly non tasters. | Taster children had higher BMI than non tasters and even tasters may be at higher risk of overweight. | Tasters tend to be thinner (ectomorphs), whereas non-tasters tend to have heavier body types (endomorphs). | Non tasters were mostly in overweight category where as more number of tasters were in underweight category. |
| Tasters/ non tasters distribution | 19% - non tasters49% - medium taster32% -supertaster | ______ | _____ | 77.78% tasters22.2% non tasters | ______ | 53.4%-tasters46.6%- non tasters |
Genes influence many aspects of eating behaviour, including taste sensitivity, food preferences, and intake of specific foods, meal patterns and meal and daily energy intake. Studies have suggested that children are susceptible to increased aggressive marketing and environment stimuli as availability of food. Even evidence of eating more was observed in children expressed to food advertisement. Children exposed to certain kids programme of food promotions encouraged them to take high density caloric foods [14] and hence made them obese. At least half of food advertisements during children’s television programming were for energy-dense low nutrients foods such as cereal, candy, snacks, soda and fast food. Not only do such advertisement promote eating, but eating while watching television also often leads to overeating because children do not notice how much they are eating [15]. Few studies have noted that school eating patterns, school lunch choices begin to influence children’s overall diet. School’s food policies affect student BMI; as the number of school food policies increases, students mean BMI decreased [16].
Being more sensitive to the bitter taste of PROP it was directly associated with a higher BMI i.e. evidence suggesting bitter tasting ability may be related to body mass index (BMI). Our study found a significant relationship between BMI and taster and non-taster groups. In the overweight category higher percentage of children were non-tasters as high as 73.30% and lowest percentage of non-tasters were seen in underweight children. Tasters were higher in underweight categories and lowest number of tasters was seen in overweight children. Normal category was in between them. This relation was statistically significant [Table/Fig-2].
The significant linking of taste perception to body weight is unclear but it is seen to influence the dietary fat intake or rejection. High preferences of fatty food may develop the risk of obesity. Non tasters were found to have fewer taste buds receive trigeminal input and hence need high quantity of fat food to get the same level of satisfaction seen in tasters. Trigeminal input has the ability to perceive textural cues (creaminess and oiliness), which are less in non-tasters [17].
Hegde and Sharma reported that obese and overweight children were mostly non tasters and they preferred the sweet and fatty foods [18]. Keller et al., found that non taster children showed increased BMI as compared to tasters [17] [Table/Fig-4]. But Lumeng et al., reported that PROP taster children had higher BMI than non tasters and even tasters may be at higher risk of overweight due to low intake of vegetables [13]. Fisher et al., noted that tasters tend to be thinner (ectomorphs), whereas non-tasters tend to have heavier body types (endomorphs) [19]. The above-mentioned studies had contrasting results as they showed significant correlation between tasters and non-tasters group and BMI which might influence the discriminability and palatability of dietary fat. Excessive intake of high-fat foods is a risk factor for the development of obesity [17]. As a result the non-taster has a tendency to consume more fatty food leading to higher BMI resulting in overweight and obese condition. Where as in underweight category more number of children were tasters. Previous studies suggest that non-tasters might have more number of fungiform papillae and low threshold of taste perception that’s why they have chosen for different food types and rejected fatty food.
Limitations
The study had a few limitations such as the oral health status of the children was not recorded, which should be taken up by the future researchers that contribute to this topic.
Conclusion
There were more number of non tasters in overweight category in the present study and a significant relationship was found between taste perception and nutritional status of children (BMI). Tastes perception of an individual can be assessed chair side by using PROP squares. It gives us an indication of how ability to perceive taste sensation plays a pioneering role in food choices. It helps the clinician to augment his knowledge while delivering treatment plan and preventive strategies, thus helping children in balancing the tipped scales of BMI issue due to food choices. The clinician can play a very important role in diet counseling of the parents thus improving the general health of the patient. It can provide the primary health care providers an insight into the genetic makeup of the child and thus plan treatment and preventive strategies leading to restore optimum health.