In the field of cancer histopathology, morphologic nuclear abnormalities were conventionally assessed to determine the degree of tumour differentiation and predict prognosis. Carcinogenesis follows complex molecular alterations, which are triggered by subtle chromatin changes that are not perceived by the human eye. Treatment decisions in cases of oral cancer are hindered by the imprecise determination of the clinical stage, diagnostic imaging with low specificity and histological grading that underestimate the extent and severity of the cancer due to inter-observer variability. Considering the limitations of the traditional systems, many newer techniques that employed immunohistochemical markers, gene expression and hybridization, and mutational analysis have been applied although their use is limited by factors of cost in terms of material and specialized equipment with trained staff [1].
Recent years have seen the invention of newer biologic markers as well as recognition of factors linked to neoplastic cells and tissue morphology studied through computer-aided image analysis, which depict the prognosis and survival of the cancer patient with minimal subjectivity. One such approach is the assessment of fractal geometry, a mathematical technique first described by Benoit Mandelbrot (1982), which aids in precise assessment of architecture of natural objects including histopathological specimens as well as pictures captured from any other imaging methods [2]. Fractal objects are complex objects which are characterized by self-similarities in structural complexity at different magnifying scales. Assessment and quantification of degree of complexity of these objects is described as fractal dimension (FD). Normal structures like vessels of the retina, air channels of the lungs, the arterial tree of the kidneys and nuclear chromatin are known to follow fractal geometry [3].
Recent studies on neoplastic nuclei of melanomas and other carcinomas showed an increase in nuclear fractal dimension in comparison to their normal counterparts with observations that greater nuclear complexity implies increasingly aggressive patterns of invasion [1]. The present study therefore assessed nuclear morphologic complexity by evaluating fractal dimension using computer-aided image analysis. The fractal dimensions obtained were then correlated with various parameters like clinical staging, histological grade and survival in an attempt to predict the aggressiveness of tumour in a sample of cases of OSCC.
Materials and Methods
The study comprised of 20 samples including 14 cases of different grades of OSCC and 6 control sections of normal buccal mucosa. Two consecutive formalin-fixed paraffin-embedded tissue sections were taken from all the samples. One section each was stained with Hematoxylin and Eosin for histopathological assessment and Feulgen stain for evaluation of nuclear complexity.
For standard nuclear morphometry, 15 consecutive high power fields (100X) of Feulgen-stained sections were selected by 3 observers independently at Invasive Tumour Front (ITF) and Tumour Proper (TP) of test cases and normal buccal mucosa of control cases and photographed using conventional light microscope (Olympus CX21). Two hundred well-stained, well-defined and non-overlapping nuclei at ITF, TP & normal buccal mucosa were semi-manually selected and extracted from the background with the aid of the Adobe PhotoShop CS ‘magnetic lasso tool’. Images were converted into green mode and thresholded to an 8-bit grey level image and stored in a Tiff format (uncompressed).
The nuclear complexity was evaluated by image analysis using fractal box-counting plugin in image J software1.43u (Wayne Rasband, National Institutes of Health, Bethesda, USA) to quantify fractal dimention (FD) by using Sarkar box-counting method. According to this method, a grid with multiple small boxes of particular pixel length is superimposed on the digital image. For this study, box counts were maintained at (2,4,6,8,16,32,48,64) till a maximum of 64 boxes to enable standardization. Irregular image profiles were then automatically ‘boxed’ by the software into appropriate number of boxes (the number of boxes needed for a particular image depends on the number of pixels in the same image) thereby generating an output in the form of a regression line graph. The slope of the regression line equals the fractal dimension of the object and depends on the number of intercepts of the surface with the boxes [Table/Fig-1]. A "smoother" surface will have less intercepts and therefore a lower FD than a "rougher" surface. The software automatically estimates the fractal dimension using the box-counting algorithm that applies the equation:
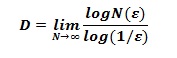
where D is the box-counting fractal dimension; ε the side length of the box, and N(ε) the smallest number of contiguous and non-overlapping boxes of side ε required to cover the nuclear surface completely [1,3,4].
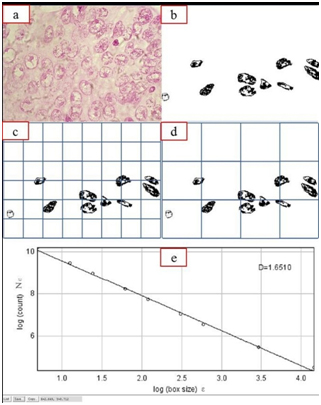
Procedure to construct the outlined images of nucleus and application of the box count method to derive the fractal dimension
a) Digitized Feulgen-stained image of a histopathologically-proven case of oral squamous cell carcinoma.
(b) Binary image after removal of background and nuclear segmentation.
(c) and (d) show 48 box grid and 12 box grid of the edited binary image used for fractal analysis with variation of N (ε) of the box sizes.
(e) D represents the slope which is the fractal dimension. The goodness-of-fit (R square = 0.9891) indicates that the nuclear structure approximates an ideal fractal
Statistical Analysis
The difference in nuclear fractal dimension (NFD) between test cases and controls was done using independent students t test, and between ITF and tumour proper was assessed using paired t-test. One-way ANOVA and independent t-test were also employed to evaluate the association of FD with clinical staging and histological variables like Surgical margin, lymphnode metastasis, tumour recurrence, patient survival respectively. The parameters were checked as mentioned in [Table/Fig-2].
Demographics of cases selected
| Clinical Parameters | Subcategories | No. of cases | Percentage |
|---|
| Age | Mean and SD: 55.42 ± 11.67Min-37, Max-76 | |
| Gender | Male (Mean age= 53.22yrs) | 9 | 64.3% |
| Females (Mean age= 59.4yrs) | 5 | 35.7% |
| Histological Grade | Well differentiated | 3 | 21.4% |
| Moderately differentiated | 9 | 64.3% |
| Poorly differentiated | 2 | 14.3% |
| Clinical Stage | I | 1 | 7.1% |
| II | 3 | 21.4% |
| III | 6 | 42.9% |
| IV | 4 | 28.6% |
| Margin status | Free | 8 | 57.1% |
| Involved | 6 | 42.9% |
| LN Metastasis | No metastasis | 9 | 64.3% |
| Metastasis present | 5 | 35.7% |
| Recurrence | No recurrence | 6 | 50% |
| Recurrence present | 6 | 50% |
| Survival period | Alive with or without SCC | 4 | 40% |
| Dead with SCC | 6 | 60% |
Results
Of the 14 cases with oral squamous cell carcinoma the mean age for males (N=9) was 53.22 years and of females (N=5) was 59.4 years with age ranging from 37 to 76 years. Most of the cases of OSCC were in stage III (n=6, 42.9%) and moderately differentiated (64.3%, n=9) [Table/Fig-2].
Higher mean nuclear FD was observed at ITF and TP of oral squamous cell carcinoma (test cases) in comparison to normal buccal mucosa (control cases) when compared using Independent sample t-test (p=<0.001) [Table/Fig-3]. A decrease in mean fractal dimension by 0.013 was seen as the cells were tracked from tumour proper to ITF (p=0.094) (Paired sample t-test).
Comparison of nuclear fractal dimension at invasive tumour front and Tumour proper of test and control cases with various variables: Independent sample T-test
| N | Mean | Std. Deviation | t | df | p value (2-tailed) |
|---|
| FD ITF# | Case | 14 | 1.6977 | 0.04269 | 4.084 | 18 | 0.001 |
| Control | 6 | 1.6243 | 0.0121 |
| FD TP# | Case | 14 | 1.7168 | 0.03926 | 5.58 | 18 | <0.001 |
| Control | 6 | 1.6243 | 0.0121 |
| FD ITF | Margin involved | 6 | 1.720012 | 0.033111 | 1.840831 | 12 | 0.090 |
| Margin free | 8 | 1.681003 | 0.043084 |
| FD TP | Margin involved | 6 | 1.735466 | 0.017968 | 1.636635 | 12 | 0.127 |
| Margin free | 8 | 1.70281 | 0.045928 |
| FD ITF | Recurrence present | 6 | 1.731496 | 0.018259 | 3.892125 | 10 | 0.002 |
| Recurrence absent | 6 | 1.662807 | 0.039184 |
| FD TP | Recurrence present | 6 | 1.724484 | 0.036878 | 1.533326 | 10 | 0.156 |
| Recurrence absent | 6 | 1.694171 | 0.031385 |
| FD ITF | Alive | 4 | 1.650464 | 0.042228 | -3.48605 | 8 | 0.025 |
| Dead | 6 | 1.729727 | 0.020667 |
| FD TP | Alive | 4 | 1.689883 | 0.039306 | -2.28696 | 8 | 0.051 |
| Dead | 6 | 1.739708 | 0.029929 |
| FD ITF | LN metastasis present | 5 | 1.7174 | 0.0207 | 1.32 | 12 | 0.212 |
| LN metastasis absent | 9 | 1.6868 | 0.0487 |
| FD TP | LN metastasis present | 5 | 1.7503 | 0.02244 | 3.036 | 12 | 0.010 |
| LN metastasis absent | 9 | 1.6982 | 0.03413 |
#Independent sample T-test comparing thenuclear fractal dimension at invasive tumour front and Tumour proper of test and control cases
Correlation of cases of oral squamous cell carcinoma with margin status, tumour recurrence, lymph node status and survival by Independent sample t-test showed an increase in fractal dimension both at the Invasive Tumour Front (ITF) and in the Tumour Proper (TP) in cases that exhibited involvement of surgical margins, lymph node metastasis, increased tumour recurrence and decreased survival [Table/Fig-3].
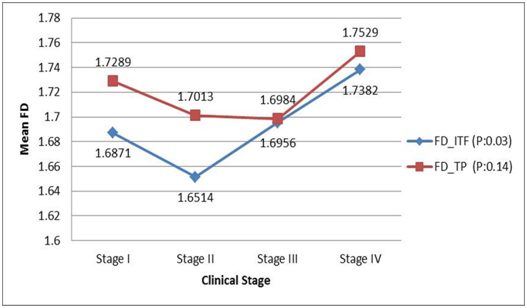
Comparison of nuclear fractal dimension with clinical staging using One-way ANOVA showed considerable difference in the average value of nuclear FD between the four stages of the disease. At the Invasive Tumour Front there was a statistically significant rise in fractal dimension from stage 2 to stage 4 (p=0.038). In the Tumour Proper, while the highest FD value was seen in cases of stage 4 OSCC, the values reduced gradually from stage 1 to 3 [Table/Fig-4].
Comparison of nuclear fractal dimension with clinical (TNM) stages in OSCC cases: One-way ANOVA test
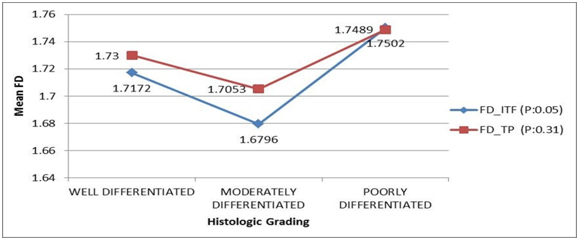
One-way ANOVA showed a difference in the average nuclear FD value between the different degrees of tumor differentiation at Invasive Tumour Front (p=0.057) and Tumour proper (p=0.316). FD values were lower in moderately-differentiated tumours, while they were higher in poorly-differentiated tumors. However, post-hoc analysis by Tukey test showed no statistically significant difference between the different tumour grades (all p > 0.05) [Table/Fig-5].
Comparison of nuclear fractal dimension with histological (Bryne’s) grading in OSCC cases: One-way ANOVA test
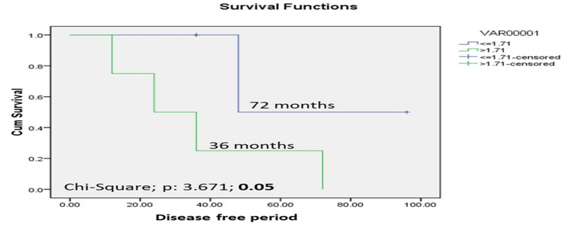
Correlation of FD and survival was achieved by plotting Receiver Operative Curve (ROC) for each variable and the event of death. Based on the sensitivity and specificity values obtained as the coordinates of receiver operative curve (ROC), the cut-off of 1.71 was derived exhibiting highest sensitivity of 67% and specificity of 100%. Log Rank test of comparison of nuclear fractal dimension at Invasive Tumour Front with a cut-off value of 1.71 showed that the cases with a FD value ≤1.71 showed a higher survival period of 72 months whereas the cases having a FD value >1.71 showed a lower survival period of 36 months (log rank chi-square value= 3.671, p= 0.05) [Table/Fig-6].
Comparison of nuclear fractal dimension at invasive tumour front with a 3 year postoperative disease free survival period in OSCC cases using Kaplan Meier curve & Log Rank test
Discussion
Oral squamous cell carcinoma (OSCC) is the most common oral malignancy and despite rapid progress in diagnostic and therapeutic approaches, the prognosis and survival still remains poor. The complex biological behaviour of tumours may partly be attributed to structural (euchromatin/heterochromatin) and distributional (margination/vacuolation) changes in nuclear chromatin. Supple-menting these features are subtle alterations in histone and non-histone proteins that cannot be perceived by the naked human eye but may be visually enhanced using computer-guided image analysis. One of the important aspects of computer-assisted texture analysis is the determination of fractality. Fractals characterize the structural complexity that is not revealed by classical morphometry. Fractals are complex structures with self-similarity, i.e. they exhibit similar features at different magnifications, in a scale-independent manner [1].
The FD of an object is a number that illustrates the morphological complexity or space-filling properties of that object with greater space-filling ability implying greater fractal dimension. Thus, the fractal dimension can take the values ranging from 1 to 2 with an empty circle/ straight line having a FD of 1 whereas a more complex bi-dimensional structure would have an FD between 1 and 2, and a filled circle/object would have the highest FD of 2 implying that the object completely fills the plane in which it exists. This concept of fractal dimension is now used widely to describe many highly irregular, normal and pathologically occurring patterns and processes like changes in cerebral blood flow in arterial diseases, tumor angiogenesis, and chromatin distribution in malignant cells [5]. Dixon et al., proved that the effects of noise, variable staining intensity and resolution does not significantly affect the fractal dimension estimation of tissue specimens [6].
Recent studies have shown the fractal nature of nuclear chromatin including the surrounding nucleoplasmic space can be used as marker for neoplastic change. Takahashi et al., suggested a fractal model of chromosomes and chromosomal DNA replication and described Fractal Dimension (FD) as a method to study chromatin condensation [7]. The chromatin structure can be considered as a fractal, based on R square value (coefficient of determination) which characterizes the goodness-of-fit of the regression line and is therefore an estimate of the “quality of fractality”. The observed values should lie as close as possible on the straight regression line, where the slope gives an estimate of the fractal dimension [1]. This condition was fulfilled in the current study for which the R2 values of the regression in most images were> 0.9 [Table/Fig-1].
Bancaud et al., demonstrated that the structure of soluble nuclear proteins (chromatin) was independent of their size and therefore qualifying themselves as fractal objects. The authors studied fractal dimension in three dimension where the fractal values ranged from 1 to 3. The authors suggested that euchromatin with a FD higher than 2.6 is characterized by a rougher, highly branched and more space-filling surface [8].
Fractal dimension has been shown to increase in tumours as compared to the non-neoplastic normal tissues as reported by Sedivy et al., in carcinoma of the uterine cervix [4], and Mashiah et al., in Lymphomas [9].
Goutzanis et al., reported the presence of higher fractal dimensions in OSCC than normal oral mucosa. They also found that the well differentiated OSCC had significantly lower FD value (1.29) than the poorly differentiated (1.335) cases [3,10]. In partial similarity, we too observed lower FD values in controls in comparison to test cases at both ITF and TP. However, we did not observe an increasing trend FD either at ITF or TP with increase in clinical staging and histological grading.
Delides et al., also found similar results with laryngeal squamous cell carcinomas. They surmised that the nuclear FD tends to increase during the transformation of intraepithelial clones towards invasive carcinoma and with clinical staging [11].
Not restricting their focus on nuclear fractal dimension alone, some investigators have attempted to demonstrate the FD of epithelial-connective tissue interface irregularities. Rasha et al., evaluated fractal dimension of the epithelial-connective tissue interface in normal, dysplastic and malignant oral mucosa found the fractal dimension to be lowest for normal oral mucosa (1.09), followed nearly in linear increasing order by mild (1.14), moderate (1.16) and severe dysplasia (1.16). SCC showed the highest mean fractal dimension of 1.23. These results pointed out the fact that estimating the irregularities in epithelial-connective tissue interface through FD might indicate the high risk zones which favour tumour invasion [12–14].
Smolle et al., demonstrated the dependence of FD of the ITF on a complex interplay of various factors. They suggested that FD increases with tumour cell motility, heterotypic tumour cell adhesion and paracrine growth stimulation and decreases with homotypic tumour-tumour adhesion, autocrine growth stimulation and tumour and stromal destruction [15].
Increasing aggressive behaviour of oral squamous cell carcinoma is usually found in genetically unstable tumours that have more genetic or epigenetic alterations, which provoke additional complex chromatin rearrangement resulting in increased number of lighter and darker areas. The slightly higher mean FD of TP compared to ITF might be indicative of more genetic changes occurring at the Tumour Proper, during the initial clonal expansion of tumour cells imparting resistance to host defenses and conferring greater survival to the mutated clone of tumour cells.
Our study emphasizes the fact that the complexity of chromatin distribution as depicted by increased nuclear fractal dimension contains essential and invaluable prognostic information independent of clinical variables and histological grading. However, additional studies focusing on the molecular chromatin changes like altered short tandem repeats, single nucleotide repeats and their role enhancing the fractal dimension is necessary to support the above finding.
In future, deriving an appropriate cutoff of the nuclear fractal dimension might help us classify tumour as a low or high grade lesion thus enabling us to decide neoadjuant treatment requirements. Tumours of lower clinical staging and lower histological grades with higher nuclear fractals might be indicative of a treatment resistant clones.
Conclusion
Nuclear fractal dimension (FD) has been suggested to be an independent prognosticator of survival in patients diagnosed with oral squamous cell carcinoma. The present study, while limited in the sample size, has shown promising results that open new vistas for further research. Quantitative and reproducible methods with minimum error and subjectivity as presented herein could be adapted for use in automated diagnostic systems and faster screening of large numbers of histopathological sections. As the world leans away from the conventional towards technological dependency in all spheres, it remains to be seen whether nuclear fractals too will occupy a prominent place in the oncologist’s toolbox in the long term. This radical shift requires more comparisons of fractal-related studies with conventional pathological procedures.
#Independent sample T-test comparing thenuclear fractal dimension at invasive tumour front and Tumour proper of test and control cases