Biofilms are organized structures composed of microcolonies of bacterial cells, nonrandomly distributed in a shaped matrix or glycocalyx. In relation to the oral cavity, it is regarded as ‘dental plaque’ which subsequently mineralizes to form calculus. Biofilm and calculus formed on root surfaces are frequently embedded into the cemental irregularities. Root surfaces exposed to them are contaminated by toxic substances, particularly endotoxins (Adriens et al.,, Canis et al.,) [1,2].
The ideal goal of periodontal instrumentation is to remove plaque and calculus, which is carried out by Scaling and Root Planing (SRP) and performed either with manual or power-driven scalers. The advantage of manual scaling includes better control of the instruments and improved tactile perception to the operator. However, it is skill-dependent, time consuming and tiring. On the other hand power instruments like sonic and ultrasonic scalers have the advantages including access to the furcation and deep pockets, less tiredness to operator and less time consuming.
Selection of instrumentation is crucial for elimination of toxins, comfort of the patients as well as reduction of fatigue to the clinician. Although newer and advanced instruments have reduced the limitations and disadvantages to a greater extent, still their use may be associated with certain unavoidable consequences. Root surface roughness is one of the most described alterations in the literature after instrumentation, particularly in supportive periodontal therapy. The cumulative effect of minor substance removal per instrumentation performed over the years may lead to severe damage to the roots over time which may also facilitate bacterial colonization, thereby, increasing the rate of plaque formation. Various factors have been shown to influence the roughness on the instrumented root surfaces. It includes type of ultrasonic scalers, design of the tips, power settings, applied forces, angulations and instrument contact time.
Since 1960s, investigations relating to the manual and power-driven instrumentation on root surfaces have consistently produced varied and conflicting results in terms of roughness values and the loss of tooth substances (Oda et al.,) [3]. This may be related to the manner of quantification of aggressiveness, including integral calculation of the area under the profilometric curves (Flemmig et al.,) [4], subjective quantification using Field Emission Scanning Electron Microscope (FESEM). Standard method to investigate the aggressiveness of tooth substance removal and root surface roughness has not yet been established.
Therefore, this study was carried out to evaluate the roughness of root surface after instrumentation either of hand and power-driven at different power settings.
Materials and Methods
Tooth Selection and Mounting Procedures: This invitro study was conducted on 35 healthy premolars extracted for the purpose of orthodontic treatment. Approval for this study was obtained from the ethical committee of the institute. The selection criteria included: intact root surface, absence of caries, no previous periodontal involvement, absence of gross soft and hard debris, and no previous history of professional periodontal treatment.
All teeth selected for the study were rinsed with running tap water for approximately 20 seconds to remove the surface debris or blood immediately after extraction. The teeth were then stored in 2% glutaraldehyde solution till use. Each tooth was then mounted in a plastic tube filled with acrylic resin, which was of 2 cm height keeping either of the two proximal surfaces exposed without any visible surface irregularities [Table/Fig-1].
Mounting of specimens in acrylic resin block
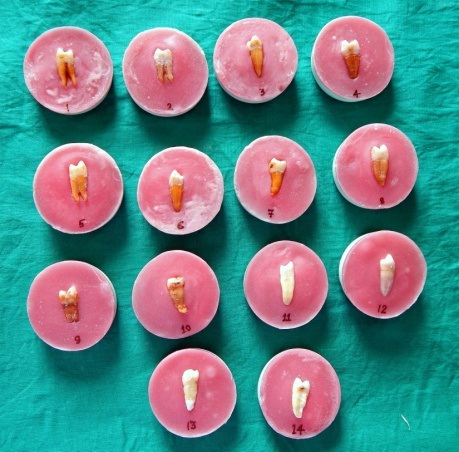
Root planing: After removal from the glutaraldehyde solution, the teeth were thoroughly washed with distilled water. Each tooth was then mounted in a plastic tube filled with acrylic resin, which was of 2 cm in height keeping either of the two proximal surfaces exposed without any visible surface irregularities. An area approximately of 5 mm which is 2 mm apical to the cementoenamel junction (CEJ) was selected for instrumentation. The samples were numbered from 1 to 35 and randomly divided in to five groups as mentioned below:
Group 1 – performed no instrumentation, regarded as control
Group 2 – performed SRP using Gracey curettes No. 5/6 (Hu-Friedy Co., Chicago, IL, USA)
Group 3 – performed SRP using ultrasonic scaler at low power setting, copius irrigation and N2 insert (Acteon Satelec Suprasson P5 Booster, France)
Group 4 – performed SRP using ultrasonic scaler at medium power setting, copius irrigation and N2 insert (Acteon Satelec Suprasson P5 Booster, France)
Group 5 – performed SRP using ultrasonic scaler at high power setting, copius irrigation and N2 insert (Acteon Satelec Suprasson P5 Booster, France)
Instrumentation was carried out by the same operator on the mounted root surface making 8-10 strokes in apicocoronal direction with very light horizontal procedure keeping the inclination between tips and roots as 0.
The surface roughness after instrumentation was measured using 3D Optical Profilometer. 10 readings were made for each sample, from which mean was calculated.
Analysis of root surface topography: For FESEM, five no. of teeth, one from each group, were selected, Each sample was sectioned mesiodistally into two halves using a diamond tapered fissure bur fixed in air rotor hand piece under copious irrigation and either of the halves was selected for the study. In the selected half, an area approximately of 5 mm which is 2 mm apical to the cementoenamel junction (CEJ) was used for the study by making two grooves in transverse direction, one at 2 mm apical to the CEJ and other at 5 mm apical to the first groove. The parts coronal and apical to the selected area were discarded. The root portion was sectioned longitudinally through the pulp canal using a double-sided diamond disc fixed in air rotor hand piece at a low-speed under copious irrigation of water (Grisi et al., and Shetty et al.,) [5,6].
The samples obtained were dehydrated by treating them with an increasing concentration of ethanol. 50% for 2 hours, 75% for 4 hours, 85% for 12 hours and 100% for 48 hours. They were then air-dried for 24 hours and then attached to metal holders. Then the samples were sputter coated and evaluated at a magnification of 200 x and 500 x.
The FESEM photographs were interpreted by three examiners, who were blinded to the treatment received. ANOVA was used for multiple group comparisons followed by Duncan multiple range test for group-wise comparisons. Comparison of means (of time taken for the procedure) was done by one-way ANOVA. Analysis was carried out with SPSS software (version 17).
Results
The mean roughness value (Ra) was found to be the highest in group 3, where SRP was performed using ultrasonic scaler at low power mode. The value was 3.03±1.54 μm (ranges being 0.85-4.88μm), which was followed by groups 2, 5 and 4, the values being 2.24±1.71 μm (ranges being 0.84-5.02 μm), 2.22±0.74 μm (ranges being 1.19-3.37 μm) and 1.49±0.57 μm (ranges being 1.06-2.59 μm), respectively. The lowest surface roughness was seen on the samples where SRP was performed using ultrasonic scaler at medium power mode (group 4).
The mean roughness (Ra) observed in the various experimental groups were compared with the control group using parametric test (analysis of variance). While comparing with the control, the roughness on the root surface in group 3 was found to be statistically significant (p<0.05) and in all the other groups the differences were not statistically significant. Again, the differences on roughness amongst the various experimental groups were not significant statistically.
Similar to the Ra, mean of the extreme roughness values, referred to as Rz, was found to be the highest in group 3, where SRP was performed using ultrasonic scaler at low power mode. It was 16.10±7.59 μm, ranges from 4.88 to 25.60μm. Rz in groups 2, 5 and 4 was 14.31±10.75 μm (ranges being 4.84-30.80 μm), 12.80±3.77 μm (ranges being 7.89-17.40 μm) and 10.71±4.42 μm (ranges being 7.51-17.3 μm), respectively.
When the root surface roughness in terms of Ra and Rz was compared and assessed, it is observed that a similar trend of roughness was followed i.e. the control group was found to be the smoothest with least roughness values [Table/Fig-2,3] which was followed by group 4 (SRP using ultrasonic scaler at medium power setting), 5 (SRP using ultrasonic scaler at high power setting), 2 (SRP using Gracey curettes) and 3 (SRP using ultrasonic scaler at low power setting) [Table/Fig-4,5,6,7,8,9,10 and 11].
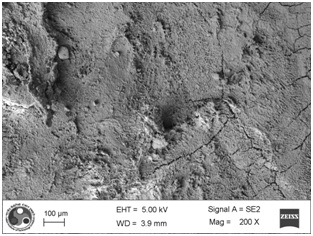
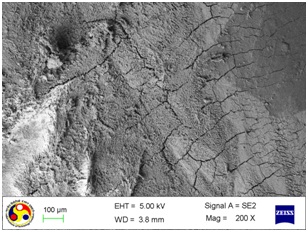
Photomicrograph showing the morphology of root surface in control group. Note the irregular and uneven surface. appearance (Magnification= x 200)
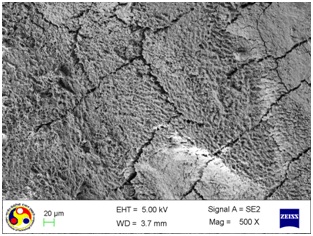
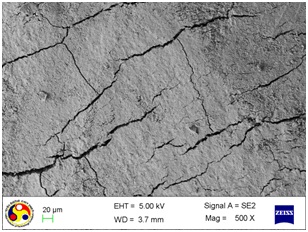
Photomicrograph showing the morphology of root surface in control group. Note the multiple cracks running in various directions with rough intervening uneven surfaces. (Magnification= x 500)
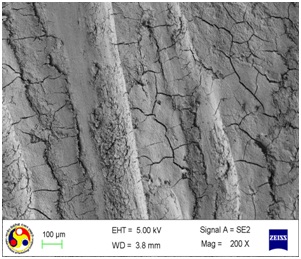
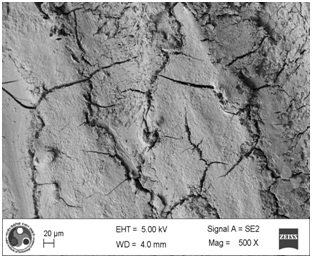
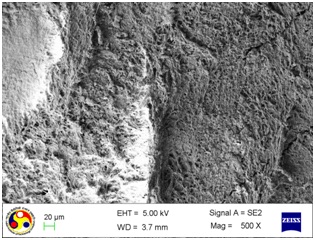
Photomicrograph showing the morphology of group treated with curette. Note: gouges of varying depth and width along with cracks running in different directions. (Magnification= x 200)
Photomicrograph showing the morphology of group treated with curette. Note: deep cleft running all over the surface. (Magnification= x 500)
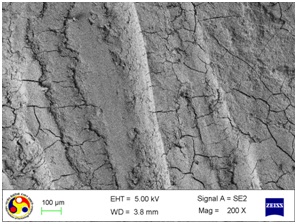
Photomicrograph showing the morphology of group treated with ultrasonic scaler at low power setting. (Magnification= x 200)
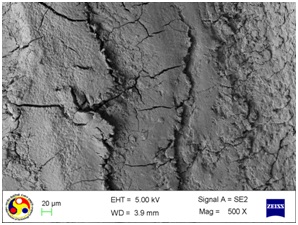
Photomicrograph showing the morphology of group treated with ultrasonic scaler at low power setting. (Magnification= x 500)
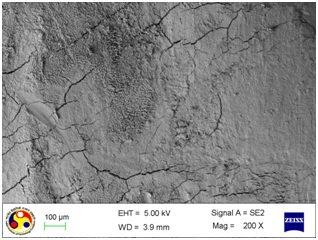
Photomicrograph showing the morphology of group treated with ultrasonic scaler at medium power setting. (Magnification = x 200)
Photomicrograph showing the morphology of group treated with ultrasonic scaler at medium power setting. (Magnification= x 500)
Photomicrograph showing the morphology of group treated with ultrasonic scaler at high power setting. (Magnification= x 200)
Photomicrograph showing the morphology of group treated with ultrasonic scaler at high power setting. (Magnification= x 500)
From the above results, it appears that maximum root surface roughness is produced in the specimens where SRP was performed with ultrasonic scaler at low power mode whereas, the smoothest surface was observed in the specimens treated using ultrasonic scalers at medium power setting [Table/Fig-12].
Mean values of extreme roughness (Rz) and roughness (Ra) with standard deviation in various groups
| Group | Rz (μm) | Ra (μm) |
|---|
| 1 | 8.95a ±3.28 | 1.47a ±0.59 |
| 2 | 14.31a ±10.75 | 2.24ab ± 1.71 |
| 3 | 16.10a ±7.59 | 3.03b ± 1.54 |
| 4 | 10.71a ±4.42 | 1.49a ± 0.57 |
| 5 | 12.80a ±3.77 | 2.22ab ± 0.74 |
values with different superscripts (a, b) indicates significant difference statistically (p<0.05)
Then the surface appearance of one sample from each group was qualitatively assessed under electron microscope using FESEM at magnification of 200X and 500X. The surface topography of the root surfaces was evaluated in the photographs obtained.
The surface topography of the control specimens at the magnification of 200X, appeared as irregular and uneven, with multiple depressions of different depth and width, and cracks of various lengths, as shown in [Table/Fig-2]. At high magnification (500X), it appears as multiple cracks running in various directions with rough intervening uneven surfaces [Table/Fig-3].
After instrumentation, difference in the surface topography was observed in each of the treated groups when compared to the control, untreated root surfaces. The instrumented surfaces showed surface gouges of varying depth and width along with cracks running in different directions.
As shown in [Table/Fig-4], the root surfaces after SRP conducted with curette become visible with multiple cracks running in various directions along with smooth surfaces in between. The smooth surface may indicate the loss of tooth substances. At higher magnification (500X), the similar appearance was seen with deeper irregularities without exposed dentinal tubules [Table/Fig-5]. Surfaces treated with the ultrasonic device varied greatly in appearance. The variation on the root surfaces varied from relatively smooth to more irregular areas with gouges, fissures and cracks of varying depths running in various directions over the area of instrumentation [Table/Fig-6,7,8,9,10 and 11].
Discussion
The objective of periodontal instrumentation is to remove plaque, calculus, endotoxins and contaminated cementum by a vigorous scaling of the root surface. Endotoxins are superficially associated with cementum, dentin and calculus and are easily removed with brushing, polishing, washing and slight scaling [7]. Maintenance of cementum and healthy dentin showed important results in histological and clinical studies, and extensive cementum and dentin removal appears to be not necessary to achieve optimal healing. Thus, following confirmation that different scaling instruments all achieve efficient tooth substance removal, the choice of the least aggressive instrument is the need of hour.
In the present study, root surface roughness and its surface topography were evaluated after root planing using different methods of instrumentation. The mean roughness value (Ra) was found to be the highest in group 3, where SRP was performed using ultrasonic scaler at low power mode. The value was 3.03±1.54 μm (ranges being 0.85-4.88 μm), which was followed by groups 2, 5 and 4, the values being 2.24±1.71μm (ranges being 0.84-5.02μm), 2.22±0.74μm (ranges being 1.19-3.37μm) and 1.49±0.57μm (ranges being 1.06-2.59μm), respectively. The lowest surface roughness was seen on the samples where SRP was performed using ultrasonic scaler at medium power mode.
The finding of this study supports the observation of other studies [8,9], who observed that minimum surface roughness on the root surfaces after ultrasonic instrumentation at medium power setting. The finding of the present study contradict the observation of Casarin et al., [10], who observed a positive correlation between the roughness of root surfaces and power setting of an ultrasonic device, which may be related to the increase lateral pressure during instrumentation due to poor tactile perception of the operator at high power setting (Belting and Spjut) [11].
In the present study, care was taken to maintain the standardization of the specimen. Only healthy premolars extracted for the purpose of orthodontic treatment were considered. The teeth involved by periodontitis and caries were not included considering the fact that aggressive removal of cementum is likely to occur due to alteration of the root surface topography and properties including hypermineralisation, hypomineralisation, etc., which may interfere with the observations (Levespere and Yukana) [12]. Teeth with attrition, abrasion and erosion were excluded as they are shown to produce secondary changes in the tooth structure like alteration in the mineral composition and the formation of sclerotic dentin (Ashwini and Mehta) [13].
The number of strokes was kept constant for each specimen in order to avoid difference in loss of tooth substance and bias in attaining the roughness values. Again, considering the influence of the design of the tips, angulations and sharpness of the working edge of scalers on the root surface roughness as well as on the surface topography (Mahantesha et al.,) [14], a new set of tips with same design and angulation was used for instrumentation of each specimen. The surface roughness after instrumentation was measured using non-contact based 3D Optical Profilometer, which is considered to be superior in recording roughness values with higher accuracy and precision.
Root surface roughness produced by sonic, ultrasonic and hand instruments have been evaluated in various studies (Lie and Leknes; Jotikasthira et al.,) [15,16]. However, the findings are not constant. Various studies showed that instrumentation performed manually produce comparatively smooth root surfaces than the ultrasonic scalers (Cross-Poline et al.,; Leon and Vogel, Laurell and Pettersson, Breininger et al.,) [17–20]. In contrast, few of the studies reported that power driven instruments (sonic and ultrasonic scalers) are better in root surface debridement with minimum surface roughness compared to that of the curettes (Walmsley et al., Jacobson et al.,; Kawashima et al.,; Vastardis et al.,) [21–24]. Again, a positive correlation between the roughness of root surfaces and power setting of an ultrasonic device was reported by Casarin et al., [25], whereas, no difference in surface roughness with the power settings of ultrasonic scaler was observed by Chapple et al., [26].
Bollen et al., suggested that surface roughness causes significant effects invivo when mean surface roughness (Ra) exceeds a threshold value of 0.2 μm [27]. Since all the studies reported so far, indicate the mean surface roughness following manual and power driven scalers is above the threshold value, it is recommended that the instruments used for SRP should leave the root surface at maintainable stage without interfering the health of periodontium.
Limitation
The sample size was small so a bigger sample size should be taken and also other instruments can be included in the study to evaluate the effect of them in root surface roughness.
Conclusion
In the light of the present study carried out to evaluate the effects of instrumentation on root surface roughness and topography, it can be concluded that instrumentation on root surface causes roughness above the threshold value irrespective of the selection of instrument and the method used. Instrumentation using ultrasonic scalers at medium power setting eliminates the need of excessive lateral pressure and at the same time allows the operator to work with sound tactile perception. Also it can be noted that no direct correlation was observed between the surface roughness and the power setting of ultrasonic scaler.
Differences observed in the present study and those of other studies may be related to the difference in sample size, the status of the root surfaces studied, operator and instrument variability, the duration of instrumentations and method of instrumentation, diverse methods of measurement and analysis, nature of the study or a combination of these variables.
However, the results of the present study are limited to the surface changes of the healthy root surface only. Thus, do not predict the invivo situation where root surfaces are facing continuous pathogenic challenge from oral microbiota. Hence, additional study which might predict the invivo situation and will guide the extent of instrumentation is required to imply the findings clinically.
values with different superscripts (a, b) indicates significant difference statistically (p<0.05)