Regular physical activity in children and adolescents promotes not only their physical health but also improves their cognition. World Health Organization (WHO) recommendations for optimal physical activity training for children and adolescents aged between 5-17 years is at least 60 minutes of structured physical activity daily comprising aerobic, muscle strengthening and bone strengthening exercises to improve the overall health [1–3]. Global School-based Student Health Survey (GSHS) states that only 37.5% of students in India meet the WHO recommendations for physical activity [4]. Many recent studies have demonstrated that aerobic exercise training is significantly associated with improved cognition in children and adolescents including attention, concentration and executive functions [5–7] whereas, others did not find any significant association [8].
Neurocognitive tests (NCT) are used not only in patients but also in healthy subjects to assess their various cognitive domains [4,9]. Tests may be administered using either traditional paper-and-pencil test battery or computerized cognitive assessment battery tests. Computerized cognitive test batteries are increasingly being used due to their ease of administration, objectivity and reduced testing time, but this may not be feasible in developing countries like India as most of the Indian schools are without access to computers.
Previous studies suggest that physical activity-cognition coupling that begins from early infancy, promotes goal-directed behaviour and cognitive development, which continues to strengthen in the later life of the child [8–10]. Executive function consists of planning, organizing, and controlling goal-directed actions [7,11]. Structuring the physical activity training to be more complex and goal directed could lead to improvement in Executive functions as cognitively engaging tasks load the cognitive processing system in the brain [9,12,13]. We hypothesize that six months of structured physical activity (SPA) training according to WHO physical activity guidelines may be more cognitively loading to the adolescents when compared to unstructured physical activity (USPA) training. Therefore, we have designed a single blinded, randomized controlled trial (Registration No. CTRI/2013/08/003897) to compare the effects of six months of globally recommended SPA with that of USPA, in healthy school going adolescents. We discuss here a part of our findings i.e., the effects of SPA and USPA on the cognitive domains of attention, concentration, psychomotor speed, non-verbal fluency, strategic analysis and mental flexibility.
Materials and Methods
The study was conducted as a collaborative project between the Department of Physiology, Jawaharlal Institute of Postgraduate Medical Education & Research (JIPMER), and a rural residential school (Jawahar Navodaya Vidyalaya), in Pondicherry, India, from 28th March, 2012 to 30th June, 2013. The study was commenced after the approval from the JIPMER Scientific Advisory Committee and JIPMER Institute Ethics Committee for human studies.
Participants: Participants were recruited from Jawahar Navodaya Vidyalaya, Pondicherry studying in grade VII to XII in the age group of 12-17 years. All the participants were full time school residents, and belonged to lower socio-economic group. After explaining the study to the participants, their written informed assent and a written consent from their local guardian or parents were obtained. The study intervention was incorporated into the school curriculum as a part of the “National Adolescent Program”. Age of the participants was taken from the date of birth specified in their school records.
Students who volunteered for the study (n=451; boys: 255, girls: 196) underwent a general physical examination and were screened for any physical or mental ailments. Participants with history of previous or current neurological disorder, alcohol abuse, epilepsy, mental retardation or any drug intake were excluded from the study and 439 students (boys: 250, girls: 189) were recruited. The participants were randomized into two groups: Structured Physical Activity (SPA) group (n= 219: boys 124, girls 95) and unstructured physical activity (USPA) group (n=220; boys: 126, girls: 94). Based on their athletic training status, the participants in both groups were further subdivided into the following four sub-groups: SPA athlete (n = 39; boys: 22, girls: 17), SPA non-athlete (n = 180; boys: 102, girls: 78), USPA athlete (n = 40; boys: 23, girls: 17) and USPA non-athlete (n = 180; boys: 103, girls: 77). The flow of the study is given in [Table/Fig-1].
Flow Diagram of the study
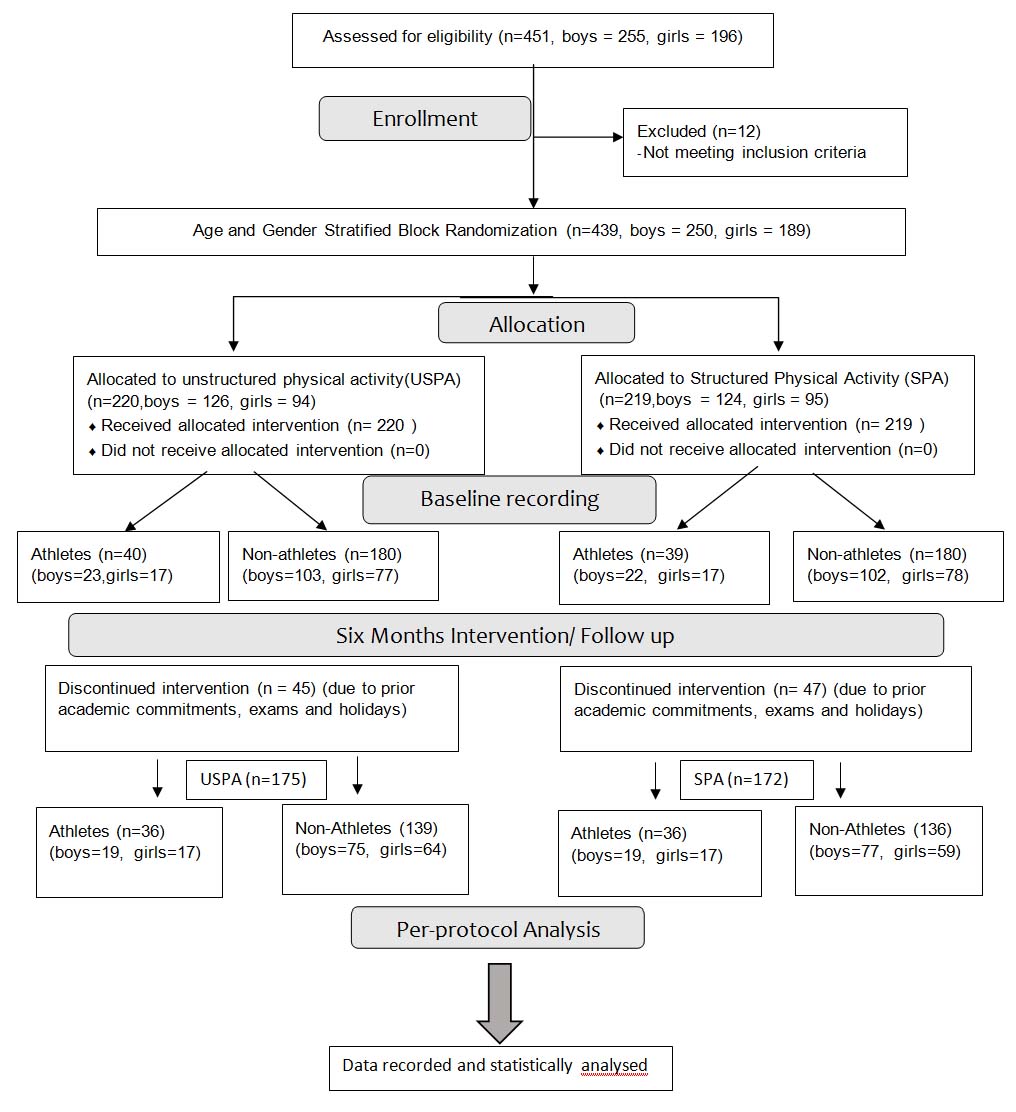
The athlete students included in the study are those who were routinely participating in national level interscholastic sporting events that included football, volleyball, badminton, basketball, kho-kho, and kabaddi. They were routinely undergoing supervised physical conditioning training for a minimum of 25 hours a week.
Sample size: Sample size was estimated to detect the minimum difference of 10% of Letter cancellation test (time) between the groups at the 5% level of significance and 90% power. The sample size required for the study was 120. The sample size was further modified to 145 in each group with an expected dropout of 20%. We were able to achieve the sample size of n=139 in unstructured physical activity group and n=136 in structured physical activity group)
Randomization: Participants were age and gender stratified and then randomized using sequentially numbered, sealed, opaque envelope technique with block size 8 and allocation ration 1:1. The principal investigator (Dr. Vivek Kumar Sharma) enrolled the participants, and co-investigator (Dr. Senthil Kumar Subramanian) did the randomization and allocation of participants to the specific group. The outcomes were analysed by the principal investigator who was blinded to the randomization procedure.
Intervention: Structured physical activity was designed by following the physical activity guidelines for adolescents given by the World Health Organization (WHO) and the Department of Health, UK i.e., structured physical activity of 60 minutes per day to meet the goal of at least 30 minutes per day, three times a week, of vigorous intensity physical activity, muscle strengthening & stretching and bone strengthening exercises [1–3]. The details of the SPA schedule are enclosed in the Annexure: JNV module. Physical activity sessions were administered by the school physical education instructors. They submitted the attendance and progress report of the training sessions to the investigators every week. Sessions were administered in separate playgrounds for each group to minimize cross-contamination. In the SPA non-athletes group, the participants were given SPA training for duration of two hours a day, six days a week, for six months. In the SPA athletes group, the participants were given SPA training for the same duration apart from their routine sport specific physical conditioning training. The intensity of the exercise was monitored by perceived effort scale (0 is the level of sitting idle and 10 is maximal effort) or by randomly measuring the pulse rate during the physical activity sessions (50-70% of maximal heart rate moderate intensity, >70% vigorous intensity).
In the USPA group, the participants were given supervised but unstructured physical activity for duration of two hours a day, six days a week, for six months. They were free to choose any indoor or outdoor recreational activity as per their wish, on any given day. Indoor recreational activities include gymnasium, music, drawing, and craft. Outdoor recreational activities include football, basketball, kho-kho, badminton, basketball, skipping, and gardening. Athletes in the USPA group continued their sport-specific physical conditioning training and participated in any USPA of their liking on any given day, for the above-mentioned duration [14].
Parameters: We chose those paper and pencil tests that are commonly used in the literature so that the results are easy comparable with other studies [15] and for the ease of administration in those places where computer is still not available. One practice sesion was given to all the participants 3 days before the baseline recording as scores for NCT has been shown to significantly improve between the first and second administrations of the NCT. Students were asked to report to the school examination room at 9 AM, two hours after having a light breakfast on the day of the tests.
NCT consisted of following tests and administered in the same order as mentioned below:
Two target letter cancellation test (LCT): The subjects were instructed to cancel out randomly placed letters ‘E’ and ‘C’ from six 52-character rows of letters of the English alphabet. The score was the time taken (in seconds) to complete the task [16,17].
Trail Making Test A and B (TTA & TTB): In trail making test A, participants were instructed to connect 25 consecutively numbered circles in straight lines. In trail making test B, participants were instructed to connect 25 numbered and lettered circles in straight lines by altering between the two sequences. The score was the time taken (in seconds) to complete the task [18,19].
Ruff Figural fluency Test (RFFT): Subjects were presented with a sheet of paper with 40 similar boxes, each containing five-dot pattern similar to dice arrangement. They were instructed to create dissimilar patterns by connecting all the dots in a box with straight lines within five-minute duration. The score was the total number of unique patterns created, rotations of these patterns and number of patterns repeated (perseverations).
This NCT was again administered to all the participants after six months of intervention. We have discussed the effect of age and sex on these parameters in our earlier publication [20].
Statistical Analysis
Results were analysed only for those participants who had completed the respective intervention with more than 80% attendance (per-protocol analysis). Interventions were completed by 347 participants (boys: 190, girls: 157) grouped as follows: SPA-Non athlete (n = 136, boys: 77, girls: 59), SPA athlete (n = 36, boys: 19, girls: 17), USPA Non-athlete (n = 139, boys: 75, girls: 64), USPA athlete (n = 36, boys: 19, girls: 17). The data were recorded and statistically analysed using the SPSS software, version 19, by the principal investor (who was blinded to the group allocation). Between groups analysis was done using unpaired t-test for normally distributed data and Mann-Whitney U test for non-normally distributed data. Within group analysis was done using paired t-test. Effect of intervention was quantified using effect size Pearson ‘r’ correlation coefficient.
Results
[Table/Fig-1] shows the flow of the study.
[Table/Fig-2] shows that subjects in both the groups have no significant difference in their baseline height, weight and age comparison. Randomization has ensured equal distribution of subjects according to their sex (boys and girls) and physical activity status (athletes and non-athletes). Further in sub-group analysis based on physical activity status, baseline height, weight and age of the subjects showed no significant difference in both the USPA and SPA groups.
Comparison of basal demographic parameters between USPA and SPA.
| Group Statistics | Unstructrued Physical Activity (175) | Structured Physical Activity (172) | P value |
|---|
| Mean | SD | Mean | SD |
|---|
| overall | n = 175 | n=172 | |
| Height (m) | 1.52 | 0.11 | 1.52 | 0.10 | .985 |
| Weight (kg) | 44.50 | 8.67 | 44.77 | 8.95 | .775 |
| Age (years) (median(min-max)) | 14(12-16) | 14 (12-16) | .986 |
| Boys/Girls | 94/81 | 96/76 | .746 |
| Athlete/ non-athlete | 139/36 | 136/36 | .934 |
| Non Athlete | n=139 | n=136 | |
| Height (m) | 1.52 | 0.11 | 1.52 | 0.11 | .898 |
| Weight (kg) | 44.43 | 8.95 | 44.30 | 9.08 | .905 |
| Age (years) (median(min-max)) | 14 (12-16) | 14 (12-16) | .920 |
| Boys/Girls | 75/64 | 77/59 | .657 |
| Athlete | n=36 | n=36 | |
| Height (m) | 1.52 | 0.10 | 1.53 | 0.08 | .736 |
| Weight (kg) | 44.78 | 7.60 | 46.56 | 8.32 | .347 |
| Age (years) (median(min-max)) | 14 (12-15) | 14 (12-16) | 1.000 |
| Boys/Girls | 19/17 | 19/17 | 1.000 |
Data are expressed in Mean and SD for normally distributed data, Median (min-max) for non-normally distributed data and in frequencies for categorical data. Between groups comparison was done using unpaired Student t-test for normally distributed data, Mann-Whitney U test for non-normally distributed data and Chi- Square test for categorical data
[Table/Fig-3] shows that there was no baseline difference between groups in the tested neuro-cognitive parameters. There was significant improvement in LCT omission, LCT time, TTA, TTB, and RFFT (designs, rotations and perseverations) in both USPA and SPA groups after six months of respective interventions. On comparison of pre-post difference between the groups, SPA group showed significantly better improvements in LCT time, TTB and RFFT (designs, rotations and perseverations).
Comparison of Unstructured Physical Activity group and Structured Physical Activity group
| Parameters | Unstructured Physical Activity (175) | Structured Physical Activity (172) | Baselinecomparison(Pre vs pre)p-value | Comparisonof pre postdifference betweengroupsp-value |
|---|
| Pre | Post | pre vs post | Pre | Post | pre vs post |
|---|
| Mean | SD | Mean | SD | P value | effect size | Mean | SD | Mean | SD | P value | effect size |
|---|
| LCT omission(median(min-max)) | 1.00(0.00 - 9.00) | 0.00(0.00 – 4.00) | <.001 | - | 1.00(0.00 - 5.00) | 0.00(0.00 – 4.00) | <.001 | - | .657 | .086 |
| LCT commission (median(min-max)) | 0.00(0.00 – 4.00) | 0.00(0.00 – 2.00) | .061 | - | 0.00(0.00 – 2.00) | 0.00(0.00 – 2.00) | .317 | - | .412 | .305 |
| LCT time (s) | 114.60 | 21.73 | 109.51 | 18.86 | <.001 | 0.53 | 111.56 | 21.69 | 98.60 | 18.61 | <.001 | 0.78 | .193 | <.001 |
| Trial Making Test A (s) | 41.70 | 7.46 | 38.19 | 6.01 | <.001 | 0.52 | 41.05 | 6.82 | 36.89 | 5.50 | <.001 | 0.56 | .394 | .527 |
| Trial Making Test B (s) | 102.84 | 30.03 | 93.67 | 26.81 | <.001 | 0.71 | 101.15 | 30.08 | 89.63 | 23.82 | <.001 | 0.78 | .602 | .009 |
| RFFT Designs | 14.99 | 4.90 | 18.90 | 4.57 | <.001 | 0.73 | 14.42 | 4.89 | 20.30 | 4.21 | <.001 | 0.87 | .279 | <.001 |
| RFFT Rotations | 6.68 | 2.81 | 7.43 | 2.44 | <.001 | 0.30 | 6.42 | 2.48 | 7.85 | 2.78 | <.001 | 0.50 | .370 | .012 |
| RFFT Perseverations | 18.33 | 5.99 | 13.67 | 5.39 | <.001 | 0.73 | 19.16 | 5.95 | 11.85 | 5.65 | <.001 | 0.90 | .199 | <.001 |
Data are expressed in Mean and SD for normally distributed data and in Median (min-max) for non-normally distributed data. Baseline between group analyses was done using unpaired Student t-test for normally distributed parameters and by Mann Whitney U test for non-normally distributed parameters. Within group analysis (pre vs post) was done using paired Student t-test. Pre-post difference in unstructured physical activity group was compared with pre-post difference in structured physical activity group using Mann-Whitney U test
[Table/Fig-4] shows that there was no baseline difference of tested parameters in non-athletes of both groups. There was significant improvement in LCT omission, LCT time, TTA, TTB, and RFFT in both USPA and SPA non-athlete groups after six months of intervention. In addition, improvements seen in in LCT (time), TTB, RFFT patterns and perseverations in SPA non-athletes group, was significantly better when compared to that seen in USPA non-athletes.
Comparison of Unstructured Physical Activity group and Structured Physical Activity group in non-athletes
| Parameters | Unstructured Physical Activity (139) | Structured Physical Activity (136) | Baseline comparison(Pre vs pre)p-value | Comparison of pre post difference between the groups p-value |
|---|
| Pre | Post | pre vs post | Pre | Post | pre vs post |
|---|
| Mean | SD | Mean | SD | P value | effect size | Mean | SD | Mean | SD | P value | effect size |
|---|
| LCT omission (median(min-max)) | 1.00(0.00 - 9.00) | 0.00(0.00 – 4.00) | <.001 | - | 1.00(0.00 - 5.00) | 0.00(0.00 – 4.00) | .012 | - | .453 | .070 |
| LCT commission (median(min-max)) | 0.00(0.00 – 4.00) | 0.00(0.00 – 2.00) | .167 | - | 0.00(0.00 – 2.00) | 0.00(0.00 – 2.00) | .102 | - | .201 | .362 |
| LCT time (s) | 117.00 | 21.68 | 110.78 | 19.54 | <.001 | 0.611 | 112.74 | 21.56 | 98.22 | 18.79 | <.001 | 0.800 | .104 | <.001 |
| Trial Making Test A (s) | 42.66 | 7.37 | 38.31 | 6.14 | <.001 | 0.590 | 41.83 | 6.56 | 36.54 | 5.44 | <.001 | 0.647 | .321 | .307 |
| Trial Making Test B (s) | 105.34 | 31.38 | 95.01 | 28.51 | <.001 | 0.739 | 102.97 | 30.77 | 90.21 | 24.71 | <.001 | 0.809 | .527 | .008 |
| RFFT Designs | 14.45 | 4.69 | 18.78 | 4.72 | <.001 | 0.748 | 13.82 | 4.54 | 20.46 | 4.25 | <.001 | 0.914 | .259 | <.001 |
| RFFT Rotations | 6.33 | 2.66 | 6.95 | 2.32 | .003 | 0.247 | 6.27 | 2.40 | 7.49 | 2.66 | <.001 | 0.422 | .847 | .074 |
| RFFT Perseverations | 19.22 | 5.71 | 14.27 | 5.58 | <.001 | 0.728 | 19.90 | 5.53 | 12.04 | 5.62 | <.001 | 0.910 | .311 | <.001 |
Data are expressed in Mean and SD for normally distributed data and in Median (min-max) for non-normally distributed data. Baseline between group analyses was done using unpaired Student t-test for normally distributed parameters and by Mann-Whitney U test for non-normally distributed parameters. Within group analysis (pre vs post) was done using paired Student t-test. Pre-post difference in unstructured physical activity group was compared with pre-post difference in structured physical activity group using Mann-Whitney U test
[Table/Fig-5] shows that there was no baseline difference in tested parameters in athletes of both groups. There was significant improvement in LCT (omission), TTB & RFFT (designs, rotations and perseverations) in USPA athlete group after six months of intervention. Significant improvement in LCT (Omissions & time), TTB, & RFFT (designs, rotations, and perseverations) was observed in SPA athlete group after. In addition, improvements seen in LCT (time) and RFFT perseverations in SPA athletes group, was significantly better when compared to that seen in USPA athletes.
Comparison of Unstructured Physical Activity group and Structured Physical Activity group in Athletes
| Parameters | Unstructured Physical Activity (36) | Structured Physical Activity (36) | Baseline comparison(Pre vs pre)p-value | Comparison of pre post difference between the groups p-value |
|---|
| Pre | Post | pre vs post | Pre | Post | pre vs post |
|---|
| Mean | SD | Mean | SD | P value | effect size | Mean | SD | Mean | SD | P value | effect size |
|---|
| LCT omission (median(min-max)) | 1.00(0.00 - 9.00) | 0.00(0.00 – 2.00) | <.001 | - | 1.00(0.00 - 5.00) | 0.00(0.00 – 2.00) | .006 | - | .653 | .964 |
| LCT commission (median(min-max)) | 0.00(0.00 – 2.00) | 0.00(0.00 – 1.00) | 1.000 | - | 0.00(0.00 – 1.00) | 0.00(0.00 – 1.00) | .157 | - | .502 | .627 |
| LCT time (s) | 105.33 | 19.54 | 104.61 | 15.22 | .528 | 0.107 | 107.08 | 21.87 | 100.03 | 18.12 | <.001 | 0.784 | .721 | <.001 |
| Trial Making Test A (s) | 38.00 | 6.71 | 37.75 | 5.50 | .672 | 0.072 | 38.11 | 7.07 | 38.22 | 5.59 | .854 | 0.031 | .946 | .598 |
| Trial Making Test B (s) | 93.19 | 21.88 | 88.50 | 18.29 | .000 | 0.663 | 94.31 | 26.61 | 87.44 | 20.27 | <.001 | 0.668 | .847 | .477 |
| RFFT Designs | 17.06 | 5.18 | 19.36 | 3.97 | .000 | 0.668 | 16.67 | 5.54 | 19.67 | 4.03 | <.001 | 0.696 | .759 | .339 |
| RFFT Rotations | 8.03 | 3.02 | 9.28 | 1.97 | .002 | 0.493 | 7.00 | 2.74 | 9.19 | 2.87 | <.001 | 0.828 | .135 | .055 |
| RFFT Perseverations | 14.92 | 5.89 | 11.36 | 3.85 | .000 | 0.759 | 16.33 | 6.66 | 11.14 | 5.80 | <.001 | 0.901 | .342 | .013 |
Data are expressed in Mean and SD for normally distributed data and in Median (min-max) for non-normally distributed data. Baseline between group analyses was done using unpaired Student t-test for normally distributed parameters and by Mann-Whitney U test for non – normally distributed parameters. Within group analysis (pre vs post) was done using paired Student t-test. Pre-post difference in unstructured physical activity group was compared with pre-post difference in structured physical activity group using Mann-Whitney U test
[Table/Fig-6] demonstrates that there was significantly higher percentage improvement in LCT, TTB and RFFT in SPA group than in USPA group. Further, on subgroup comparison there was significantly higher improvement in SPA group in LCT (time), TTB & RFFT (patterns) with a decrease in perseverations. In athlete groups also, significantly higher improvement was seen in SPA group in LCT (time) & RFFT (rotations) with a decrease in perseverations.
Comparison of percentage difference (pre–post) between Unstructured Physical Activity group and Structured Physical Activity group.
| Parameters | Unstructured physical activity | Structured Physical Activity | p-value |
|---|
| Overall | Median | Min -max | Median | Min -max |
|---|
| % difference LCT time | 3.79 | -16.13 – 19.83 | 9.50 | -5.33 – 42.03 | <.001 |
| % difference TTA | 9.68 | -34.38 – 38.89 | 8.57 | -31.43 – 42.86 | .430 |
| % difference TTB | 8.75 | -15.38 – 37.98 | 10.40 | -8.11 – 29.00 | .002 |
| % difference RFFT designs | -25.00 | -220.00 – 41.18 | -41.18 | -300.00 – 10.53 | <.001 |
| % difference RFFT rotations | 0.00 | -700.00 – 66.67 | -11.11 | -400.00 – 42.86 | .029 |
| % difference RFFT perseverations | 25.00 | -60.00 – 80.00 | 37.27 | 0.00 – 100.00 | <.001 |
| Non-athlete | n = 139 | n=136 | |
| % difference LCT time | 4.90 | -13.22 – 19.83 | 10.70 | -3.75 – 42.03 | <.001 |
| % difference TTA | 11.36 | -34.38 – 38.89 | 13.51 | -31.43 – 42.86 | .194 |
| % difference TTB | 9.32 | -15.38 – 37.98 | 13.51 | -31.43 – 42.86 | .004 |
| % difference RFFT designs | -30.00 | -185.71 – 41.18 | 11.86 | -8.11 – 29.00 | <.001 |
| % difference RFFT rotations | 0.00 | -700.00 – 66.67 | 0.00 | -400.00 – 42.86 | .138 |
| % difference RFFT perseverations | 26.92 | -60.00 – 80.00 | 39.34 | 0.00 – 100.00 | <.001 |
| Athlete | n=36 | n=36 | |
| % difference LCT time | -0.94 | -16.13 – 12.41 | 6.13 | -5.33 – 15.84 | <.001 |
| % difference TTA | 0.00 | -17.24 – 22.22 | -2.29 | -17.24 – 21.43 | .513 |
| % difference TTB | 6.25 | -14.29 - 11.11 | 6.65 | -7.46 – 19.9 | .374 |
| % difference RFFT designs | -10.32 | -220.00 - 11.11 | -13.33 | -216.67 – 5.56 | .398 |
| % difference RFFT rotations | -16.67 | -300.00 – 30.00 | -29.29 | -150.00 – 0.00 | .053 |
| % difference RFFT perseverations | 21.24 | -33.33 – 54.55 | 30.39 | 16.67 – 100.00 | .002 |
Data are expressed in Mean and SD for normally distributed data and in Median (min-max) for non-normally distributed data. Between groups analysis was done using Mann-Whitney U test.
Discussion
Our results show that there was significant improvement in all the tested parameters in both SPA and USPA groups after six months of intervention. Thus, our study findings confirm that physical activity training, both structured and unstructured, improves the perceptual cognitive abilities of adolescents [5,8–10,15,21]. Physical activity of at least two hours duration every day, for six months, improves the cognitive functioning of adolescents even when the physical activity is unstructured as in when the adolescents are let free to choose their activity of choice. Our results corroborate with previous studies which have also found similar effects on cognitive functioning of children and adolescents after aerobic exercise interventions [5,8–10,15,21]. However, to the best of our knowledge, there is no study conducted in which USPA has been compared with SPA in adolescents for the long duration of six months. Our findings demonstrate that there was overall significantly higher percentage improvements observed in SPA group subjects in the cognitive domains of attention, concentration, mental flexibility, and non-verbal fluency than USPA group subjects. Further, on sub-group analysis, we observed that there was significantly higher percentage improvements in SPA non-athlete group in LCT, TTB & RFFT when compared to that seen in USPA non-athlete group whereas, more improvement in SPA-athlete group was seen only in LCT and RFFT when compared to that seen in USPA-athlete group. These observations suggest that even if adolescents are undergoing physical conditioning athletic training, structuring of physical activity further improves their cognitive functioning. We hypothesize that SPA is better than USPA because it may be due to a higher number and intensity of cognitive loading components in the module that included yoga, moderate-high intensity endurance exercises and higher number of sports activities.
We hypothesize to explain our findings with the help of the following established mechanisms (that act as a link between physical activity and cognition):
Along with improved cardio respiratory fitness (CRF), PA components interact with cognitive components situated in Prefrontal cortex (PFC), Anterior cingulate cortex (ACC) and Insular cortex (IC) by top-down and bottom-up bidirectional mechanisms at multiple neuraxial levels to positively impact executive functions [22–24] and induce better outflow signals from the brain leading to reduced stress, HPA axis suppression and higher ability to concentrate and execute the given task.
SPA module included many group activities and team sports that involves complex cognitive tasks such as attention to the movements of teammates and opponents, spatial positioning of moving objects, pre-empting the opponent’s moves, anticipatory responses to game tasks, and adaptation to ever-changing in-game scenarios. This may cause increased bi-direction co-activation of cortical and sub-cortical structures leading to improvement in the attentional tasks.
In the scenario of continually changing task demands, the motor plan ideated must be monitored, modified and regulated in order to successfully accomplish the task [25–27]. When the training components are presented in a complex and qausi-random manner, there is a learning benefit observed and this is called as contextual interference. SPA training presents complex and cognitively engaging tasks and provides contextual interference by presenting the different motor and executive tasks in a random manner, thereby inducing profound changes in the brain and better neuro-effector communication. Probably, these may have resulted in the observed improvements in neuro-cognitive parameters in SPA group subjects.
Thus, long-term participation in both USPA and SPA trains the individual in executing complex motor movements and cognitively engaging tasks like goal-directed thinking, thereby influencing their brain executive functioning, however, the improvement is comparatively less with USPA which may involve more repetitive PA tasks such as walking and running.
Strengths and Limitations
The study was done in a residential school where all the students were provided balanced food and had equal opportunity for physical activity. This could have helped us to reduce the effect of cultural and socio-economic differences among the participants. In addition, it was possible for us to do uniform implementation and monitoring of SPA and USPA training in the school. However, we were not able to avoid cross contamination between the groups.
Except for some minor injuries on the field, that were attended to immediately by the resident nursing staff in the school, there were no serious adverse events during the trial period.
Dropout rate was nearly 20% in each group and the common reasons for dropping out were academic commitments, term exams, and subsequent holidays.
Conclusion
Our study demonstrates that WHO recommended structured physical activity training in adolescents provides additional benefit in their neurocognitive improvements when compared to unstructured physical activity training.
Data are expressed in Mean and SD for normally distributed data, Median (min-max) for non-normally distributed data and in frequencies for categorical data. Between groups comparison was done using unpaired Student t-test for normally distributed data, Mann-Whitney U test for non-normally distributed data and Chi- Square test for categorical data
Data are expressed in Mean and SD for normally distributed data and in Median (min-max) for non-normally distributed data. Baseline between group analyses was done using unpaired Student t-test for normally distributed parameters and by Mann Whitney U test for non-normally distributed parameters. Within group analysis (pre vs post) was done using paired Student t-test. Pre-post difference in unstructured physical activity group was compared with pre-post difference in structured physical activity group using Mann-Whitney U test
Data are expressed in Mean and SD for normally distributed data and in Median (min-max) for non-normally distributed data. Baseline between group analyses was done using unpaired Student t-test for normally distributed parameters and by Mann-Whitney U test for non-normally distributed parameters. Within group analysis (pre vs post) was done using paired Student t-test. Pre-post difference in unstructured physical activity group was compared with pre-post difference in structured physical activity group using Mann-Whitney U test
Data are expressed in Mean and SD for normally distributed data and in Median (min-max) for non-normally distributed data. Baseline between group analyses was done using unpaired Student t-test for normally distributed parameters and by Mann-Whitney U test for non – normally distributed parameters. Within group analysis (pre vs post) was done using paired Student t-test. Pre-post difference in unstructured physical activity group was compared with pre-post difference in structured physical activity group using Mann-Whitney U test
Data are expressed in Mean and SD for normally distributed data and in Median (min-max) for non-normally distributed data. Between groups analysis was done using Mann-Whitney U test.