Everything that takes place within the classroom, department, faculty or university is the ‘Educational Environment’ and plays decisive role in determining the success of undergraduate medical education [1]. It is among the most important factors in the process of teaching and learning such as teachers, curriculum, resources, etc. It has been suggested that encouraging learning environment is a major determinant of motivation for learning and can lead to increased satisfaction, achievement and success of medical students [2]. The effectiveness of an educational program depends on quality of the EE in which students learn. The quality of the EE correlates positively with the academic success and satisfaction with educational programs [3].
Perceptions of Students’ about the EE has pivotal role in executing modifications and thus optimizing the EE [4]. It is possible to assess and modify the EE by employing appropriate methods and instruments to assess it [5]. The Dundee Ready Education Environment Measure (DREEM) questionnaire is very precise to the distinctive environment experienced by all students of healthcare courses [1,6]. This can be used as a device to emphasize the strengths and weaknesses of an educational institution, compare the performance and effectiveness of different medical schools, and make comparisons among students in different years of study and differences between the genders. It can also be advocated to modify curriculum and to compare it with previous one [5].
Meaningful learning correlates positively with the students’ perceptions of the educational environment, which impacts on students’ learning experiences and outcomes. Present study is therefore planned to assess the perceptions of medical students (studying in SKNMC & GH for more than 3 months) concerning their educational environment.
Materials and Methods
Design and study population: This cross-sectional study involved all three years medical students studying in SKNMC&GH for >3 months; who were surveyed with DREEM questionnaire [5] designed for them. The questionnaire was adapted from the previous studies that assessed perception of students in medical and healthcare related courses about educational environment; few modifications were done in the questionnaire to best fit for them.
Data collection: In this cross-sectional study, after taking ethical approval (Ref. SKNMC/Ethics/App/2014/02; Date: 27/11/2014) questionnaires were distributed to medical students in all three years. Data was collected using a DREEM questionnaire [5] which consisted of 50 items based on the Likert scale (scores range from 0 to 200); where 4 = strongly agree (SA) and 0 = strongly disagree (SD). Questionnaire consisted of total five domains namely students’ perceptions of learning (SPL, 48), perceptions of teachers (SPT, 44), academic self-perceptions (SAP, 32), perceptions of atmosphere (SPA, 48) and social self-perceptions (SSP, 28). Item scores were counted towards an overall environment score out of 200 as well as one of five subscales or domains which were further categorized with reference to the score [Table/Fig-1]. There were nine negative statements out of 50 (viz.8,12,15,16,21,23,34,39,45) which were given reverse score i.e. 0 = strongly agree (SA) and 4 = strongly disagree (SD), so that a higher score would indicate more positive responses [1,5]. Items with score <2 were identified as problem areas. Incomplete questionnaires were excluded from the analysis. The questionnaire validation was done by a pilot study on 15 students.
Scores to be obtained for subscales by the study population
| DREEM and its subscales | Maximum score | Categorization of subscale |
|---|
| All items | 200 | 1. | Very poor (<50) |
| 2. | Plenty of problems (51-75) |
| 3. | More positive than negative (76-150) |
| 4. | Excellent (>150) |
| Students’ perception of learning(SPL) | 48 | 1. | Very poor(<12) |
| 2. | Teaching is viewed negatively (13-24) |
| 3. | A more positive perception (25-36) |
| 4. | Teaching highly though of (>36) |
| Students’ perception of teachers(SPT) | 44 | 1. | Abysmal/very bad (<11) |
| 2. | In need of some retraining (12-22) |
| 3. | Moving in the right direction (23-33) |
| 4. | Model teachers (>33) |
| Students’ academic self perception(SAP) | 32 | 1. | Feeling of total failure (<8) |
| 2. | Many negative aspects (9-16) |
| 3. | Feeling more on positive side (17-24) |
| 4. | Confident (>24) |
| Students’ perception of atmosphere(SPA) | 48 | 1. | A terrible environment (<12) |
| 2. | There are many issues which need changing (13-24) |
| 3. | A more positive atmosphere (25-36) |
| 4. | A good feeling overall (>36) |
| Students’ social self perception(SSP) | 28 | 1. | Miserable (<7) |
| 2. | Not a nice place (7-14) |
| 3. | Not too bad (15-21) |
| 4. | Very good socially (>21) |
Questionnaire validation
Questionnaire validation was done in 15 (5–10%) students to review the questionnaire to determine whether the questionnaire measured what it was designed to measure. Content validation method was used for the validation procedure [6,7]. Answer to each question was reviewed by our experts and the requisite modifications and deletions were done to validate the 50 questions in the questionnaire. The following validation criteria were used:
Time requirement for completion of questionnaire (5–10 min)
Appropriateness of questionnaire for collecting data
Repetition or inappropriate questions
Logical order of questions
Clear, concise and unambiguous questions
Easy and meaningful instructions
Comments and suggestions specified to the application guidelines [8].
Statistical Analysis
Data was analysed using OpenEpi software (version 2.1) and presented as Mean ± SD. Independent sample t-test were used to determine statistically significant difference (p<0.05). Gender specific comparison was done using Mann-Whitney statistical test.
Results
The questionnaire was administered to total 410 medical students studying in three different years. Out of them 380 (92.68%) students responded to the questionnaire. Year wise data is presented in [Table/Fig-2].
Response rate and demographic data of the participants
| Variable | Year 1 | Year 2 | Year 3 |
|---|
| Mean age(yrs) ± SD | 18.2±1.2 | 19.6±1.3 | 22.9±1.2 |
| Gender (M/F) | 58/80 | 61/63 | 56/62 |
| Respondents (%) | 138/143 (96.5) | 124/133 (92.7) | 118/134 (86.4) |
| Localite / Hostelite | 28/110 | 17/107 | 13/105 |
Mean scores on the subscales and overall DREEM scale is presented in [Table/Fig-3].
Mean scores on the subscales and overall tool for three year medical students
| Subscale (score) | Year 1 (N=138) | Year 2 (N=124) | Year 3 (N=118) | Interpretation |
|---|
| SPL (48) | 34.5±2.3 | 37.8±2.4*† | 34.2±2.6 | A more positive perception |
| SPT (44) | 27.8±1.8 | 31.6±2.1* | 33.2±1.6* | Moving in the right direction |
| SAP (32) | 18.3±2.3 | 22.3±2.1* | 22.4±2.3 | Feeling more on positive side |
| SPA (48) | 29.2±1.8 | 30.2±2.2 | 30.1±2.6 | A more positive atmosphere |
| SSP (28) | 16.6±1.2 | 16.4±1.4 | 15.4±1.6 | Not too bad |
| All items (200) | 131.4±1.6 | 141.3±2.3*† | 135.3±1.7* | More positive than negative |
N=380, values are Mean ± SD. * p<0.05 compared to first year and † p<0.05 when compared between second and third year.
It shows the mean DREEM domain scores for all the three years. Overall, the students had positive perception and more positive scores than negative toward EE. The mean DREEM scores for SPL, SPT and SAP domains were reported to be significantly higher in 2nd year students. The mean DREEM scores were 131.4/200 for 1st year, 141.3/200 for 2nd year and 135/200 for the 3rd year students. In general, the total DREEM domain scores were found to be higher for 2nd year students.
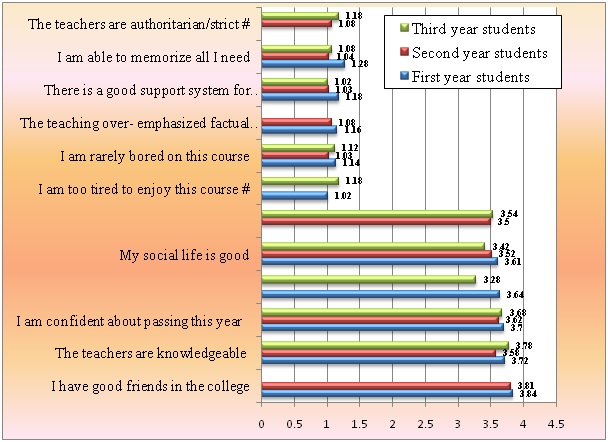
According to DREEM scoring system, items having a mean score of ≥3.5 are positive points, ≤2 indicate problem areas, and between 2 and 3 are aspects of the study environment that could be improved. The 1st year students scored less than 2 for items (8, 28, 44, 45 and 46) and above 3 for items (13, 25, 31, 47 and 48), 2nd year students scored less than 2 for items (8, 16, 28, 44 and 46) and above 3 for item (13,25, 27, 47 and 48) whereas, 3rd year students scored less than 2 for items (16, 28, 44, 45 and 46) and above 3 for item (13,25, 27, 31 and 48). Scoring patterns in all the years were similar except for 6 items (8, 16, 27, 31, 45 and 47). [Table/Fig-4]
Five individual items with the lowest and highest scores among three years. (# The statements with negatively worded items and reversed scoring)
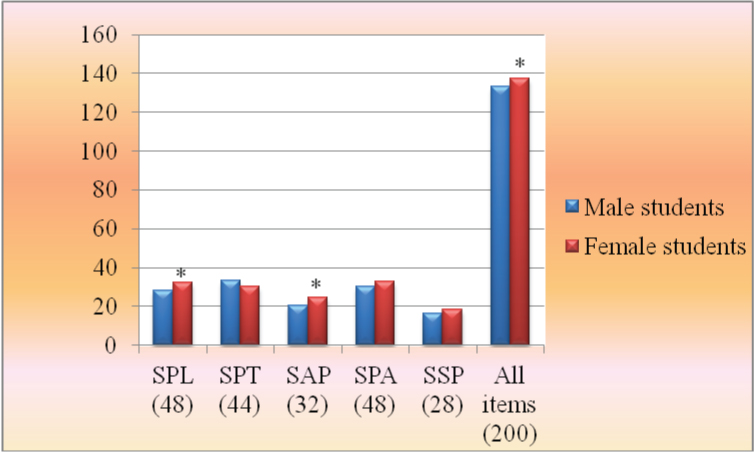
Nine items (1, 5, 14, 17, 22, 32, 33, 38 and 49) showed statistically significant difference between the three year’s students [Table/Fig-5]. Female students assigned significantly higher score in SPL, SAP domains and mean DREEM score for all items [Table/Fig-6].
Items with statistically significant different scores among three years
| Domain | Item | Statement | Year 1(N=138) | Year 2(N=124) | Year 3(N=118) |
|---|
| SPL | 5 | The teaching is well focused | 2.56±0.2 | 2.84±0.3* | 2.82±0.2* |
| 1 | I am encouraged to participate in class | 2.46±0.3 | 2.64±0.4* | 2.73±0.3* |
| SPT | 14 | The teachers are patient | 2.35±0.2 | 2.86±0.3 | 2.88±0.1* |
| 17 | The teachers have good communication skills with patients | 2.42±0.3 | 2.74±0.4* | 2.82±0.2* |
| 22 | The teachers are well prepared for their classes | 2.67±0.3 | 2.79±0.2*† | 2.74±0.4 |
| SPA | 32 | The atmosphere is relaxed during the ward/clinical teaching | 2.04±0.1 | 2.40±0.3*† | 2.24±0.4 |
| 33 | This college is well timetabled | 2.68±0.3 | 2.75±0.3 | 2.84±0.4* |
| 38 | The atmosphere is relaxed during the seminars/tutorials | 2.34±0.4 | 2.58±0.3* | 2.64±0.2*† |
| SSP | 49 | I seldom feel lonely | 2.18±0.2 | 2.87±0.4* | 2.78±0.3* |
N=380, values are Mean ± SD. * p<0.05 compared to first year and †p<0.05 when compared between second and third year
Comparison of DREEM domain scores for male and female students. N=380, *p<0.05; values by Mann-Whitney non-parametric test
Discussion
Curriculum is dynamic ever changing series of learning experiences and extending as widespread entity ahead of classroom teaching in medical school. EE is one of the most important components of an effective curriculum. In present study response rate was 92.68% which was significantly higher than earlier few studies [1,5].
The mean DREEM score overall for all domains in our study reflect the positive perception of the students about their EE. All students perceived in more or less similar way i.e. teachers are authoritarian/strict, teaching overemphasizes factual learning, it is too teacher centred, they were unable to memorize ‘all’ and, there is poor support system for the students who get bored, tired, or stressed during their academic life, which was in agreement with other study findings [9–11]. These items with scores <2 points were identified as problem areas to be revisited and improved through focus group discussions. In this context teacher should realize that majority of the students come from non-medical background and have many doubts in mind, such students hesitate to approach strict teachers. This may affect their learning process.
Items with scores <2 points from SPL domain were factual and teacher-centred learning. It may be due to the pattern of formative and summative assessments encountered by the students. This could be improved by active involvement of students through problem based learning and structured and systematic teaching.
In domain SAP scores <2 points pertained to ability to memorize ‘all’ indicating that students face difficulty in coping academic overload; need curriculum revision in terms of methodology and course content. While in SSP poor support system for the students who get bored, tired, or stressed during their academic life were the problem areas identified with scores <2 points. Innovative, engaging and meaningful curriculum so as to reduce student boredom and tiredness is the need of hour. During focus group discussion, majority of the students opined that the volume of the subject made the learning difficult, teaching could be made more student centred. However, at the same time students also opined that it is difficult to reduce the volume/bulk of the any subject because of the importance given in competitive examinations and the basic frame work of the subject itself. Especially 3rd year students were found to be more apprehensive in this context; similar observations were reported in earlier few studies [11,12].
Most of our students opined in more positive way that they were encouraged to participate in the class, teachers were patient and knowledgeable in their subjects with good communication skills, teaching was focused, and it helped in developing their confidence, competence to pass in this year examinations and establishing their carrier in medicine. They also mentioned of having good friends in college, with good social life hence seldom feel lonely. It is evidenced by item scores >2 and /or >3.5 in various domains [Table/Fig-4,5]. This could perhaps be explained by the fact that lot of importance was given to practical teaching and good student teacher interaction boosted with relaxing, comfortable and encouraging atmosphere in college. Also, the items such as relaxing atmosphere during the ward/clinical teaching/ seminars/tutorials and well timetabled college, preparing for teaching sessions, and communicating with patients had a mean score between 2 and 3. Similar findings were also reported in other studies [9–11].
In present study second-year students were more positive in their perception of EE and DREEM score assigned by female students was significantly greater than students of the other classes. This could be explained on the basis of comparatively well balanced course time and volume of second year subjects. Wherein more protective and homely hostel facilities provided could be the concrete reason for high scores given by female students.
Limitations
It was a cross-sectional study and the limitation of this study is that the students’ perception about the Educational Environment recorded only at one point of time. Though the problem areas are identified the change in perception after taking corrective measures to improvise the problem areas is not studied. As it’s an ongoing process the corrective measures will be taken in stepwise manner and the change in perception will be recorded at the end of their academic term.
Conclusion
To conclude, overall students in a Medical College of Western Maharashtra perceived the EE to be satisfactory. However, the item with score <2 points such as, authoritarian/strict teachers, factual and teacher-centred learning, inability to memorize ‘all’, poor support system for the students who get bored, tired, or stressed during their academic life were the problem areas identified which needs remedial measures so as to ensure and maintain high quality EE and optimum teaching to the students.
N=380, values are Mean ± SD. * p<0.05 compared to first year and † p<0.05 when compared between second and third year.
N=380, values are Mean ± SD. * p<0.05 compared to first year and †p<0.05 when compared between second and third year