There has been a progressive increase in the prevalence of hypertension (HTN) due to an increase in life span, obesity, stress, change in lifestyle and genetic background. These have led to an unfortunate rise of hypertension as a major public health problem in India and worldwide [1,2]. The global burden of hypertension indicates that nearly one billion adults (more than a quarter of the world population) were hypertensive in 2000 and this is predicted to rise to 1.56 billion by 2025 [3]. Various reports from developing countries have estimated the prevalence of hypertension among urban populations ranging from 1.24% in 1949 steadily increasing to 50% in 2009 [4–8].
Since hypertension is often asymptomatic, it commonly remains undetected, leading to serious complications if untreated. Hypertension is one of the leading causes of end stage renal disease [9]; it is important risk factor for haemorrhagic and thrombotic strokes as reported by the INTERSTROKE study [10]. Hypertension is directly responsible for 57% of all stroke deaths and 42% of coronary heart disease deaths in India [11]. Hence, it is crucial to detect and treat hypertension before the occurrence of complications. However, identifying hypertensive patients is a difficult task as most of the patients are asymptomatic initially and hence they do not seek medical attention. With this background, we conducted this cross-sectional study to detect the levels of blood pressure in adults aged 20 years and above in Boloor, Mangalore (a semi urban population of southern India).
Materials and Methods
The study was approved by the Institutional Ethics Committee and a written informed consent was obtained from all subjects. This was a cross-sectional study conducted in a semi urban population of Boloor locality in Mangalore city. The rationale for choosing Boloor locality in Mangalore for this study was that its residents comprise a multireligious community that includes the major religious groups in Mangalore. Boloor is one of the three field practice areas of the community medicine department of Kasturba Medical College, Mangalore. Mangalore Corporation has a population of 4,06,565 and consists of 60 wards. Boloor comes under ward number seven while a small portion of it lies in the ward number one. The total population of ward seven is 6,293 (3,152 males, 3,141 females) while that of ward one is 6,687 (4,136 males, 2,551 females) [12,13]. Hence, the total population of Boloor is around 10,000, living approximately in 1500 houses. In each house, the mean number of adults above the age of 20 is two, which gives a total adult population of approximately 3000 people. Of these 3000 people, about 1500 people live near the sea; they go fishing or sell fish in the early morning hours on all days except the rainy season and hence these were excluded from the study. Of the remaining 1500 individuals, we randomly selected 800 (300 males, 500 females) individuals and invited them to participate in this study. Of these, 551 responded to the invitation (551/800), a response rate of 68.8%. The study was done in phases with a door to door survey which included: a questionnaire on age, hypertension and diabetes status with family history; anthropometric measurements including body weight, waist circumference, waist to hip ratio and body mass index; fasting venous blood sample collection (after ten hours fast) for estimation of lipid profile [13]. Fasting and postprandial plasma glucose was measured by the glucose oxidase peroxidase (GOD-POD) method, serum triglyceride was measured using the glycerol phosphate oxidase-peroxidase enzymatic method (GPO-PAP). HDL-C (after precipitation of LDL and chylomicrons) using phosphotungstic acid was measured with a commercial kit (Boehringer Mannheim, Germany) and LDL cholesterol levels was derived with Friedewald’s formula. Oral glucose tolerance test (OGTT) was performed using 75 g of glucose with fasting and 2 hour postprandial plasma glucose measurements. Height in meters (m) and weight in kilograms (kg) were measured and body mass index (BMI) was calculated as the weight in kilograms divided by the square of the height in meters. BMI ≥25 was defined as obesity, BMI < 23 was defined as normal and BMI ≥ 23-24.9 was defined as overweight [14]. Waist circumference (WC) was measured in the standing position with a soft tape midway between the lowest rib and the iliac crest. Hip circumference was measured over the widest part of the gluteal region (greater trochanters) [13]. A total of 551 subjects of both sexes in the age group of 20 years and above were examined for systolic and diastolic blood pressure. The diagnostic criteria recommended by the Joint National Committee 7 (JNC VII) were considered [15] (Normal – systolic and diastolic < 120/80 mmHg; Prehypertensives: systolic 120-139 or diastolic 80-89 mmHg; Stage-I hypertensives: systolic 140-159 or diastolic 90-99 mmHg; Stage-II hypertensives: systolic ≥160 or diastolic ≥100 mmHg). Blood pressure was recorded in the left arm in the sitting position to the nearest 2mm Hg using the mercury sphygmomanometer after a rest of five minutes. Systolic blood pressure was recorded at the appearance of the first Korotkoff sound and diastolic at the phase V of Korotkoff sound. Two readings were taken with a gap of five minutes in between and the mean of the two readings was taken as the blood pressure. Physical activity was graded as follows: heavy exercise or strenuous work= Grade I; mild exercise or light work = Grade II; no exercise and totally sedentary = Grade III [16]. Diagnosis of type 2 diabetes mellitus is made if post prandial plasma glucose was ≥200 mg/dl, hypercholesterolaemia was diagnosed if serum cholesterol level was ≥200 mg/dl or drug treatment for hypercholesterolaemia, hypertriglyceridemia diagnosis was based on serum triglycerides levels ≥150 mg/dl or drug treatment for hypertriglyceridemia [17,18].
Statistical Analysis
Continuous variables are presented as mean ±SD, prevalence rates are given as percentages. The group frequencies were compared by Chi-square test. Quantitative data was tested by Student’s t-test (unpaired). Statistical analysis was performed with a SPSS programme, version 17.0 for windows (Chicago, USA). Multivariate logistic regression analysis was done using hypertension as the dependent variable and the various risk factors as independent variables. P-value <0.05 was considered statistically significant.
Results
Prevalence of Hypertension: A total of 551 (176 men and 375 women) individuals were interviewed and screened. The overall prevalence of hypertension in the study population was 41.19% (227/551) which was similar in both sexes (40.9% in men, 41.3% in women). The prevalence of self-reported hypertension was 19.05% (105/551) (22.1% in men, 17.6% in women, p=0.331).
[Table/Fig-1] shows the demographic and clinical characteristics of the study subjects. The subjects with hypertension were older when compared to normotensives, in which they had significantly (p<0.001) higher body weight, body mass index, and waist circumference. The prevalence of hypertension by gender and age was given in [Table/Fig-2].
Clinical and demographic characteristics of hypertensives and normotensives. n – Number of subjects
| Variable | Normotensives(n=324) | Hypertensives(n=227) | p-value |
|---|
| Age (y) | 43.9 ± 12.9 | 53.9 ± 12.7 | <0.001 |
| Body weight (kg) | 57.9 ± 10.9 | 63.2 ± 13.5 | <0.001 |
| BMI(kg/m2) | 23.1 ± 3.9 | 25.6 ± 4.6 | <0.001 |
| Waist circumference(cm) | 83.5 ± 9.7 | 87.9 ± 9.9 | <0.001 |
| SBP(mmHg) | 120.0 ± 10.6 | 146.9 ± 17.8 | <0.001 |
| DBP(mmHg) | 74.8 ± 6.7 | 88.4 ± 8.0 | <0.001 |
| FBS(mg/dl) | 87.4±4.5 | 92.8±4.6 | 0.45 |
| PPBS(mg/dl) | 125.5±6.7 | 134.5±9.8 | 0.34 |
| TG (mg/dl) | 111.4 ± 69.5 | 129.5 ± 49.5 | 0.26 |
| HDL cholesterol (mg/dl) | 47.7 ± 14.4 | 50.2 ± 15.4 | 0.35 |
| TC (mg/dl) | 195.4 ± 53.1 | 208.3 ± 49.5 | 0.55 |
| LDL cholesterol (mg/dl) | 129.6 ± 47.1 | 136.6 ± 44.0 | 0.67 |
Prevalence of hypertension by gender and age among the study population, (Age adjusted prevalence for men: 30.4%; women: 30.9% and total: 30.5%)
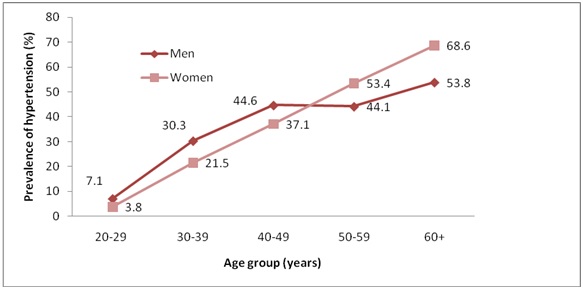
As per JNC 7, the distribution of blood pressure levels among study population is shown in [Table/Fig-3]. Prevalence of stage I hypertension progressively increased with age from, 5% (20-29 years) to 33.9% (40-49 years), after which there was a significant reduction by 5% i.e. 28.9% in the 50-59 years age group, followed by another significant rise (43.2%) after the age of 60 years (trend chi-square 42.48, p<0.0001). Prevalence of stage II hypertension increased very slowly till the age group of 40-49 years by 5.8%, which was followed by a sudden rise in the 50-59 years age group to 21.4% and sustained till the age of 60 years and above (trend chi square 49.48, p<0.0001).
Percentage distribution of blood pressure levels of study population based on JNC VII criteria among age groups
| Age group in years | Pre hypertension | HTN stage I | HTN stage II |
|---|
| 20-29 | 60.0 | 5.0 | 0 |
| 30-39 | 42.8 | 19.8 | 3.9 |
| 40-49 | 46.4 | 33.9 | 5.8 |
| 50-59 | 36.4 | 28.9 | 21.4 |
| ≥60 | 28.0 | 43.2 | 20.8 |
| Total | 40.4 | 29.7 | 11.43 |
| Chi square trend | 7.08, p<0.01 | 42.48, p<0.0001 | 49.48, p<0.0001 |
Prehypertensives: systolic 120-139 or diastolic 80-89 mmHg; Stage-I hypertensives: systolic 140-159 or diastolic 90-99 mmHg; Stage-II hypertensives: systolic ≥160 or diastolic ≥ 100 mmHg
The overall prevalence of prehypertension, stage I hypertension and stage II hypertension were 40.4%, 29.7% and 11.4% respectively [Table/Fig-4]. Hypertension increased as age advanced in both genders (trend chi-square 7.08, p<0.01).
Gender wise distribution of blood pressure levels n – Number of subjects
| JNC-VII stage | Blood pressure levels(SBP or DBP) | Men (%)(n=176) | Women (%)(n=375) | Total (%)(n=551) | p-value |
|---|
| Normal | < 120 and < 80 mmHg | 24(13.6) | 77(20.5) | 101(18.3) | 0.05 |
| Pre hypertension | 120-139 or 80-89 mmHg | 80(45.4) | 143(38.1) | 223(40.4) | 0.102 |
| HTN stage I | 140-159 or 90-99 mmHg | 51(28.9) | 113(30.1) | 164(29.7) | 0.752 |
| HTN stage II | ≥ 160 or ≥ 100 mmHg | 21(11.9) | 42(11.2) | 63(11.4) | 0.801 |
Risk factors for hypertension: [Table/Fig-5].
Multivariate regression analysis for association of various risk factors with prevalence of hypertension. (n – Number of subjects; OR – Odds Ratio, CI – Confidence Interval)
| Variable | n | Prevalence in hypertensives | Multivariate logistic regression |
|---|
| OR | 95% CI | P |
|---|
| Gender |
| Men | 176 | 40.9 | 1 | | 0.92 |
| Women | 375 | 41.9 | | | |
| Age (years) |
| 20-29 | 40 | 5.0 | 1 | | |
| 30-39 | 126 | 23.8 | 2.81 | 1.65-3.76 | <0.0001 |
| 40-49 | 153 | 39.8 | 7.45 | 5.34-10.23 | <0.0001 |
| 50-59 | 107 | 50.4 | 11.28 | 9.23-13.87 | <0.0001 |
| 60+ | 125 | 64.0 | 12.32 | 10.98-14.29 | <0.0001 |
| Body mass index (kg/m2) |
| Normal(<23) | 209 | 30.1 | 1 | | |
| Overweight (23-24.9) | 120 | 42.5 | 1.96 | 1.19-3.23 | <0.001 |
| Obese (≥25) | 222 | 50.9 | 3.12 | 2.04-4.76 | <0.001 |
| Serum cholesterol (mg/dl) |
| Normal | 290 | 35.1 | 1 | | |
| Hypercholesterolaemia | 261 | 47.8 | 0.61 | 0.45-0.97 | <0.05 |
| Serum triglycerides (mg/dl) |
| Normal | 447 | 37.8 | 1 | | |
| Hypertriglyceridemia | 104 | 55.7 | 0.63 | 0.38-1.05 | 0.067 |
The odds ratio for age ranged between 2.81 (95% CI: 1.65-3.76) and 12.32 (95% CI: 10.98-14.29), which shows strong association of age with hypertension compared to those below 30 years, subjects between 30-39 years were at 2.8 times higher risk of hypertension; subjects between 40-49 years at >7 times higher risk, subjects between 50-59 years at >11 times higher risk while those above 60 years were at >12 times higher risk of hypertension. The odds ratio for hypertension in those with obesity ranged from 1.96 (95% CI: 1.19-3.23) to 3.12 (95% CI: 2.04-4.76). Serum cholesterol {p=0.043, OR: 0.6, 95% CI: 0.45-0.97} was strongly associated with hypertension whereas serum triglycerides was not associated with hypertension.
Prevalence of isolated systolic and isolated diastolic hypertension: [Table/Fig-6]
Prevalence of isolated systolic and diastolic hypertension in different age groups among the study population (Trend Chi-square values for isolated systolic hypertension (X2= 16.05, p<0.001), for isolated diastolic hypertension (X2= 2.15, p=0.14)
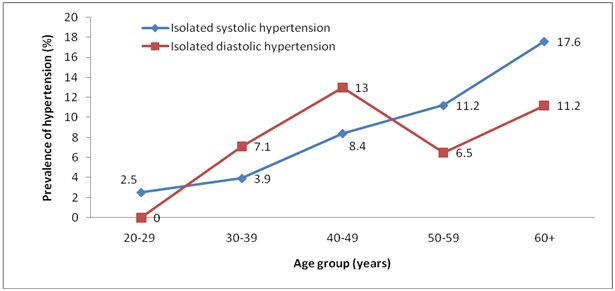
Based on the JNC 7 criteria, isolated systolic hypertension (SBP≥140 and DBP<90 mmHg) was present in 9.6% of the subjects (7.9% of men and 10.4% of women; p=0.364) while isolated diastolic hypertension (DBP≥90 and SBP<140 mmHg) was present in 9.1% of the subjects (9.6% of men and 8.8% of women; p=0.743).
Prevalence of metabolic abnormalities: [Table/Fig-7]
Prevalence of risk factors in hypertensives and normotensives (T2DM; type 2 diabetes mellitus, IGT; impair glucose tolerance, HCH; hypercholesterolaemia, HTG; hypertriglyceridemia, PIA; physical inactivity)
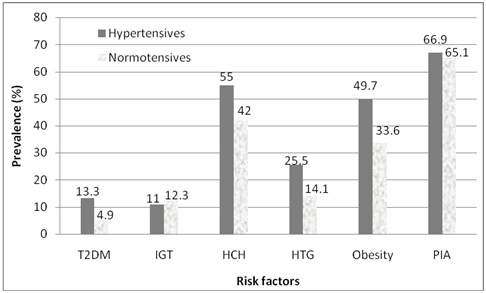
The prevalence of metabolic abnormalities like type 2 diabetes mellitus, obesity, hypercholesterolaemia and hypertriglyceridemia, were higher in subjects with hypertension compared to normotensive subjects (13.4% vs 4.9%, p<0.0001; 49.7% vs 33.6%, p<0.0001; 55% vs 42%, p<0.01; 25.5% vs 14.1%, p<0.01; respectively). In the total study population 10.9% of study subjects had diabetes mellitus, of which 73% had hypertension.
Among the hypertensives subjects, 53.74% were unaware of their hypertension status. Only 46.3% of the hypertensives were on treatment of which none were under control according to the JNC 7 criteria.
Discussion
The present study is the first population based study in Dakshina Kannada, Karnataka, using JNC 7 guidelines to identify the prevalence of hypertension. The overall prevalence of hypertension in our study population of Boloor in Mangalore which represents the semi urban South Indian population is 41.1% which is similar to the pooled prevalence of hypertension for West Indian urban population [1], less compared to the study conducted in Kerala [8] and high compared to other studies from Chennai [18], and Jaipur [11].
Isolated systolic blood pressure was present in 17.6% (12.8% of men, 19.7% of women) among the elderly subjects (60 years and above). This was low compared to the Chennai study [18]. Women had a higher prevalence of isolated systolic blood pressure (ISBP) and lower prevalence of isolated diastolic blood pressure. After menopause, there is a sharp increase in the prevalence of hypertension in women, which may be due to the loss of protection from ovarian hormones [19], increasing family stress and obesity which is similar to the data from other studies. High prevalence of hypertension in elderly has been reported from Chennai - 51% [18] and Kerala - 51.8% [8]. Our study also showed a progressively increasing prevalence with age, with 61.7% of those aged ≥ 60 years having hypertension.
In the present study, 40.4% of subjects had prehypertension. This is high in the youngest age group (20-29 years); 60%, which is very high compared to the Chennai study (33%). The trial of preventing hypertension (TROPHY) study [20] on individuals with high normal blood pressure suggests clearly that the risk of cardiovascular disease begins to rise before the diagnosis of hypertension is evident. It is important to identify this group and start lifestyle modifications and prevent hypertension.
Various risk factors have been associated with hypertension in studies conducted in various parts of India. Age, BMI, and central obesity are strongly associated with hypertension in both genders [1,21]. In the CURES-52 study, age, BMI, serum cholesterol and triglycerides were strongly associated with hypertension [18]. These findings were consistent with the findings of the present study which revealed that age, body weight, body mass index, central obesity and serum triglycerides were strongly associated with hypertension.
Among the hypertensive subjects, 53.74% were unaware of their hypertension status. Only 46.3% of the hypertensives were on treatment of which none were under control according to the JNC 7 criteria. This is due to lack of awareness and regular health checkup. India in general and Mangalore in particular has over centuries been an agricultural hub, relying mainly on manual labour. Urbanization and sedentary habits (advanced transport facilities, telecommunication and drastic reduction of prices of home entertainment like, smart phones and internet) are to blame for this rapid transition of highly physically active people into sudden physical inactivity. This is probably an important factor responsible for the high prevalence of hypertension. Hypertension is one of the most important causes of morbidity and mortality leading to cerebrovascular stroke, cardiovascular and renal diseases [22].
In the present study, 10.9% subjects were found to have type 2 diabetes mellitus (T2DM), of which 73% had hypertension. Increased prevalence of hypertension was strongly associated among subjects with T2DM as compared subjects without T2DM (p<0.001). This association has been supported by multiple studies across India and worldwide [1,23].
Limitations
Our study has some limitations. The people residing in the region studied, (Boloor, Mangalore) mainly belong to the fishing community, living near the seashore; most of whom were away fishing during the morning hours when the data was collected. Hence the fishermen were not available for the study. For the same reason, there was double the number of females than males in the study. Secondly, the socioeconomic data of the population was not collected.
Conclusion
This study has shown that there is an increasing trend of mean systolic blood pressure and diastolic blood pressure and a higher prevalence of hypertension in the semi urban community. We found a large number of prehypertensive individuals according to the JNC 7 criteria, who are young and need special attention to avoid early progression to hypertension. The prevalence of hypertension increased gradually with age, obesity, dyslipidemia and diabetes mellitus. Educating the public about the chronic complications of hypertension, life style changes, dietary modification, avoiding urban stress (practice of yoga), regular health screening for hypertension, early detection and treatment of hypertension in the community may reduce the risk of development of chronic heart, kidney and cerebrovascular diseases.
Prehypertensives: systolic 120-139 or diastolic 80-89 mmHg; Stage-I hypertensives: systolic 140-159 or diastolic 90-99 mmHg; Stage-II hypertensives: systolic ≥160 or diastolic ≥ 100 mmHg