Preschool vision screenings are inevitable to detect visual impairment among the children attending preschools [1,2]. Amblyopia, squint and refractive error are the common vision disorders seen in childhood [2,3]. The primary aim of screening children at a young age is to reduce the prevalence of amblyopia by referring them when they are still amenable to treatment. Uncorrected amblyopia can hamper the ability to learn thereby affecting the school performance. It gradually wobbles the adult’s self-image in later years. Recognition acuity is more sensitive than grating or detection acuity for identifying amblyopia [4]. The most important aspect in testing the visual acuity of preschool children is the selection of tests that require cognitive skills appropriate for the children’s age. The indispensable components for effective use of any visual acuity charts in young children are the ability of the child to perform the task (test ability), the ability of the test to accurately differentiate the children who have an ocular disorder from those children who do not have (sensitivity and specificity) and the reliability of the tests [5]. In screening for visual impairment, US Preventive Service Task Force recommended Lea Symbols, HOTV and Tumbling E charts. They also found that early detection of amblyopia improves visual acuity [6]. Little age specific information is available concerning the diagnostic validity of these tests for preschoolers in the developing world. However, reports are available on wide usage of C and E-charts in Asian countries, where English is not the native language [7]. Many studies have compared the visual acuity results obtained by the use of Landolt C and E-charts in this age group. There is paucity of published data on the diagnostic validity of these charts in India. Stereopsis is the uppermost form of the binocular coordination function and its assessment is an integral part of the routine binocular vision examinations. Stereo acuity measures are sensitive to developmental disorders of vision such as amblyopia, strabismus, uncorrected refractive errors and ocular pathologies that reduce the visual acuity [8]. The purpose of current study was to compare the reliability, sensitivity and specificity of visual acuity charts (Lea symbol, HOTV and E-charts) and stereo acuity charts (Titmus and Frisby) in preschool children.
Materials and Methods
A cross-sectional study was conducted in a preschool of a semi urban locality in Udupi District of Karnataka, India from August 2013 to March 2014. Anticipating 75% repeatability, an allowable difference of 10% and non cooperation rate of 20%, a minimum sample size of 87 was arrived at. The school had 150 children on roll. All the children were screened for the visual deficit. A total of 90 subjects (180 eyes) were recruited for the study based on the cooperation level. Age range of the study subjects were between 36 to 71 months. Children with strabismus, systemic diseases, developmental delay, attention deficits, or any ocular diseases, were excluded from the study based on examination and the records available. Computerised random number table was used to generate the order of presentation of the charts to the study subjects. Monocular assessment of visual acuity was performed in both eyes with the Lea Symbols, HOTV and E-chart followed by stereo acuity measurement using Titmus and Frisby stereo cards. A thorough binocular vision examination was done followed by anterior segment evaluation with hand held slit lamp. Posterior segment evaluation was performed using direct ophthalmoscope through undilated pupil. A single investigator performed all the assessments. This research followed the tenets of the Declaration of Helsinki and the protocol was approved by the Institutional Ethics Committee, Kasturba Hospital, Manipal, India. Prior permission was taken from the Principal of the school to carry out the study. A written informed consent was obtained from parents/guardian of the study subjects and verbal assent from kids before commencement of the study. The list of the children with reduced vision was provided to the principal in order to inform the parents emphasizing the need for further examination and management.
Visual acuity measurement: Each subject’s distance visual acuity was assessed monocularly at 3m distance. The eye was occluded with a butterfly pattern occluder. The child’s task was to match each optotypes to the correct one on a lap card or to identify optotypes verbally. For Tumbling E, the child was taught and instructed to point in any of the four different orientations as seen with hand [6]. To minimize bias caused by fatigue or learning, the order of presentation of the charts was randomized and one child was tested at a time in the testing room. The test was done in right eye first followed by left eye in all subjects. The child was complimented for his active participation. All the four optotypes had to be identified correctly to proceed to the next smallest optotype. The visual acuity was recorded as the smallest optotype size which the child identified and was recorded in log MAR value.
Stereo acuity measurement: The stereoacuity measurements were done using Titmus stereo fly and Frisby stereo tests [9]. For testing with Titmus Fly, child was asked to catch the wings of the fly (3000 seconds of arc), then proceed to the row of animals, followed by graded circle test. The subject was asked to point to animal or circle or push the circle which seemed to float up. Following the correct response, the child was shown the next level of target and the stereo acuity values recorded. Thus, the criterion for recording was successive correct responses at a given disparity level (ranges from 800 to 40 seconds of arc). Stereopsis [9] was then measured with Frisby using 6mm, 3mm and 1.5 mm thickness plates at 40 cm which corresponds to 340”, 170” and 85” disparity respectively. Subjects were asked to point to any of the four squares that had the target popping out. It was followed by changing the distance of the plates and the maximum stereo acuity obtained was recorded from the chart. Two consecutive correct responses at a given disparity level was considered as passing level. All the tests for visual acuity and stereo acuity were repeated with the same charts and same testing conditions after one week of the initial examination.
Statistical Analysis
The data was analysed and tabulated using Statistical Package for Social Sciences (SPSS) version 15 for Windows. Descriptive statistics was used to determine the variance among the charts. Intra class correlation was obtained to determine the agreement between the repeated measurements of the tests. The variation in visual acuity across the charts was determined by using one way ANOVA. Bland and Altman plots were used to find agreement between the charts. The sensitivity, specificity, positive predictive value and negative predictive values were also calculated. All indices were expressed as percentage with 95 percent confidence intervals. The performance of the tests was further characterized by constructing receiver operating characteristic (ROC) curves for each chart. A p-value < 0.05 was considered to be statistically significant.
Results
Ninety children participated in the study with a minimum and maximum age of 36 and 71 months respectively. The mean (SD) age of the children in the study was 53 (10) months with equal gender distribution. Children had visual acuity ranging from 0.00 log MAR to 0.72 log MAR and stereo acuity from 40 arc sec to 800 arc sec. The mean (SD) visual acuity and stereo acuity measures using various charts are given in [Table/Fig-1].
Mean visual acuity and stereo acuity of the charts
| Visual Acuity | Mean±SD (log MAR) | Stereo Acuity | Mean±SD (arc sec) |
|---|
| Lea Symbol | 0.23 ±0.11 | Frisby | 290 ±141 |
| HOTV | 0.21± 0.11 | Titmus | 387 ±192 |
| E-chart | 0.38 ±0.13 | | |
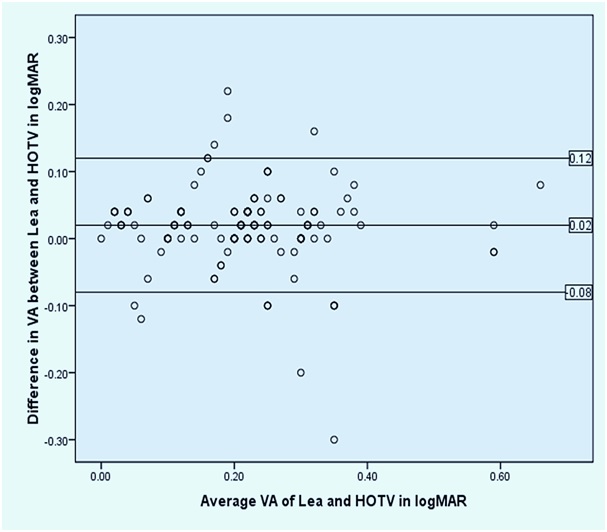
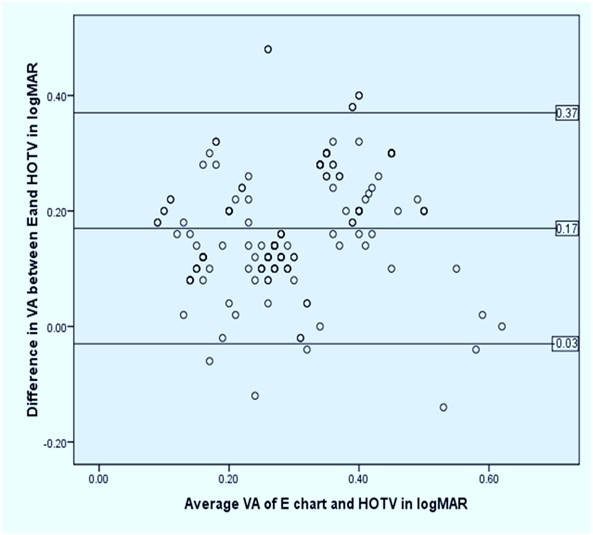
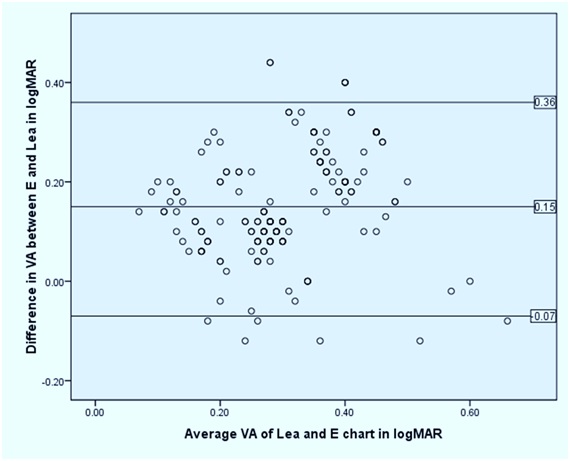
The data was normally distributed based on Kolmogorov-Smirnov test. The repeatability (test- retest reliability) of the visual acuity and stereo acuity measures was assessed using Intra Class Correlation Coefficient (ICC). The visual acuity measurements of right and left eyes were considered for data analysis. The mean difference between the repeated measures, ICC and variance of the visual acuity and stereo acuity measures are reported in [Table/Fig-2]. The variation in visual acuity across the three charts were assessed using one-way ANOVA and there was a statistically significant difference (p<0.0001). Post-hoc test revealed that the difference was significant on comparison of visual acuity using E-chart with the other two visual acuity charts. The agreement between the visual acuity charts are shown using Bland-Altman plots [Table/Fig 3,4 and 5]. The mean difference between visual acuity chart combinations, their p-value and the limits of agreement are given in [Table/Fig-6].
Variance and ICC of the visual acuity and stereo acuity charts
| Visual Acuity | Mean difference (log MAR) | ICC | p-value (95% CI) | Variance (log MAR) |
|---|
| Lea Symbol | 0.006 | 0.96 | <0.001 (0.95, 0.97) | 0.011 |
| HOTV | 0.001 | 0.99 | <0.001 (0.98, 0.99) | 0.012 |
| E-chart | 0.003 | 0.92 | <0.001 (0.90, 0.94) | 0.016 |
| Stereo acuity | Mean difference (arc sec) | ICC | p-value (95% CI) | Variance (arc sec) |
| Frisby | 0 | 1.0 | <0.001 (1.0, 1.0) | 0 |
| Titmus | 0 | 1.0 | <0.001 (1.0, 1.0) | 0 |
* ICC- Intraclass correlation coefficient,* CI - confidence interval
Bland-Altman plot showing agreement between Lea and HOTV charts
Bland-Altman plot showing agreement between E and HOTV charts
Bland-Altman plot showing agreement between Lea and E charts
Mean difference and limits of agreement between the visual acuity charts
| Chart combination | Mean difference ±SD (log MAR) | p-value (95% CI) | Limits of agreement (lower, upper) (log MAR) |
|---|
| Lea- HOTV | 0.02 ± 0.05 | 0.43 (-0.01, 0.04) | -0.08, 0.12 |
| E-chart - Lea | 0.15± 0.11 | <0.0001 (-0.18, -0.12) | -0.07, 0.36 |
| E-chart - HOTV | 0.17 ± 0.10 | <0.0001 (0.14, 0.20) | -0.03, 0.37 |
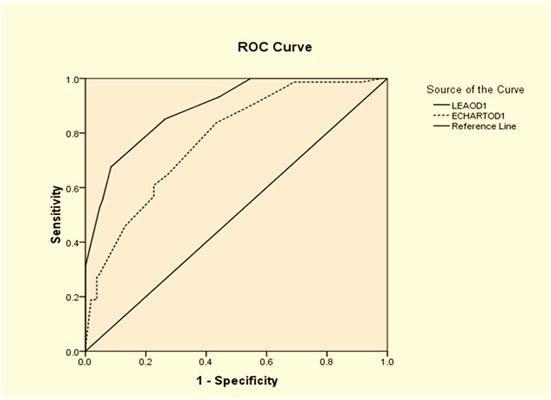
The variance in visual acuity measures was similar using Lea and HOTV chart and was lesser compared to E-chart. Since the difference in repeated measures was least for HOTV, it was considered as a standard. The validity measures of the Lea and E-charts to detect visual acuity worse than or equal to 0.2 log MAR against HOTV visual acuity chart was estimated [Table/Fig-7]. The areas under receiver operating curve (ROC) for Lea and E-chart were 0.892 (95 percent CI – 0.847, 0.937) and 0.776 (95 percent CI – 0.710, 0.843) respectively [Table/Fig-8].
Validity of the visual acuity charts
| Validity | E-chart% (95%CI) | Lea % (95% CI) |
|---|
| Sensitivity | 99(0.91,0.99) | 93(0.84,0.97) |
| Specificity | 15(0.09,0.23) | 56(0.45,0.65) |
| Positive Predictive Value (PPV) | 45(0.37,0.52) | 59(0.49,0.68) |
| Negative Predictive Value (NPV) | 94(0.69,0.99) | 92(0.81,0.97) |
Receiver Operating Characteristics Curve for the visual acuity charts. HOTV was taken as the reference chart
The ability of the Titmus and Frisby stereo acuity test to detect the interocular difference was also estimated. The validity of Frisby and Titmus stereo test to detect an interocular difference of visual acuity ≥ 0.1log MAR using HOTV chart was estimated [Table/Fig-9]. The area under ROC was 0.5 (95 percent CI – 0.292, 0.714) for both Frisby and Titmus stereo test for screening an interocular difference of ≥0.1 log MAR.
Validity of the stereo acuity charts
| Validity | Titmus % (95% CI) | Frisby % (95% CI) |
|---|
| Sensitivity | 75(0.35,0.95) | 75(0.84,0.97) |
| Specificity | 13(0.07,0.23) | 27(0.17,0.37) |
| Positive Predictive Value (PPV) | 8(0.03,0.16) | 9(0.03,0.19) |
| Negative Predictive Value (NPV) | 85(0.53,0.97) | 92(0.71,0.98) |
Discussion
It has been observed that vision screening programs in preschool should test recognition acuity, because the resolution and detection acuity has less diagnostic validity [10]. The Lea Symbol optotypes are symmetrical closed symbols, with size determined by using an “equal blur-out” criterion [11]. For children older than 30 months, repeatability of the Lea Symbol was high. Becker et al., recommended Lea Symbol as a useful tool for visual acuity measurement in early childhood [12]. VIP Study Group suggested that Lea Symbol is applicable even in young children with good test ability and between test agreements [13]. Kvarnstrom G et al., concluded that test ability rate in a three-year-old was more than 80 percent with both Lea Symbols and HOTV charts [14]. In our study, we found good repeatability with Lea Symbol chart. Becker et al., reported that an interocular acuity difference more than one line, despite good cooperation, should arouse attention irrespective of age [12]. According to Dobson et al, acuity scores obtained by Lea Symbols chart was higher than those obtained using the Bailey-Lovie chart by one line [15]. Monocular visual acuity with Lea symbol was reported better than Bailey-Lovie letter chart because there was 25 percent chance of guessing the correct symbol with Lea versus 10 percent chance of guessing with Bailey-Lovie letter chart [15].
In the current study, the mean difference between Lea charts and HOTV were not statistically significant. We used visual acuity charts that had equal chances of guessing. The guessing rate in Lea Symbol, E-chart and HOTV is 25 percent because all the three charts had only four different response options. According to VIP Study Group, the HOTV test yielded higher sensitivity and lower specificity than Lea Symbols for each acuity line tested. Furthermore, comparison of the performance on the two tests at the specificity level closest to 90 percent for each test in three-year-old children required the failure criterion be adjusted to one line smaller for the Lea Symbols than for the HOTV test [5]. In the current study, we found that Lea chart had good sensitivity (93 percent) and specificity (56 percent) to detect visual acuity less than 0.2 log MAR. Even though E-chart had good sensitivity (99 percent) as that of Lea chart, it had a poor specificity (15 percent) which may lead to over referrals.
Establishing normal limits of stereo acuity help clinicians to accurately measure the binocular status of children and adults. It also throws light on to the maturation of binocular vision in an individual [16]. A common sequela observed in childhood visual defects is impaired binocular function [17]. This emphasizes the role of stereo acuity measurement in monitoring the effectiveness of the interventions planned [18].
Even though repeatability of stereo acuity with Titmus and Frisby was good among children between three to five years of age, it is not a good tool for screening interocular difference in visual acuity (area under ROC 0.5) according to the current study. Leat et al., concluded that, Frisby had a good repeatability compared to other charts in young children [19]. Farvardin et al., reported that in a screening situation, the sensitivity of TNO was 55.5, 48.4 percent for Titmus, and 44.4 percent for Randot. In this study, we found that both Titmus and Frisby had good sensitivity but low specificity to detect interocular difference of ≥0.1 log MAR. In a clinical setting, the frequencies reported were 74, 68 and 62 percent respectively. It may be due to lesser concentration of the child in a screening setting [20]. Ohlsson et al., reported the sensitivities of various stereo tests for detection of amblyopia as 36 percent for Randot E, 38 percent for Titmus, and 46 percent for TNO [21]. The screening qualities of stereo acuity showed inconsistent results as reported in literature [20].
List of previous studies on repeatability [Table/Fig-10], sensitivity, specificity [Table/Fig-11] are reported in comparison with this study results. It was diverse in the tests done, subjects taken and the analysis performed.
Previous Literature on Repeatability /reliability of visual acuity and stereo acuity charts (http://www.ncbi.nlm.nih.gov/pmc/articles/PMC3258515/)
| Study (year) | Charts used | Age range in years | Repeatability /reliability |
|---|
| Chen et al., (2006) [22] | Lea symbol, ETDRS | 4 to 12 | ±0.09 log MAR in normal and ±0.33 log MAR in amblyopes |
| Schmidt et al., (2006) [23] | Random Dot E stereo test | 3 to 5 | *Kw =0.43 |
| Adams et al., (2009) [24] | Preschool Randot, Frisby near, Frisby distance, distance Randot tests | 7 to 76 | *LOA(log arc sec) 0.52, 0.24,0.68,0.46 |
| Antona et al., (2015) [25] | Frisby, titmusstereo tests Randot test and TNO test | 18 to 32 | *COR (sec of arc) ±13, ±12, ±23, ±54 in normal and ±69, ±91, ±72, ±120 in binocular anomalies. |
| Current study | Lea, HOTV, E vision charts Titmus, Frisbystereocharts | 3 to 5 | *ICC 0.96,0.99,0.92 1.0,1.0 |
*LOA-Limits of agreement, Kw-Weighted kappa, COR- Coefficient of Repeatability, ICC-Intra class correlation coefficient
Previous studies reporting sensitivity and specificity of different vision screening charts in pre-schoolers
| Study (year) | Screening tests | Sensitivity (%) | Specificity (%) | PPV (%) | NPV |
|---|
| Miller et al., (2001) [26] | Lea symbol chart | 93 | 51 | 48 | 93 |
| Barry and Konig (2003) [27] | Lea symbol chart and binocular vision examination | 91 | 94 | 25 | 100 |
| VIP study group(2004) [13] | (i) Lea symbol chart | 61 | 90 | 73 | 84 |
| (ii) Crowded HOTV Test | 54 | 89 | 68 | 82 |
| (iii) Random Dot E stereo acuity | 42 | 90 | 64 | 78 |
| Chui et al., (2004) [28] | Lea symbol chart, Frisby stereo acuity test and external inspection | 67 | 86 | 41 | 95 |
| Bertuzzi et al., (2006) [29] | Lea symbol chart | 96 | 83 | 52 | 99 |
| Cyert et al., (2010) [30] | (i) Lea symbol chart | 83 | * NR | NR | NR |
| (ii) HOTV chart | 57 | NR | NR | NR |
| Omar et al., (2012) [31] | (i) Lea symbol chart | 97.5 | 45 | NR | NR |
| (ii) Sheridian Gardiner chart | 57 | 92 | NR | NR |
| Current study | (i) Lea symbol chart | 93 | 56 | 59 | 92 |
| (ii) E chart | 99 | 15 | 45 | 94 |
| (iii) Titmus stereo test | 75 | 13 | 8 | 85 |
| (iv) Frisby stereo test | 75 | 27 | 9 | 92 |
*NR-Not reported
Limitations
The limitations of the study were lack of sampling technique being employed as all the study subjects were from a single play school located in a semi urban area, and so the results cannot be generalized. The refractive status was not quantified in this study. However, the inference drawn from this study can be used for designing larger studies involving children from both rural and urban areas to fill in the existing gaps
Conclusion
Lea and HOTV visual acuity charts have good repeatability and with slightest variability compared to E-chart among preschool children. The difference in visual acuity was least between Lea and HOTV compared to Lea vs E-chart and HOTV vs E-chart. The specificity and positive predictive value of HOTV chart to detect visual acuity worse than or equal to 0.2 logMAR was better than E-chart. E-chart showed good sensitivity, but poor specificity. Though the repeatability of Frisby and Titmus stereo acuity tests were equally good among preschool children, it cannot be used as a screening tool to detect the inter-ocular difference.
* ICC- Intraclass correlation coefficient,* CI - confidence interval
*LOA-Limits of agreement, Kw-Weighted kappa, COR- Coefficient of Repeatability, ICC-Intra class correlation coefficient
*NR-Not reported