Type II Diabetes Mellitus and Insulin Resistance are increasing in children and adolescents worldwide, gaining epidemic proportions especially in South Asian population. This is due to changing life style of people and adoption of westernized dietary habits. At present 61 million are diabetics in India and this figure is expected to reach 101.1 million by 2030. For every diabetic there are four prediabetics. Hence India is called the diabetic capital of the world contributing to nearly one fourth of world type II diabetes mellitus burden. An 80% of the cases are attributed to obesity, especially central abdominal obesity [1].
By the age of 15 years, more than 25% of obese adolescents may show glucose intolerance [2]. Central obesity is an important well established modifiable risk factor which predisposes to insulin resistance and rapidly evolving to diabetes mellitus at much younger age among Southeast Asian population [3].
Visceral fat can be measured by CT and MRI, which are gold standards, and dual energy X ray absorptiometry, ultrasonography [4]. However the high cost, exposure to ionizing radiations in CT, and shortage of equipment’s in a developing country limits its use in large scale screening. Various anthropometric measurements are used but it does not consider the body fat distributions [5].
Measurement of sagittal abdominal diameter using a revalidated calliper is simple, inexpensive, non-invasive method for this purpose. It strongly correlates with insulin resistance and can be used as a surrogate marker to predict risk for type II diabetes mellitus. Studies on adults have shown visceral fat measured by sagittal abdominal diameter correlates better than other anthropometric measurements with glucose intolerance and cardiovascular diseases [6]. The present study aims at measurement of sagittal abdominal diameter, using sliding calliper, to predict insulin resistance in adolescent children [5].
To assess the use of sagittal abdominal diameter, using sliding calipers, to predict insulin resistance in obese or overweight adolescent children.
This is an explorative study done on obese or overweight adolescent children aged 10-18 years in urban population. This study was conducted over a period of 12 months in a tertiary care hospital with sample size of 75 included using purposive sampling.
Materials and Methods
All adolescent children between the age group of 10-18 years, overweight or obese visiting the Out Patient, Department of Paediatrics and satisfying the inclusion criteria were enrolled for the study. Ethical Committee Clearance was obtained and the participants were explained about the need for study, procedures involved (blood investigations, anthropometry, demographic data) and benefits from the study to subjects and to the population in general for those children after effective counselling willing to participate in the study, informed parental consent, assent was taken.
Following the informed consent all children were asked to come on 2 visits at the weekend (Saturday, Sunday). On their first visit to the outpatient department, a pretested proforma was filled. The proforma consisted of demographic data, family history, past history, clinical history (vitals, systemic examination, head to toe examination) were recorded.
Anthropometric Measurements Were Recorded
a) Height & Weight: Digital weighing machine (calibrated to 0.5 Kg accuracy) and calibrated stadio-meter were used.
Height to nearest (mm) & Weight (to nearest l00 g) were recorded using standard techniques with minimal clothing.
b) BMI was calculated using the formula:
CDC Charts of BMI for age & sex were used as standard reference & plotted. Children with BMI > 95th percentile were considered obese. BMI percentile between > 85th & <95th percentile were overweight (BMI 23 – 25 considered overweight & >25 is obese) as per WHO standard [8].
c) Waist circumference: The waist circumference was taken in standing posture after asking the subjects to raise their shirts and the midpoint between the lowest rib and the anterior superior iliac spine was marked and non-stretchable measuring tape was placed snugly around this point and the reading was made to the nearest of 0.1cm at inspiration.
d) Hip circumference: With the child standing erect with arms at the sides and feet together, the measurer sitting at the side of the subject so that the level of the maximum extensions of the buttocks can be seen, the measuring tape is placed around the buttocks in the horizontal plane. The tape is snug and the reading is made to the nearest 0.1 cm.
e) Waist Hip ratio: WHR was calculated.
f) Sagittal abdominal diameter: It was recorded using the modified Yamayo Abdominal calipers, which was pre validated with ultra sonography & calibrated to nearest (1-2mm). SAD was recorded at the level of L4 – L5 is supine position, with legs extended, just above the anterior superior iliac spine. One arm was placed below the subject on the table and the other arm was lowered down without compressing the abdomen and measurement was recorded [9].
Following these, the subject was given a date for 2nd visit & was counselled regarding the blood drawing procedure. During the second visit the participant were asked to come on fasting (8 hours) to the outpatient department with normal diet previously.
On arrival to OPD, blood sample were collected under aseptic precaution in 2 tubes for fasting blood sugar, fasting Insulin, HbA1C and OGTT.
Laboratory Methods: FBS measurement was taken by Venous blood sampling, Glucose levels were determined after enzymatic Oxidation by Glucose Oxidase method. Fasting Insulin levels were assessed by Chemi Luminescent Immuno Assay.
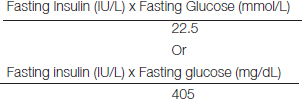
HOMA-IR was calculated to assess insulin resistance using the formula [10]
Definition of Prediabetes
IGT ≥ 140 and < 200 mg/dl
IFG ≥100 and <126 mg/dl [7].
All the above Data, Anthropometry, & Blood drawing were carried out by 2 trained Doctors from the Department of Paediatrics, independent of each other. Both of them trained to record data in similar methods. SAD was recorded by a trained observer who was unaware of other anthropometric, ultra sound and clinical findings. Kappa value between the two persons recording the data was 0.71. Subjects who didn’t come for follow up were excluded. Confidentiality was maintained and ethical clearance was obtained before starting the study.
Statistical Analysis
The data for this study is analysyed using SPSS version 21. All the anthropometric parameters were described as Mean ond Standard deviation. The difference in mean between the two groups is tested using student’s t-test and is considered significant if p-value is <0.05. the partial correlation between anthropometric parameters and laboratory parameters were computed by controlling age and sex. the partial Pearson’s correlation was computed and is considered to be significant when p<0.05. Multiple correlation analysis was done to compare SAD with other parameters.
Results
Out of 924 subjects who gave assent to participate in study 108 fulfilled ADA criteria. Thirty three subjects who didn’t come for the follow up were excluded. Out of 75 subjects 12 were detected to have insulin resistance (16%) and 63 were normal (84%) as per HOMA-IR.
Age for normal individuals were 13.79±1.57 and for insulin resistant subjects 13.75±1.82. There was no statistical significance in the mean difference of age. SBP (normal114.32±10.86, IR: 119.50±15.16, p=0.16) and DBP (normal 76.63±7.3, IR: 77.67±5.84, p=0.649) is more in IR subjects. BMI (normal : 25.162±1.55, IR : 27.25±2.41, p=0.001), WC (normal 84.06±1.55, IR : 85.88±9.90, p=0.49), WHR (normal : 0.88±0.08, IR : 0.92±0.12., p=0.08), SAD (normal: 18.88±2.55, IR: 22.68±3.74, p=0.001) is more in IR group. HC (normal: 96.12±8.23, IR: 93.42±10.14, p=0.319) is not more in IR individuals [Table/Fig-1].
Showed mean±standard deviation of normal individuals and those with insulin resistance
| HOMA IR | N(75) | Mean± Std. Deviation | p-value |
|---|
| Age (yrs.) | Normal | 63 | 13.79±1.567 | 0.932 |
| Insulin resistance | 12 | 13.75±1.815 | 0.939 |
| BMI | Normal | 63 | 25.162±1.5496 | 0.001 |
| Insulin resistance | 12 | 27.253±2.4090 | 0.013 |
| WC | Normal | 63 | 84.06±8.090 | 0.493 |
| Insulin resistance | 12 | 85.88±9.904 | 0.559 |
| HC | Normal | 63 | 96.119±8.2314 | 0.319 |
| Insulin resistance | 12 | 93.417±10.1373 | 0.399 |
| WHR | Normal | 63 | .8765±.07700 | 0.076 |
| Insulin resistance | 12 | .9242±.11611 | 0.195 |
| SBP | Normal | 63 | 114.32±10.861 | 0.161 |
| Insulin resistance | 12 | 119.50±15.163 | 0.279 |
| DBP | Normal | 63 | 76.63±7.386 | 0.649 |
| Insulin resistance | 12 | 77.67±5.836 | 0.598 |
SAD for normal was 18.88±2.55 where as for IR subjects it was 22.68±3.74. The difference in mean is found to be statistically significant (p=0.001) this shows that the mean SAD of IR is more compared to normal. Fasting glucose (normal: 80.22 ± 9.60, IR: 91.83 ± 5.51, p=0.001), OGTT (normal: 101.17±18.58, IR : 130.92±24.11, p=0.001), fasting insulin (normal 8.76±2.43, IR: 12.71±2.13, p =0.001), HOMA-IR (normal: 1.65±0.54, IR : 2.88±0.52, p=0.001) was higher in IR group compared to normal individuals [Table/Fig-2].
SAD in relation to Glucose metabolism
| HOMA IR | N(75) | Mean± Std. Deviation | p-value |
|---|
| SAD | Normal | 63 | 18.883±2.5516 | 0.001 |
| Insulin resistance | 12 | 22.675±3.7434 | 0.005 |
| Fasting glucose | Normal | 63 | 80.22±9.599 | 0.001 |
| Insulin resistance | 12 | 91.83±5.508 | 0.001 |
| OGT | Normal | 63 | 101.17±18.567 | 0.001 |
| Insulin resistance | 12 | 130.92±24.111 | 0.001 |
| Fasting Insulin | Normal | 63 | 8.760±2.4291 | 0.001 |
| Insulin resistance | 12 | 12.710±2.1276 | 0.001 |
This shows that the mean HOMA-IR of IR is more compared to normal subjects.
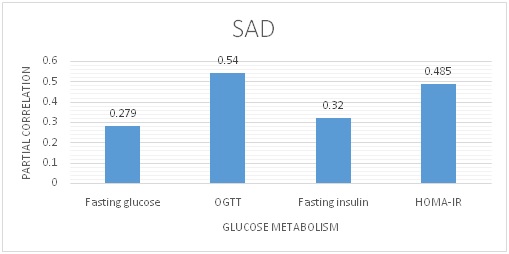
The partial correlation of fasting glucose with SAD is 0.279 (p=0.017) whereas that with BMI is 0.258 (p=0.028); that with WC is 0.148 (p=0.211), that with HC is-0.222 (p=0.059); that with WHR is 0.317 (p=0.006), this shows that hip circumference has negative correlation. WHR is a better correlate to fasting glucose than other anthropometric measurements. SAD has better correlation than WC, HC, and BMI [Table/Fig-3].
Gives correlation between anthropometric measurements and laboratory measurements
| Fasting glucose | OGTT | Fasting insulin | HOMA-IR |
|---|
| SAD | 0.279 | 0.540 | 0.320 | 0.485 |
| p-value | 0.017 | 0.001 | 0.006 | 0.001 |
| BMI | 0.258 | 0.48 | 0.235 | 0.398 |
| p-value | 0.028 | 0.001 | 0.046 | 0.001 |
| WC | 0.148 | 0.217 | 0.046 | 0.240 |
| p-value | 0.211 | 0.068 | 0.699 | 0.042 |
| HC | -0.222 | -0.085 | -0.145 | -0.07 |
| p-value | 0.059 | 0.477 | 0.222 | 0.558 |
| WHR | 0.317 | 0.297 | 0.147 | 0.264 |
| p-value | 0.006 | 0.011 | 0.216 | 0.025 |
The partial correlation of OGTT with SAD is 0.54 (p=0.001) whereas that with BMI is 0.48(p=0.001), that with WC is 0.217 (p=0.065), that with HC is -0.085 (p=0.477), that with WHR is 0.297 (p=0.011), this shows that hip circumference has negative correlation. SAD is a better correlate to OGTT than other anthropometric measurements [Table/Fig-3].
The partial correlation of fasting insulin with SAD is 0.32 (p=0.006) whereas that with BMI is 0.235 (p=0.046); that with WC is 0.046 (p=0.699), that with HC is -0.145 (p=0.222), that with WHR is 0.147 (p=0.216); this shows that hip circumference has negative correlation. SAD is a better correlate to fasting insulin than other anthropometric measurements [Table/Fig-3].
The partial correlation of HOMA-IR with SAD is 0.485 (p=0.001) whereas that with BMI is 0.398(p=0.001), that with WC is 0.240(p=0.042), that with HC is –0.07 (p=0.558), that with WHR is 0.264 (p=0.025), this shows that hip circumference has negative correlation. SAD is a better correlate to HOMA-IR than other anthropometric measurements [Table/Fig-4].
Partial Correlation of SAD with Glucose Metabolism
Hip circumference has negative correlation with SAD, BMI, and WHR. Other anthropometric measurements correlate with each other and are significant (exception HC) BMI correlates with WC and WHR better than SAD [Table/Fig-5].
Shows correlation of anthropometric measurements amongst themselves
| SAD | BMI | WC | HC | WHR |
|---|
| SAD | 1.00 | 0.783 | 0.587 | -0.015 | 0.561 |
| p-value | . | 0.001 | 0.001 | 0.902 | 0.001 |
| BMI | 0.783 | 1.000 | 0.701 | -0071 | 0.699 |
| p-value | 0.001 | . | 0.001 | 0.553 | 0.001 |
| WC | 0.587 | 0.701 | 1.000 | 0.310 | 0.619 |
| p-value | 0.001 | 0.001 | . | 0.008 | 0.001 |
| HC | -0.015 | -0.071 | 0.310 | 1.000 | -0.520 |
| p-value | 0.902 | 0.553 | 0.008 | . | 0.001 |
| WHR | 0.561 | 0.699 | 0.619 | -0.520 | 1.000 |
| P-value | 0.001 | 0.001 | 0.001 | 0.001 | . |
Discussion
Early identification of subjects who are at higher than average risk of developing diabetes is a challenge. Prevention of global epidemics of diabetes is of at most importance. According to present ADA, IDF guidelines, children and adolescents need to be screened for metabolic syndromes if they have BMI more than 85th percentile. Glucose intolerance has shown increasing trend among children and adolescents in India.
Recent studies from India showed increasing prevalence of Type 2 diabetes in all regions like, 19.5% in Kerala (ADEPS), 15.5% in Chennai (CURES), 12.4% in Bangalore, 16.6% in Hyderabad, 11.7% in Kolkata and 9.3% in Mumbai (NUDS) [1]. In our study prevalence of IR was 16%. In a study on overweight Japanese children prevalence of prediabetes was 19.2%. This wide variation is probably due to variation in ethnicity, race, eating habits, life style and so on.
By Pearson’s partial correlation of HOMA-IR and OGTT with SAD, had demonstrated it to be better correlated with IR than other anthropometric measurements . Similar results were seen in other studies conducted in adults [11]. High predictive capacity of SAD to detect IR was probably because it measures visceral abdominal fat rather than subcutaneous fat and visceral abdominal fat has strong association with cardio metabolic diseases [12].
The results of our study are subjected to limitations. The sample size is small, so it can’t be generalized to general population. And the cut offs for SAD in paediatric age group does not exist. It can be sorted out by plotting ROC.
Limitations and Strengths
The present study had certain limitations for generalizability. The sample size was smaller and requires larger population studies. Fasting Glucose correlated better with Waist Hip Ratio. The strength of our study was OGTT, Fasting Glucose and HOMA were used as diagnostic indictors of Insulin Resistance. Anthropometric measurements BMI, WC, W/H ratio was compared in the study.
Conclusion
Insulin Resistance was diagnosed in 16% of at risk population and these had high levels of insulin. SAD in relation to glucose metabolism, had a better correlation with OGTT followed by HOMA IR and fasting Insulin. SAD with anthropometric measurements had better correlation all the parameters other than Waist Circumference, which had negative correlation. SAD can be used in evaluation of obese or overweight children for evaluation. Following evaluation an intervention with three point programs should be implemented, Low fat, low calorie and low salt, moderate physical activity of 150 minutes/week, and reduction in weight by 5-10%. Prediabetics should be screened at regular intervals of 6-9 months. Overweight/Obese at risk of prediabetes should be screened every 3 years once. These appropriate life style modifications can avert or delay type 2 diabetes which can be more cost effective and efficient way of managing diabetes, thereby reducing the economic burden to the society.