The retinal nerve fibre layer is a most sensitive indicator of optic nerve damage in glaucoma as it precedes visual field loss [1,2]. Age [3–5], gender [6], axial length [7–9], size of the optic disc, refractive status of the eye [7–9], ethnicity/race [10] can affect the RNFL thickness. Although red free fundus ophthalmoloscopy and photography allows direct visualization of the RNFL, so far these techniques are subjective, qualitative and not quantitative and reproducible [11]. Optical Coherence Tomography (OCT) is a new non-invasive technique which gives high resolution cross-sectional images of various ocular structures with an axial resolution of 10 microns. Thickness of the retina particularly of the RNFL can be measured as well as visualized using high resolution OCT [12,13].
Near infrared light (830nm) is been used by OCT from a super luminescent diode laser which is transmitted to the retina via a fibre optic delivery system. When this light back scatters from the retina fibre optic interferometer captures it and reference mirror longitudinal data is extracted. The backscattering information provided by multiple individual axial A scans are used to construct the cross sectional OCT images of the retina. The degree of light scattering from the retinal tissue at different depth is represented with false colour on a monitor [13]. There are 2 types of scanning beams used to acquire images, either linear or circular. Approximately 1 second is taken to acquire a scan. In order to avoid areas of peripapillary atrophy a circular scan of 3.4mm is used [14]. Mean RNFL thickness measurements are calculated using computer algorithm which identifies and demarcates signal corresponding to RNFL [13]. Increased thickness along the superior and inferior poles of the optic nerve head gives a typical “double hump” appearance when RNFL thickness is normal [15,16]. New three dimensional optical coherence tomography (3D-OCT) instruments (Topcon-3D OCT-1000, OPTOVCUE-RTVue-100, OPTOPOL-SOCT COPERNICUS) are much faster than conventional OCT and have become more sophisticated ophthalmic imaging modalities [13].
Effect of refractive error status of the eye on RNFL thickness may be relevant for the assessment of the psychophysical tests commonly used in the diagnosis and follow up of patients with glaucoma and other optic nerve diseases. This variation should be considered when RNFL loss is evaluated during the course of a disease process. Purpose of this study is to use 3D- OCT to evaluate the effect of refractive status of the eye and axial length on peripapillary variation of RNFL thickness.
Materials and Methods
Three hundred eyes of 150 subjects were analysed in this study. Subjects were divided into 5 groups based on the amount of refractive error. Group 1 comprised of 60 emmetropic eyes (+0.5 to -0.5 DS), Group 2 comprised 60 eyes of low hyperopia (+0.75 to +3.0 DS), Group 3 comprised 60 eyes of high hyperopia (+ 3.25 and above), Group 4 comprised 60 eyes of low myopes (-0.75 to -3.0 DS) and Group 5 comprised of 60 eyes of high myopes (-3.25 and above) in the age Group of 20 to 40 years. Systemic random sampling technique was used while selecting the cases were age, sex matched. All subjects were informed about the study procedure and they consented to participate. This study was approved by the local ethical committee. Those with amblyopia, strabismus, astigmatism higher than 1.00 D, corneal disorders, retinal and optic disc diseases, glaucoma and a previous history of ophthalmic surgery or ocular trauma were excluded from the study.
All subjects underwent detailed clinical examination which included measurement of refractive error using retinoscopy and autorefraction, visual acuity by Snellen charts, slit lamp examination, goldmannapplanation tonometry and fundoscopy. Axial length of measured using IOL master.
All 5 groups underwent RNFL analysis of both eyes using TOPCON 3D OCT -2000 3D Optical coherence tomography of PC software edition Version 4.0X. All eyes were dilated using 1% tropicamide and 5% phenylephrine eye drops. All images were captured by a single observer and internal fixation was used as target. After acquiring the best possible fixation and clear retinal video image following scans of each eye was imaged. RNFL analysis was done using fast RNFL thickness 3.4 scanning protocol. Scanned images were accepted based on signal to noise ratio (SNR) and a scan percentage values. Quality of scanned images were also assessed subjectively based on richness of red and yellow colour, which when high suggests a good scan. Repeated scans were done to obtain the good image quality based on above criteria.
Statistical Analysis
Descriptive statistical analysis has been carried out in the present study. Continuous measurement results are presented as Mean ±SD (Min-Max) and categorical measurements are presented in number (%). Significance of the results assessed at 5 % level of significance. Analysis of variance (ANOVA) has been used to find the significance of study parameters between three or more groups of patients,
Statistical software: Analysis of the data was done using statistical software namely SAS 9.2, SPSS 15.0, Stata 10.1, MedCalc 9.0.1, Systat 12.0 and R environment ver.2.11.1 were used for the analysis of the data. Graphs and tables etc were generated using Microsoft word and Excel.
Results
In this study 300 eyes of 150 individuals underwent evaluation of retinal nerve fibre layer thickness in the age group of 20-40 years using Spectral Domain OCT. Demographic details of which are given in [Table/Fig-1,2].
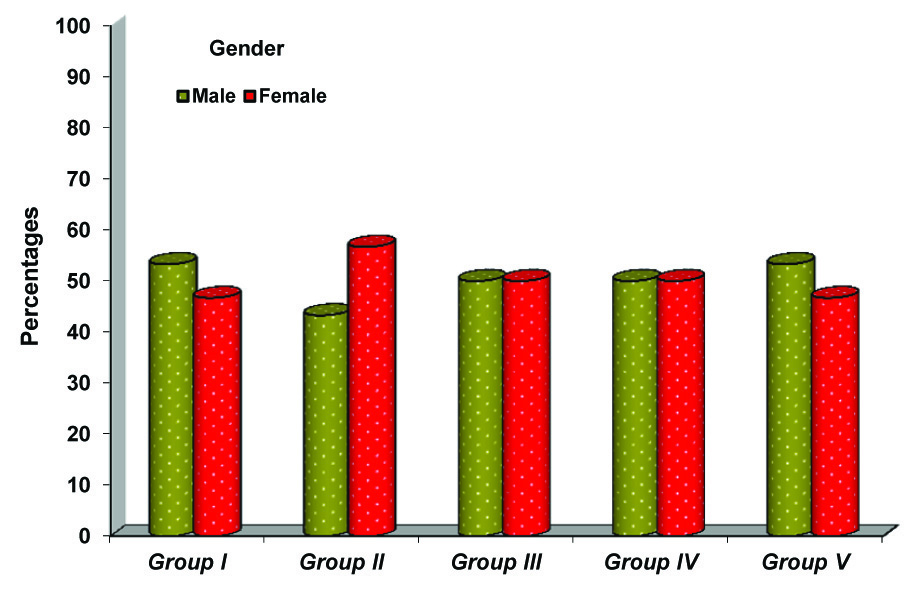
Age distribution in the five groups studied
| Age in years | Group I | Group II | Group III | Group IV | Group V |
|---|
| 20-25 | 10(33.3%) | 6(20%) | 6(20%) | 9(30%) | 11(36.7%) |
| 26-30 | 10(33.3%) | 6(20%) | 11(36.7%) | 11(36.7%) | 9(30%) |
| 31-35 | 8(26.7%) | 7(23.3%) | 8(26.7%) | 6(20%) | 6(20%) |
| 36-40 | 2(6.7%) | 11(36.7%) | 5(16.7%) | 4(13.3%) | 4(13.3%) |
Gender distribution in the various groups studied
The Average RNFL thickness in normal group was 111.75±4.83 microns. This was the reference thickness. In increasing myopia the RNFL thickness was seen to decrease and in increasing hypermetropia the RNFL thickness was increased [Table/Fig-3,4]. The quadrantic assessment of RNFL thickness in the different groups followed ISNT rule with inferior quadrant showing the greatest thickness followed by the superior, nasal and temporal quadrants.
Comparison of Axial length and RNFL thickness in various groups studied.
| Parameters | Group I (n=60) | Group II (n=60) | Group III (n=60) | Group IV (n=60) | Group V (n=60) |
|---|
| AXL (mm) | 23.25±0.54 | 21.37±0.45 | 21.07±0.59 | 24.17±0.56 | 25.39±0.75 |
| RNFL average (μm) | 111.75±4.83 | 113.47±5.51 | 114.68±5.1 | 111.15±5.1 | 105.05±6.82 |
| RNFL Superior (μm) | 135.40±9.90 | 133.47±10.11 | 136.23±8.75 | 132.30±7.57 | 123.85±10.88 |
| RNFL Inferior (μm) | 147.47±7.88 | 145.83±8.36 | 147.60±7.74 | 144.22±4.79 | 135.55±7.56 |
| RNFL NASAL (μm) | 89.02±6.72 | 96.30±9.08 | 93.05±6.1 | 91.05±9.21 | 89.23±12.78 |
| RNFL Temporal (μm) | 74.88±8.04 | 77.88±7.85 | 81.10±7.31 | 76.43±7.21 | 71.28±8.66 |
Comparison of Axial length and RNFL thickness.
| Axial length (AXL) | RNFL Average (μm) | RNFL Superior (μm) | RNFL Inferior (μm) | RNFL NASAL (μm) | RNFL Temporal (μm) |
|---|
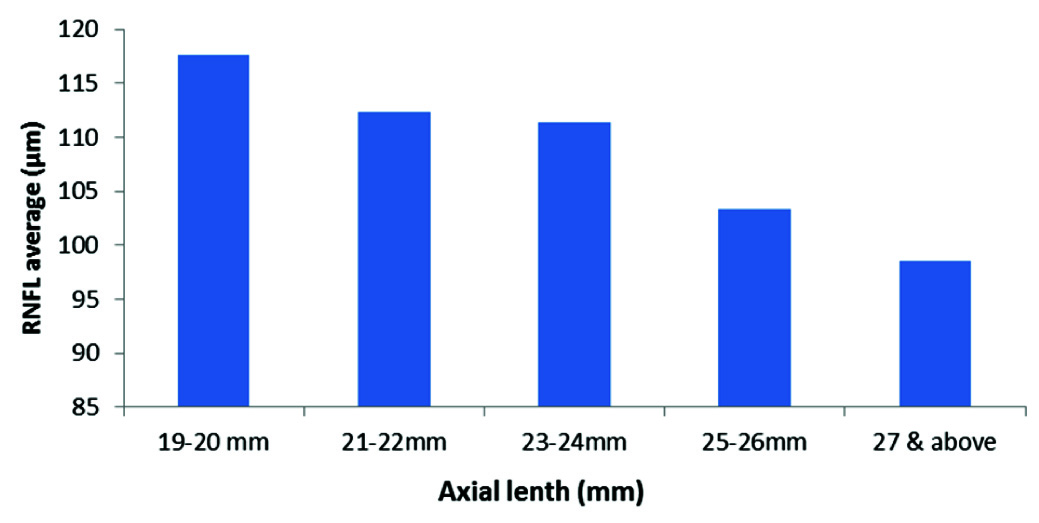
| 19-20mm | 117.65±4.26 | 141.05±7.86 | 150.57±6.91 | 96.97±7.54 | 81.46±8.32 |
| 21-22mm | 112.31±5.01 | 132.22±8.96 | 145.33±7.86 | 92.64±7.53 | 78.44±7.05 |
| 23-24mm | 111.36±4.82 | 133.10±9.06 | 144.58±7.15 | 92.01±8.92 | 75.43±8.06 |
| 25-26mm | 103.30±6.49 | 123.77±10.94 | 135.35±7.79 | 84.67±12.22 | 69.09±7.64 |
| 27 & above | 98.50±0.71 | 104.00±11.31 | 126.50±0.71 | 83.50±0.71 | 78.00±7.07 |
| P-value | <0.001** | <0.001** | <0.001** | <0.001** | <0.001** |
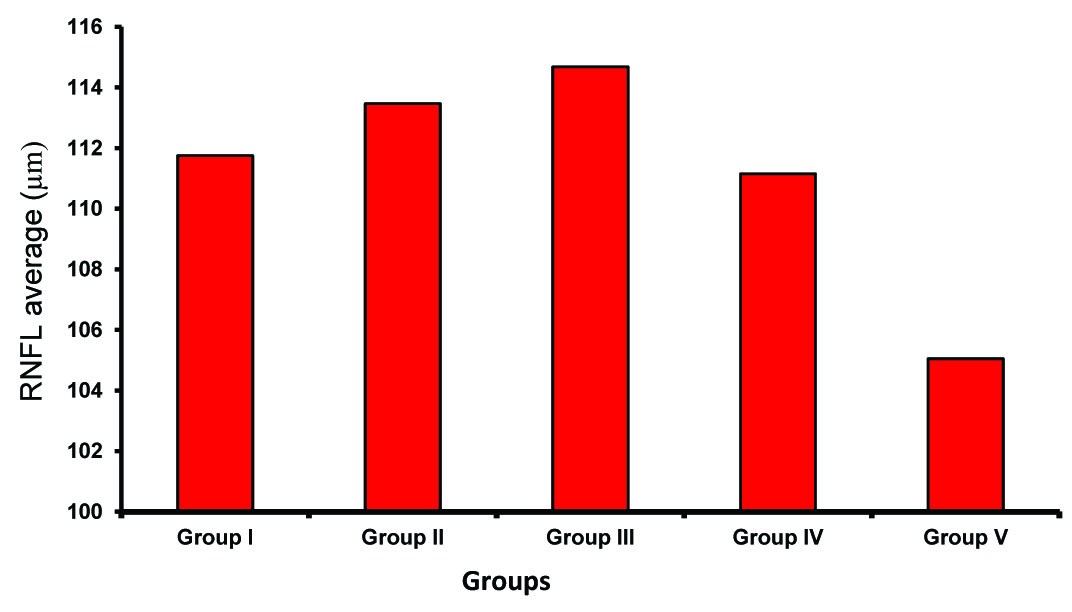
Group I (normal) had an average RNFL thickness of 111.75±4.83μ and an average AXL of 23.25±0.54mm, Group II (Hypermetrope<+3.0) had an average RNFL thickness of 113.47±5.51μ and an average AXL of 21.37±0.45mm, Group III (Hypermetrope>+3.0D) had an average thickness of 114.68±5.1μm and an average AXL of 21.07±0.59mm, Group IV (Myopes< -3.0D) had an average RNFL thickness of 111.2±5.1μm and an average AXL of 24.17±0.56, Group V (Myopes> -3.0D) had an average RNFL of 105.05±6.82μm and an average AXL of 25.39±0.75. Difference between the each group was statistically significant (p <0.001).
RNFL thickness average shows increasing thickness with increase in hypermetropia and decreasing thickness with increase in myopia. The change is seen statistically significant when hepermetropia or myopia >3.0D when compared with normal group; the change in myopia is more significant (p=0.001) than hypermetropia (p=0.031). The group II as compared to normal, shows significant RNFL thickening (p=0.001) in nasal quadrant. The increase in thickness in temporal quadrant and in the average is not significant; so also the decrease in superior and inferior quadrants is not significant. The Group III, as compared to normal, shows increase in thickness in the average and in all quadrants. The increase in thickness is significant in the average (p=0.031) and in temporal quadrant (p=0.001). The Group IV, as compared to normal, shows no significant change in any of five parameters. It shows thinning in the average and in superior and inferior quadrants and shows increase in thickness in nasal and temporal quadrants; none of these are significant. The Group V, as compared to normal, shows thinning in the average and in all quadrants except the nasal quadrant. The thinning is significant in the average and in superior and inferior quadrants. Increase in hypermetropia shows increase in RNFL thickness in general; it is statistically significant in the average and in temporal quadrant. Increase in myopia shows increasing thinning in general; it is statistically significant in the average and in superior and inferior quadrant.
In general hyperopic shows significant increase in thickness in temporal and nasal quadrants; and myopia shows significant thinning in superior and inferior quadrants. Both hyperopia and myopia show consistent changes in average RNFL thickness; but it is statistically significant in refractive errors >3D. Overall myopic changes are more consistent than hypermetropic. The RNFL thickness decreased with increasing axial length and this was statistically significant [Table/Fig-5,6].
Average RNFL thickness in the various groups studied
Average RNFL thickness in various axial lengths
Discussion
To detect glaucoma in the early stage even before the field loss occurs, several new instruments and techniques have developed in recent years. OCT being one of them, which uses near infrared beam (814nm). This passes through the retinal layers and based on its reflectivity RNFL thickness asseses using computer assisted software [17]. Vitreous is seen as black as it represents optically zero refractive zone and RNFL is seen as red [18,19]. Previous studies have shown that RNFL thickness anlysis using OCT is quiet reproducible [14,20] as well as reliable [18]. With the new OCT machines and newer software OCT has become an important investigation in the diagnosis and management of glaucoma.
Our study shows a significant change in RNFL thickness (p<0.001) in refractive errors. In myopes there was a progressive thinning of RNFL as the power increased and there was significant increase in the RNFL thickness in Hypermetropes as the power increased [Table/Fig-3]. In both myopes and hypermetropes significant changes are seen when the error is more than 3D. At the same time there was statistically significant decrease in the RNFL thickness as the Axial length increased and increase in the thickness as the axial length decreased [Table/Fig-5].
Our study findings were consistent with Sung-Won Choi et al., who studied peripapillary RNFL thickness in 3 groups of myopic patients (less than -2, -2 to -4 and more than -4D) using Stratus OCT and concluded that peripapillary RNFL thickness significantly decreased with increase in the degree of myopia [21]. Leung CK et al., measured RNFL thickness in myopic eyes (-0.5 to -6.0D) and concluded that RNFL measurement varies with the axial length/refractive error of the eye which is consistent with our study outcome [22]. The study by Donald L Budenz et al., showed that RNFL thickness was related significantly to both axial length and refractive error [23]. Longer eyes and more myopic eyes had a thinner measured RNFL. However, our study is inconsistent with that reported by Mrugacz et al., who showed that as myopia increased, peripapillary RNFL remained unchanged [24].
Our study showed that as the degree of hyperopia increased the RNFL thickness increased and this was seen consistently in the temporal quadrant. In contrast to myopia, hypermetropia showed statistically significant changes in the nasal and temporal quadrants.
Conclusion
Our study showed that RNFL thickness measured by 3D OCT is affected by the refractive status and axial length of the eye. Thus the current normative database could be misleading while diagnosing glaucoma in ametropic patients. The normative RNFL thickness data for emmetropic, hypermetropic and myopic eyes provided by this study may assist in identifying changes in RNFL thickness in glaucoma and other diseases. The study suggests that the diagnostic accuracy of 3D - OCT may be improved by considering refractive status and axial length while measuring the RNFL thickness.