Diabetes and hypertension are linked with cardiovascular, peripheral vascular, cerebrovascular, renal and psychological and ocular diseases. Global prevalence of diabetes is 8.7% with 387 million of population having diabetes [1]. Half of the global diabetics do not know their diabetes status and are subclinical cases, every seven seconds one person dies due to diabetes with mortality of 4.9 million in 2014 [1]. India is expected to have 65.1 million people with diabetes [1]. The average urban prevalence of diabetes in India (2004) was 16% and it was 3% in rural population [2]. Hypertension is estimated to be in one billion of the global population [3]. In India, reported prevalence of hypertension varies from 10% to 30.9%. Estimated number of hypertensives in urban population is 34 million and 31.5 million in rural population [2].
Complications of diabetes include neuropathy, nephropathy, skin ulcers, stroke, angina and Myocardial Infarction, foot problems, sexual dysfunction (males), miscarriage and still birth (pregnant women), depression, Alzheimer’s, hearing impairment, Hyperosmolar Hyperglycemic Nonketotic Syndrome, hypoglycemia, diabetes ketoacidosis [4–7].
In India, prevalence of diabetic retinopathy, nephropathy and neuropathy ranges from 17.6 to 34.1 %, 8.9% to 36.3% and 9 to 64.1% respectively [8]. Previous study in Turkey has shown that complications of diabetes shares 66.7 to 70.5 % of the total cost of diabetes care [9]. In developing country like India out of pocket expenditure on healthcare are very high in absence of nationalized healthcare insurance policy. Many of them make payments for hospital expenditure through personal savings and 10-15% do so by borrowing loans, company reimbursement and selling personal properties (land, house, vehicle, jewelry etc.) [10]. With increase in prevalence of diabetes, direct cost related to complications is also increasing. The cost of treating diabetes related foot complications is highest in comparison to treating other complications [10]. Presence of comorbid condition like hypertension increases the diabetes management by 1.5 times in compared to non hypertensive diabetic individuals [10]. This study was conducted with an objective to compare the burden of complications of diabetes among hypertensive and non hypertensive diabetes individuals.
Materials and Methods
This hospital based cross-sectional study was conducted in Chennai, India at Saveetha Medical College and Hospital, from August 2013 to December 2013 for a period of five months. Patients admitted in internal medicine In-patient department (IPD) were approached for participating in the study. A total of 100 hypertensive and 50 non-hypertensive diabetes patients were enrolled on the basis of convenient sampling. The inclusion criteria comprised of individual of age equal or above 30 years, having diabetes with or without hypertension and ready to participate in study by providing informed consent. All participants were informed about the study purpose before their enrollment in the study. Patients having mental or physical challenges making difficulty in their participation in the study, or enrolled in other clinical studies were excluded from the study. Investigator had approached to eligible patients fulfilling the inclusion criteria and administered the questionnaire separately to maintain the confidentiality. This procedure was repeated until the desired target of 100 hypertensive diabetics and 50 non hypertensive diabetics was achieved. In this process 26 patients have refused to participate. Participants were on medications for diabetes and hypertension (hypertensive diabetics). The study conformed to the Declaration of Helsinki and the study protocol was approved by the Institutional Review Board (IRB) of Foundation of Healthcare Technologies Society, New Delhi, India (IRB#FHTS/013/2013). Anonymity of the participants was preserved by allocating distinctive identification codes.
Data Collection Tools
Information about the variables was gathered through a pretested, validated, semi-structured questionnaire. Same questionnaire was administered to both the groups. Sections of the data collection tool are summarized below:
Socio-demographic characteristics: Information was gathered about age (years), gender, type of family (joint, nuclear, broken, extended), marital status (single/married/divorce or separated/widow), family size, educational status {No formal education, Primary (1-5th grade), Middle (6-8th grade), High school (9-10th grade), Intermediate (11-12th) or equivalent, Graduate or Postgraduate}, annual household income (INR), and occupation status (skilled professional, unskilled professional, unemployed) [11].
Sample diabetes questionnaire: Three sections of this questionnaire were utilized, consisting of general health, symptoms and medical care. General health included single item of self rated health. Symptoms included health distress questions, fatigue, shortness of breath and physical pain in past two weeks. Medical care section included assessment of communication with physician and healthcare utilization [12].
Complications of diabetes: Further question was asked about the life time occurrence of following diabetes related complications: retinopathy, neuropathy, nephropathy, angina or myocardial infarction, stroke, ulcers, diabetic foot, diabetic coma and ketoacidosis.
Statistical Analysis
Mean, standard deviation and median of continuous variables and proportions of categorical were measured. Further analysis was performed to see association of diverse variables with dependent variables by applying chi-square and fisher exact test for categorical variables. T statistic test and spearmen correlation was performed to compare the difference in continuous variables. Analysis of data was performed in SPSS vs.16.
Results
Study results have shown that one of the three participants were in 50-59 years age group with average age of 55 years (SD=11). Average age of the hypertensive diabetes patients (M=57; SD=11) was higher than non hypertensive diabetes patients (M=52; SD=11) which was statistically significant (p=.009). More than half of the participants were female (52%), living in joint families (80%) with an average family size of 4 (SD=2). Relatively high proportions of urban participants were observed among hypertensive diabetics in comparison to non-hypertensive diabetics (72% vs. 56%; p=.05). More than half of the participants had education level less than or equal to high school (62%). Participants had median annual household income of 120000 INR (1936 $USD approx.) [Table/Fig-1].
Sociodemographic Characteristics of the study participants.
| Variables | Hypertensive | Non-Hypertensive | Total | p-value |
|---|
| Age (Years) | M=57; SD=11 | M=52; SD=11 | M=55; SD=11 | .009 |
| 30-39 | 8 (8%) | 6 (12%) | 14 (9%) | .017 |
| 40-49 | 14 (14%) | 18 (36%) | 32 (21%) |
| 50-59 | 36 (36%) | 15 (30%) | 51 (34%) |
| 60-69 | 31 (31%) | 8 (16%) | 39 (26%) |
| ≥ 70 | 11 (11%) | 3 (6%) | 14 (9%) |
| Gender | .72 |
| Male | 47 (47%) | 25 (50%) | 72 (48%) |
| Female | 53 (53%) | 25 (50%) | 78 (52%) |
| Location | .05 |
| Urban | 72 (72%) | 28 (56%) | 100 (67%) |
| Rural | 28 (28%) | 22(44%) | 50 (33%) |
| Married | 94 (94%) | 46 (92%) | 140 (93%) | .21 |
| Family Type | .7 |
| Joint | 81 (81%) | 39 (78%) | 120 (80%) |
| Nuclear | 13 (13%) | 9 (18%) | 22 (15%) |
| Extended | 6 (6%) | 2 (4%) | 8 (5%) |
| Family Size | M=4;SD=2 | M=4;SD=2 | M=4;SD=2 | .8 |
| ≤ 2 | 24 (24%) | 9 (18%) | 33 (22%) | .37 |
| 3-4 | 44 (44%) | 28 (56%) | 72 (48%) |
| ≥ 5 | 32 (32%) | 13 (26%) | 45 (30%) |
| Highest Education Level | .65 |
| ≤ High School | 60 (60%) | 33 (66%) | 93 (62%) |
| Intermediate (11th-12th grade) or equivalent | 10 (10%) | 3 (6%) | 13 (9%) |
| Graduation or above | 30 (30%) | 14 (28%) | 44 (29%) |
| Occupation | .88 |
| Unemployed | 55 (55%) | 26 (26%) | 81 (54%) |
| Unskilled Professional | 30 (30%) | 17 (34%) | 47 (31%) |
| Skilled Professional | 15 (15%) | 7 (14%) | 22 (15%) |
| AnnualHouseholdIncome (INR) | M=20,3860;SD=18,4146;Md=12,0000 | M=15,8640;SD=12,1414;Md=11,4000 | M=18,8787;SD=16,6840;Md=12,0000 | .11 |
M=Mean; SD=Standard Deviation; Md=Median
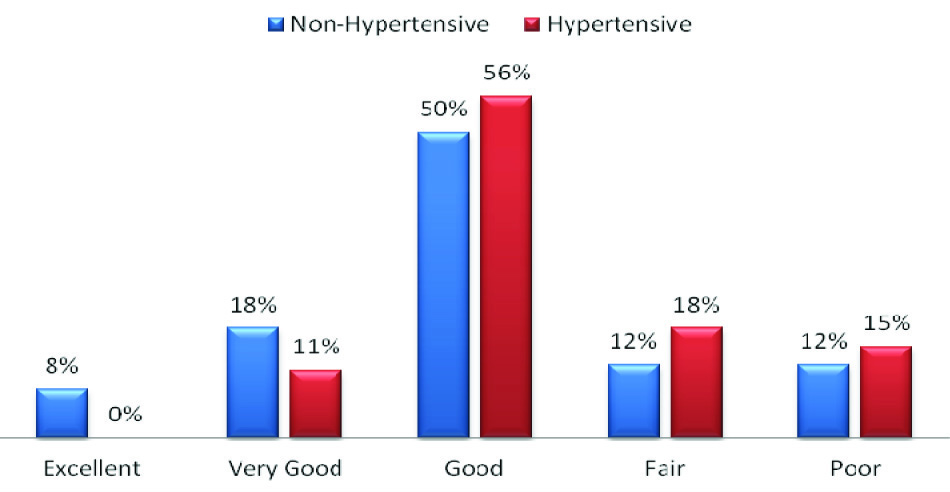
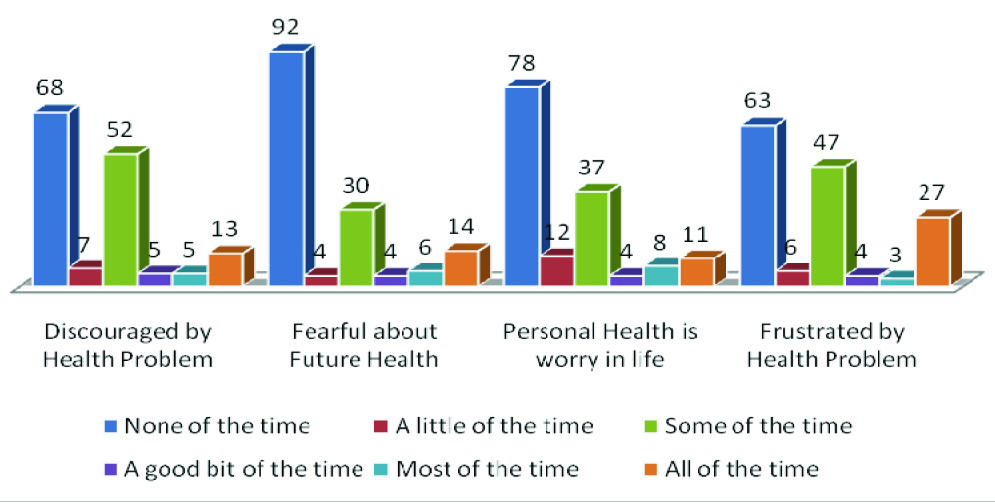
Three out of four non-hypertensive participants (76%) have rated their general health status good to excellent while the proportion of the hypertensive participants was 67% [Table/Fig-2]. There were no significant differences in proportion of participants reporting dejection by their health problems among hypertensive diabetics and non-hypertensive diabetics (53% vs. 58%). Fear of future health (some of the time to all of the time) was reported by 40% of the hypertensive diabetics and 36% of the non-hypertensive diabetics. More than half of the participants (52%; n=78) had never felt their person health as a worry in life and on the other hand one in four of them had reported that some of the time they felt that personal health is a worry in life. Fifty four percent of the participants reported frustration due their health problems (some of the time to all of the time) [Table/Fig-3].
Self-reported general health of the hypertensive and non hypertensive patients
Health distress as reported by the participants
The average health distress score of all four questions was 5.5 (SD=5.1) with median score of 4.4 of the total range of 0-20. There were no significant differences in average health distress scores of hypertensive diabetics (M=5.5±5) and non-hypertensive diabetics (5.4±5). Twenty eight percent of non-hypertensive diabetics and 19% of the hypertensive diabetics had scored zero (none of the time) for all of the health distress questions.
The average scores of fatigue visual numeric scale and shortness of breath visual numeric scale were 4.3 (SD=2.6) and 2.1 (SD=2) respectively. Proportion of participants reporting body pain in past two weeks was slightly higher among non-hypertensive in comparison to hypertensive participants (72% vs. 66%). Analysis was performed to see the differences in general health score, health distress score, fatigue visual numeric score and shortness of breath visual numeric score of hypertensive and non-hypertensive diabetes participants. Mean self reported general health score was higher among hypertensive diabetic participants (M=3.4; SD=1) in comparison to non hypertensive diabetic participants (M=3; SD=1) and it was found statistically significant (p=.03) indicating towards poor self health perception among hypertensive’s. Similarly average shortness of breath visual numeric score was significantly (p=.04) higher among hypertensive diabetes participants (M=2.3; SD=2) in comparison to non-hypertensive diabetes participants (M=1.6; SD=1.5).
Analysis was performed to observe the differences in diabetes related symptoms among hypertensive and non-hypertensive diabetics in past one week. Proportion of participants reporting nightmares in past week was higher among hypertensive diabetics in comparison to non-hypertensive diabetics (37% vs. 18%; p=.017). There were no significant differences among hypertensive and non-hypertensive diabetics in reporting of increased thirst, dry mouth, decreased appetite, nausea and vomiting, abdominal pain, frequent urination, severely high blood sugar, morning headaches, night sweats, shakiness or weakness and fainting episode [Table/Fig-4].
Presence of diabetes symptoms and complications as reported by the participants
| In the Previous Week, did you ever have any of the following symptoms? | Hypertension | Total | p-value |
|---|
| No | Yes |
|---|
| Increased thirst | No | 30 (60%) | 59 (59%) | 89 (59%) | .9 |
| Yes | 20 (40%) | 41 (41%) | 61 (41%) |
| Dry mouth | No | 27 (54%) | 59 (59%) | 86 (57%) | .55 |
| Yes | 23 (46%) | 41 (41%) | 64 (43%) |
| Decrease appetite | No | 33 (66%) | 71 (71%) | 104 (69%) | .53 |
| Yes | 17 (34%) | 29 (29%) | 46 (31%) |
| Nausea and Vomiting | No | 41 (82%) | 74 (74%) | 115 (77%) | .27 |
| Yes | 9 (18%) | 26 (26%) | 35 (23%) |
| Abdominal Pain | No | 43 (86%) | 78 (78%) | 121 (81%) | .24 |
| Yes | 7 (14%) | 22 (22%) | 29 (19%) |
| Frequent urination at night? Do you have to get up to urinate 3 or more times a night? | No | 35 (70%) | 69 (69%) | 104 (69%) | .9 |
| Yes | 15 (30%) | 31 (31%) | 46 (31%) |
| Severely high blood sugar (random blood sugar ≥300 mg/dl) | No | 24 (48%) | 61 (61%) | 85 (57%) | .13 |
| Yes | 26 (52%) | 39 (39%) | 65 (43%) |
| Morning headaches | No | 41 (82%) | 70 (70%) | 111 (74%) | .11 |
| Yes | 9 (18%) | 30 (30%) | 39 (26%) |
| Nightmares | No | 41(82%) | 63 (63%) | 104 (69%) | .017 |
| Yes | 9 (18%) | 37 (37%) | 46 (31%) |
| Night Sweats | No | 37 (74%) | 70 (70%) | 107 (71%) | .61 |
| Yes | 13 (26%) | 30 (30%) | 43 (29%) |
| Shakiness or weakness | No | 33 (66%) | 63 (63%) | 96 (64%) | .71 |
| Yes | 17 (34%) | 37 (37%) | 54 (36%) |
| Intense hunger | No | 40 (80%) | 76 (76%) | 116 (77%) | .58 |
| Yes | 10 (20%) | 24 (24%) | 34 (23%) |
| Times when you passed out fainted or lost consciousness, even for a short time | No | 41 (82%) | 85 (85%) | 126 (84%) | .63 |
| Yes | 9 (18%) | 15 (15%) | 24 (16%) |
Diabetes Related Complications
Diabetic neuropathy was reported by 45% of the hypertensive and 38% of the non-hypertensive diabetics. Stroke and Myocardial Infarction was reported by 3% and 7% of the total participants respectively. Proportion of participants reporting diabetic nephropathy was similar among hypertensive (42%) and non-hypertensive diabetics (42%). Twenty three percent of the hypertensive diabetics and 12% of the non-hypertensive diabetics have reported diabetic retinopathy. Diabetic foot was reported by 20% of hypertensive diabetics and 13% of non-hypertensive diabetics. Proportion of participants reporting diabetic ulcer among hypertensive and non-hypertensive diabetics were 16% and 20% respectively. One participant reported episode of diabetes coma and three of them had experienced diabetic keto-acidosis.
Health Information Seeking Behaviour and Medical Care
Results of the study have shown that the proportion of participants who have prepared any list of questions before visiting doctor’s clinic (fairly often to always) was significantly higher among hypertensive diabetics (30%) in comparison to non-hypertensive diabetics (14%). Proportion of participants having little or no interest in asking questions about the things they wanted to know and the things they did not understand about their treatment among hypertensive and non-hypertensive diabetics was 64% and 72% respectively. Majority of the participants have never discussed (81%) any personal problems which might have been related to their illness. Participant’s average number of visits to physician’s clinic in past six months was observed to be higher among hypertensive (5±2 visits) than non-hypertensive diabetics (3±2 visits). There were no significant differences in number of emergency visits, night stays in hospitals and eye and feet examination in past six months among the hypertensive and non-hypertensive diabetics [Table/Fig-5].
Communication with physician and healthcare utilization status of the participants
| Variables | Hypertension | Total | p-value |
|---|
| No | Yes |
|---|
| Prepare a list of questions your doctor | .032 |
| Never to Sometimes | 43 (86%) | 70 (70%) | 113 (75%) |
| Fairly often to Always | 7 (14%) | 30 (30%) | 37 (25%) |
| Ask question about the things you want to know and things you don’t understand about your treatment | .32 |
| Never to Sometimes | 36 (72%) | 64 (64%) | 100 (67%) |
| Fairly often to Always | 14 (28%) | 36 (36%) | 50 (33%) |
| Discuss any personal problems that may be related to your illness | .68 |
| Never to Sometimes | 47 (94%) | 96 (96%) | 143 (95%) |
| Fairly often to Always | 3 (6%) | 4 (4%) | 7 (5%) |
| Number of visits to physicians clinic in last six months | M=3(SD=2);Md=2 | M=5(SD=2);Md=6 | M=4(SD=2);Md=5 | <.0001 |
| 1-2 | 26 (52%) | 8 (8%) | 34 (23%) | <.0001 |
| 3-4 | 15 (30%) | 15 (15%) | 30 (20%) |
| ≥5 | 9 (18%) | 77 (77%) | 86 (57%) |
| Number of visits to hospital emergency department |
| Never | 43 (86%) | 85 (85%) | 128 (85%) | .98 |
| 1 | 6 (12%) | 13 (13%) | 19 (13%) |
| ≥ 2 | 1 (2%) | 2 (2%) | 3 (2%) |
| Number of Night Stays in Hospital | N=5 | N=7 | N=12 | .17 |
| M=7(SD=6);Md=4 | M=3(SD=2);Md=3 | M=5(SD=4);Md=3.5 |
| Eye examination | .16 |
| Never | 11 (22% | 10 (10%) | 21 (14%) |
| ≤ 6 months | 11 (22%) | 34 (34%) | 45 (30%) |
| 7-12 months | 21 (42%) | 43 (43%) | 64 (43%) |
| >12 months | 7 (14%) | 13 (13%) | 20 (13%) |
| Number of times healthcare provider has examined your feet in last six months | M=2(SD=2);Md=2 | M=3(SD=2);Md=2 | M=2.5(SD=2);Md=2 | .08 |
| Never | 10 (20%) | 6 (6%) | 16 (11%) | .057 |
| 1-2 | 23 (46%) | 47 (47%) | 70 (47%) |
| 3-4 | 10 (20%) | 26 (26%) | 36 (24%) |
| 5-6 | 7 (14%) | 21 (21%) | 28 (19%) |
Further analysis was performed to see correlation of independent variables with health distress scores. Age (r=-.05; p=.5) and annual house hold income (r=-.03; p=.68) have shown negative correlations with health distress score but they were not statistically significant. General health score (r=.35; p<.0001), fatigue visual numeric score (r=.38; p<.0001), shortness of breath visual numeric score (r=.21; p=.007) and communication with physician score (r=.19; p=.015) have shown statistically positive association with health distress score.
Discussion
Diabetes and hypertension are well entwined conditions, sharing overlap of multiple risk factors and complications. Three out of four diabetes patients also have hypertension and some of the hypertensive patient’s show occurrence of insulin resistance [13]. Diabetes related complications poses huge burden on patients, their families and healthcare systems [14]. In this study we have attempted to see the differences in the burden of diabetes related complications among hypertensive and non hypertensive diabetes patients.
Age is one of the important risk factors for occurrence of diabetes and its complications. The results of this study have demonstrated that average age of the participants was 55 years and age of hypertensive diabetes patients was significantly higher than non hypertensive’s. In India prevalence of diabetes is highest in 60 to 69 years age group [14]. There were no significant differences in gender of hypertensive and non hypertensive diabetes patients. Previous study had shown higher proportion of female (60.3%) participants in comparison to males (39.7%) [15]. Present study had shown no significant difference in annual household income of hypertensive and non hypertensive diabetes patients. In contrast to previous study in which more than half of the participants were form nuclear families, our study majority of participants were of joint families [15].
Diabetic neuropathy (45%) and diabetic nephropathy (42%) were the most common complication among hypertensive and non-hypertensive participants respectively. Similarly proportion of participants who had reported diabetic foot and retinopathy was higher among hypertensive diabetes. In previous study prevalence of diabetic neuropathy was 26.1% [16]. In India prevalence of nephropathy ranges 8.9% to 36.3% [8]. In diabetes nephropathy patients the prevalence of hypertension increases with each stage of chronic kidney disease [17].
In present study, 24% of the non-hypertensive diabetics and 33% of the hypertensive diabetics reported their general health as fair/poor and these results were higher than previous study in which 14.7% of the participants reported their health as fair/poor [18]. General health score and shortness of breath visual numeric scores of the hypertensive diabetes patients were significantly higher than non hypertensive diabetes patients. Health distress score and complications of diabetes have not shown any significant differences.
Limitations of The Study
Present study has certain limitations which include small sample size and cross sectional study design. Further it was conducted in single hospital based setting so its results cannot be generalized with other geographical locations. Temporal association of the variables could not be determined. Confounders like smoking and alcohol consumption, physical activity and financial expenditure on complications were not included. These factors can influence occurrence of complications directly or indirectly. The proportion of individuals having diabetic neuropathy and retinopathy was higher among hypertensive diabetic patients and proportion of individuals with nephropathy was similar in both the groups. Further self reported general health was poor among hypertensive diabetics. Previous study had shown direct relation of diabetes related complication and systolic blood pressure [19].
Conclusion
In our study none of the diabetes related complications have shown any statistically significant differences between hypertensive and non hypertensive diabetes patients. Further, results of the study showed that number of visits to physician’s clinic and participants preparing list of questions for physician was higher among hypertensive diabetics in comparison diabetics. Considering the important issue of diabetes related complications there is need of sensitizing non-hypertensive diabetics for regular physicians clinic visit and it may be recommended that treating physicians should provide greater awareness about complication of diabetes and hypertension and their management.
M=Mean; SD=Standard Deviation; Md=Median