Vancomycin remains the antibiotic of choice to treat MRSA infections. However, there are increasing numbers of reports indicating the emergence of VRSA strains. Initially vancomycin-intermediate S. aureus (VISA) was noted in Japan in 1996 and subsequently in United States in 1997 [4].
Clindamycin is an alternative choice for mild to moderate MRSA infections. However, the sub-inhibitory concentration of erythromycin is a common inducer clindamycin resistance which leads to cross-resistance between macrolides, lincosamides and streptogramin B, called MLSB resistance [5] which can either be constitutive or inducible [6].
Daptomycin is a lipopeptide antibiotic that disrupts the bacterial cell membrane potential and permeability in a calcium-dependent manner. S. aureus strains with higher daptomycin MICs i.e. Daptomycin non-susceptible S. aureus (DNSA) include enhanced membrane fluidity, increased net positive surface charge, and decreased daptomycin surface binding [8].
No such data currently exists for the state of Tripura, but nonresponse to therapy by antibiotics is being reported by the clinicians. Therefore this study was undertaken to evaluate the prevalence of multidrug resistance in S. aureus isolated in the Department of Microbiology from different clinical samples and their association to biofilm production.
Materials and Methods
This was a hospital based cross-sectional study conducted in Department of Microbiology at tertiary care hospital in Tripura over a period of six calendar months (May-Oct, 2013). This was first of its type of study done in this region. Non-repeating S. aureus isolates from different clinical samples received in the department of microbiology were evaluated in the study. The study was conducted following clearance by the institutional ethical committee and Indian Institute of Medical Research (ICMR). The suspicion for CA-MRSA is based on the Centres for Disease Control and Prevention (CDC) criteria to distinguish CA-MRSA from HA-MRSA [10].
Culture and Identification: All the received samples except urine samples were inoculated in Blood agar, MacConkey agar and Mannitol Salt agar (MSA). Urine samples were inoculated in Cysteine Lactose Electrolyte Deficient agar and MSA. Plates were incubated at 37°C for 24 hours. S. aureus was identified and differentiated from related organisms on the basis of standard biochemical tests [11].
Antibiotic susceptibility test: Routine antibiotic susceptibility testing was performed on all the isolated S. aureus strains by Kirby Bauer disc diffusion method on Mueller- Hinton agar (MHA) plates for the following antibiotics co-trimoxazole 25μg; fusidic acid 15μg; linezolid 15μg; rifampicin 5μg; ciprofloxacin 5μg; gentamicin, 10μg; oxacillin 1μg; kanamycin 30μg; Teicoplanin (TP) 30μg; chloramphenicol 30μg; pristinomycin 15μg; tigecycline 15μg; telithromycin 15μg and tetracycline 30μg (Himedia, Mumbai, India). The results were interpreted according to the Clinical and Laboratory Standards Institute (CLSI) guidelines and for tigecycline, the European Committee on Antimicrobial Susceptibility Testing (EUCAST) guidelines were followed. Staphylococcus aureus ATCC 25923 was used as a control strain [11–13].
Detection of MRSA and β-lactamase: All the S. aureus isolates were subjected to cefoxitin 30μg disc diffusion test.A 0.5 McFarland standard suspension of the isolate was made and lawn culture was done on MHA plate and incubated at 37°C for 18 hours. An inhibition zone diameter of ≤ 21mm was reported as MRSA and ≥ 20mm was considered as MSSA [12]. Staphylococcus aureus ATCC 25923 was used as a negative control whereas Staphylococcus aureus ATCC 43300 was used as positive control strain.
Detection of penicillinase production was done by Penicillin G 10 unit discs and confirmed by acidometric method [12,14]. Borderline oxacillin resistant S. aureus (BORSA) strains are those strains which have very high β-lactamase activity, showed resistance towards oxacillin but cefoxitin disc diffusion test was negative. Whereas those which showed resistance towards oxacillin but neither produced β-lactamase nor expressed mecA gene was termed as moderately resistant S. aureus (MODSA) [15]. β-lactamase producing Staphylococcus aureus ATCC 29213 was used as positive control and Staphylococcus aureus ATCC 25923 as negative control.
Majority of mecC MRSA show resistance to cefoxitin, however they show susceptibility to oxacillin contrary to mecA, which is resistant to both cefoxitin and oxacillin [16].
For the identification of homogeneous or heterogeneous MRSA, Oxacillin MIC was done in MHA containing 2% sodium chloride. Isolates with MICs ≥100 μg/ml were noted as homogeneous MRSA; those with ≥ 4 and < 100 μg/ml and with a colony inside the zone of inhibition were regarded as heterogeneous MRSA [6].
Biotyping:
Biotyping of MRSA strains were done into 4 groups as shown below in [Table/Fig-1] [1].
Biotyping of MRSA strains [1]
| Test biotype | A | B | C | D |
|---|
| Tween 80 hydrolysis | - | - | + | + |
| Urease production | - | + | - | + |
| Pigmentation on Tween 80 agar | Cream | Buff | Variable | Gold |
| Gentamicin susceptibility | S | R | S | R |
Detection of VRSA/VISA/heteoresistant VISA (hVISA) and DNSA by E-test: All isolates of S. aureus were subjected to E-tests for detection of VRSA, VISA, hVISA and DNSA. Minimum inhibitory concentration (MIC) for vancomycin (VA) and daptomycin (DA) was determined by E-test strips. S. aureus isolates with VA MICs of ≤2μg/ml and DA MICs of ≤1 μg/ml was considered susceptible respectively. VISA was defined by MICs of 4-8μg/ml, and VRSA by MICs of ≥16μg/ml [12]. For Da, DNSA was defined by MICs of >2 μg/ml [8]. E test macro method with E test Glycopeptide resistance detection (GRD) strips: VA /TP 32-0.5 μg/ml double-sided gradient were used on Mueller Hinton agar + 5% blood (MHB) and read at 18-24 hours and 48 hours. The MIC cut-offs used at 24 and 48 hours were: VISA: TP ≥12μg/ml or VA ≥8μg/ml and standard VA MIC ≥6μg/ml; hVISA: TP ≥12μg/ml or VA ≥8μg/ml and standard VA MIC ≤4μg/ml [17]. Enterococcus faecalis ATCC 51299 and Enterococcus faecalis ATCC 29212 were used as positive and negative control strains respectively. Staphylococcus aureus ATCC 25923 as control strain for daptomycin [12].
Detection of MLSB resistance by D-zone test: The Erythromycin and Clindamycin double disc susceptibility test (D-zone test) was performed on all S. aureus strains. Clindamycin (CD) 2 μg and erythromycin (E) 15 μg discs was placed at a distance of 15mm edge to edge in MHA [1,12]. Staphylococcus aureus ATCC 25923 as control strain.
Differentiation of phenotypes of MLSB resistance in S. aureus is possible by the criteria shown in [Table/Fig-2] [18]:
Criteria for differentiation of phenotypes of MLSB resistance in S. aureus
| Phenotype | Inductiontest type | Clindamycin sensitivity | ErythromycinSensitivity | Remark |
|---|
| Inducible MLSB | D | S (→ R) | R | Blunted D-shaped clear zone around CD, near E. |
| Inducible MLSB | D+ | S (→R) | R | Blunted D-shaped zone around CD near E and small colonies growing into CD zone in an otherwise clear zone. |
| Constitutive MLSB | Hazy DInducible+Constitutive | R | R | Sometimes 2 zones of growth appear around CD. An inner zone of light growth and an outer zone of confluent growth. The inner zone is blunted, near to E. |
| Constitutive MLSB | R | R | R | No hazy zone. Growth up to both E and CD. |
| MSB | Negative | S | R | Clear susceptible zone around CD. |
| CL§ | Negative | I/R | S | Clear susceptible zone around E. No zone around CD or reduced zone size (< 21 mm). |
| No resistance | S | S | S | Clear susceptible zone diameter. |
§CL= Constitutive lincosamide resistance
Detection of MUPL and MUPH by disc diffusion test: The isolates which were resistant to 5 μg mupirocin discs were subjected to 200 μg mupirocin discs. Absence of any zone of inhibition indicated the presence of MUPH whereas presence of minimum zone of inhibition was considered to have MUPL [12]. Staphylococcus aureus ATCC BAA-1708 was used as positive control whereas Staphylococcus aureus ATCC 25923 as negative control [12].
Determination of Multiple Antibiotic Resistance (MAR) index: The MAR index was determined for each isolate using the formula MAR=x/y, where x was the number of antibiotics to which test isolate displayed resistance and y is the total number of antibiotics to which the test organism has been evaluated for sensitivity [1]. Multidrug resistant S. aureus (MDRSA): non-susceptible to ≥1 agent in ≥3 antimicrobial categories. Extensively drug-resistant S. aureus (XDRSA: non-susceptible to ≥1 agent in all but ≤ 2 categories [19].
Detection of biofilm formation by Congo red agar method: Slime production was studied by Congo red agar method for each S. aureus isolates. Biofilm production is indicated by black colonies with a dry crystalline consistency whereas biofilm non-producers remain pink, though occasional darkening at the centre of the colony may be observed. A darkening of colonies with absence of crystalline colony morphology indicates an indeterminate biofilm production [1].
Statistical tools: Compiled data was analysed and compared using χ2 test. P <0.05was taken as “statistically significant”.
Results and Observations
A total of 100 (31.7%) S. aureus strains were isolated from a total of 315 clinical specimens like pus (40%), urine (20%), blood (25%), vaginal secretion (6%), sputum (3%), cerebrospinal fluid (2%) and others (4%). The mean age of the study group was 48.6 years with an age span from <1 to 85-year-old with 62% male.
The prevalence of MRSA was 47% (47/100) of which 25.5% (12/47) was from blood, 23.4% (11/47) from urine, 46.8% (22/47) from pus 2.1% (1/47) from sputum and 2.1% (1/47) from vaginal secretion. Of the 47 MRSA isolates, 85.1% (40/47) were homogeneous MRSA and 14.9% (7/47) were heterogeneous MRSA. Out of 100 S. aureus strains 73% isolates were penicilinase producers. Phenotypically out of 47 MRSA strains, 97.9% (46/47) was mecA positive and 2.1% (1/47) was mecC positive whereas in MSSA 28.3% (15/53) belonged to MODSA and 11.3% (6/53) to BORSA.
Out of 47 MRSA strains, 63.8% (30/47) were HA-MRSA infections whereas rest 36.2% (17/47) was caused by CA-MRSA strains. Among HA-MRSA and CA-MRSA strains 93.3% (28/30) and 82.4% (14/17) were penicilinase producers respectively. Type ability by biotyping was found to be 85.1 %. Maximum number of isolates belonged to Group A (34%) followed by Group C (25.5 %), Group B (19.1 %) and Group D (6.4 %). Rest 14.9 % isolates could not be categorized and hence were called nontypeable group.
Out of 100 S. aureus isolates, the prevalence of VRSA, VISA, and hVISA was found to be 3%, 12% and 6% respectively.
[Table/Fig-3] shows higher prevalence of both iMLSB and cMLSB in MRSA strains compared to MSSA strains where MSB and CL were more prevalent.
Distribution pattern of MLSB phenotypes in MRSA and MSSA
| Organisms | MLSB phenotypes |
|---|
| iMLSB | cMLSB | MSB | CL | No resistance | Total |
|---|
| HA-MRSA | 7(23.3%) | 13(43.3%) | 4(13.3%) | 2(6.6%) | 4(13.3%) | 30(100%) |
| CA-MRSA | 2(11.8%) | 2(11.8%) | 2(11.8%) | 0(0%) | 11(64.6%) | 17(100%) |
| MSSA | 3(5.7%) | 10(18.9%) | 9(17%) | 5(9.4%) | 26(49.1%) | 53(100%) |
| Total | 12(12%) | 25(25%) | 15(15%) | 7(7%) | 41(41%) | 100(100%) |
[Table/Fig-4] shows higher prevalence of both MUPL and MUPH in MRSA strains compared to MSSA strains.
Distribution pattern of Mupirocin resistance phenotypes in MRSA and MSSA
| Organisms | Mupirocin resistance phenotypes |
|---|
| MUPL | MUPH | No resistance | Total |
|---|
| HA-MRSA | 5(16.7%) | 3(10%) | 22(73.3%) | 30(100%) |
| CA-MRSA | 4(23.5%) | 0(0%) | 13(76.5%) | 17(100%) |
| MSSA | 7(13.2%) | 0(0%) | 46(86.8%) | 53(100%) |
| Total | 16(16%) | 3(3%) | 81(81%) | 100(100%) |
[Table/Fig-5] shows higher prevalence of VRSA, VISA and hVISA in HA-MRSA strains compared to CA-MRSA and MSSA strains.
Distribution pattern of Vancomycin resistance phenotypes in MRSA, and MSSA
| Organisms | Vancomycin resistance phenotypes |
|---|
| VRSA | VISA | hVISA | No resistance | Total |
|---|
| HA-MRSA | 3(10%) | 10(33.3%) | 3(10%) | 14(46.7%) | 30(100%) |
| CA-MRSA | 0(0%) | 2(11.8%) | 2(11.8%) | 13(76.4%) | 17(100%) |
| MSSA | 0(0%) | 0(0%) | 1(1.9%) | 52(98.1%) | 53(100%) |
| Total | 3(3%) | 12(12%) | 6(6%) | 79(79%) | 100(100%) |
Among VRSA strains, iMLSB and MSB were expressed by 33.3% (1/3) strains each. Whereas iMLSB, cMLSB and MSB were expressed in 25% (3/12), 16.7% (2/12) and 16.7% (2/12) VISA strains respectively. Moreover hVISA co-expressed iMLSB, cMLSB and CL phenotypes in 33.3% (2/6), 16.7% (1/6) and 16.7% (1/6) strains respectively. MUPL was co-expressed by 66.7% (2/3) VRSA, 25% (3/12) VISA, and 33.3% (2/6) hVISA strains respectively whereas MUPH was expressed by 33.3% (1/3) VRSA and 16.7% (2/12) VISA strains respectively.
iMLSB, cMLSB, MSB and CL were co-expressed in 12.5%, 25%, 25% and 6.2% of MUPL strains respectively whereas iMLSB and cMLSB were co-expressed in 66.7% and 33.3% MUPH strains respectively.
Only one isolate was found to be DNSA and which was also a MRSA, VISA, cMLSB, MUPL and penicillinase producer. All the S. aureus isolates showed susceptibility towards tigecycline.
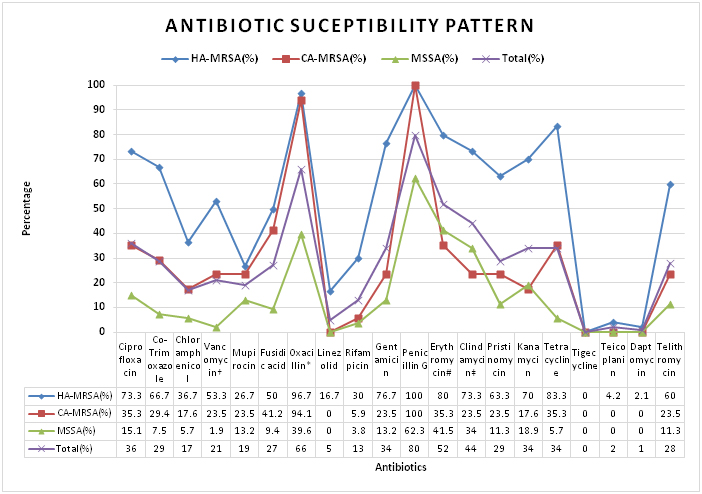
[Table/Fig-6] shows much higher resistance in case of MRSA strains in comparison to MSSA strains. Among MRSA, HA-MRSA shows higher degree of resistance to non β-lactam antibiotics than CA-MRSA.
Antibiotic sensitivity pattern in S. aureus
* (BORSA+MODSA) strains, † (hVISA+VISA+VRSA) strains, # (iMLSB+cMLSB+MSB) strains, ‡ ((iMLSB+cMLSB+CL) strains
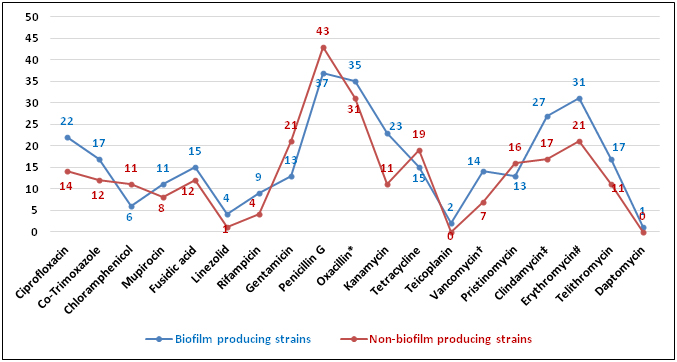
[Table/Fig-7] shows increased resistance in biofilm producers in case of ciprofloxacin, co-trimoxazole, rifampicin, kanamycin, erythromycin and clindamycin.
Antibiotic resistance in Biofilm producers and Non-biofilm producers
* (BORSA+MODSA) strains, † (hVISA+VISA+VRSA) strains, # (iMLSB+cMLSB+MSB) strains, ‡ ((iMLSB+cMLSB+CL) strains
Biofilm production was found in 55% strains of S. aureus. Out of 47 MRSA strains 36 (76.6%) were producing biofilm in comparison to 19 out of 53 i.e. 38.8% in case of MSSA. In HA-MRSA and CA-MRSA the prevalence of biofilm production was found to be 83.3% (25/30) and 64.7% (11/17) respectively. Co-expression of biofilm was seen in 43.8% (32/73) of penicillinase producing S. aureus strains. In case of hVISA, VISA and VRSA 33.3%, 66.7%, 100 % were biofilm producers respectively. Among MLSB phenotypes, 66.7% (8/12) iMLSB, 68% (17/25) cMLSB, 46.7% (7/15) MSB and 42.8% (3/7) CL produced biofilm. All the strains expressing MUPH and 50% (8/16) strains expressing MUPL produced biofilm. The only one DNSA isolate also expressed biofilm production.
Overall, the S. aureus were resistant from 2 to 17 antibiotics out of 18 antibiotics tested, generating a multiple antibiotic resistance index (MAR) range from 0.11 to 0.94 with a mean of 0.64. The prevalence of MDRSA and XDRSA was 57% (57/100) and 7% (7/100) respectively.
Discussion
This study demonstrates high prevalence (47%) of MRSA strains circulating, isolated from a total of 315 clinical specimens comprising of pus, blood, stool, urine and other body secretions which were tested for multidrug resistance. Of these 100 S. aureus isolates, 47% were found to be expressing MRSA similar to studies done [20,21] here rate of MRSA was 48% and 44% respectively. Out of these 47 MRSA strains only one strain was suspected to have mecC and rest 46 to have the usual mecA which is quite similar to studies [22] where prevalence of mecC was 2.8% respectively. The rate of homogeneous and heterogeneous MRSA was 85.1% and 14.9% respectively similar to the finding of a study [6]. Moreover the prevalence of HA-MRSA and CA-MRSA infection was 63.8% and 36.2% respectively which is quite similar to studies [3].
In the present study 34% of MRSA belonged to biotype A followed by biotype C (25.5%), biotype B (19.1%) and biotype D (6.4%). Rest 14.9% isolates were nontypeable. Similar results were shown by studies like [23] whereas studies like [1] showed more prevalence of biotype C. The major advantages of biotyping are the simplicity, quickness and reproducibility. However, strain discrimination is limited with the use of biotyping only. In the study, prevalence of hVISA, VISA, VRSA is 6%, 12%, 3% respectively which is similar to studies done like [24] whereas in studies done like [25] the rates are much lesser. Among MRSA, the rate of VRSA, VISA and hVISA was 6.3%, 25% and 10.6% respectively which is higher than the results published in the studies like [24,25]. The prevalence of DNSA was found to be1% which is similar to [26].
The MLSB phenotypes which were studied, showed that the rates of iMLSB, cMLSB and MSB in case of MRSA to be 19.1%, 31.9% and 12.8% respectively in comparison to MSSA where rates are 5.7%, 18.9% and 17% respectively which is similar to the result showed by studies like [5,6].
One of the important aspect of the study was mupirocin resistance, prevalence of MUPL and MUPH among MRSA was 19.1% and 6.4% which was much higher in comparison to MSSA 13.2% and 0% respectively, trends quite similar to studies like [27,28].
β-lactamase production was studied which showed 73% strains were producing penicilinase which is higher than studies like [21] which showed rate of penicilinase production to be 59%. Out of 53 MSSA strains 28.3% and 11.3% strains were expressing MODSA and BORSA phenotypes respectively similar to the results shown in [15].
Other antibiotics showed higher resistance in case of MRSA strains which is shown in [Table/Fig-6] which is in line with studies done by [1,8]. Resistance towards non β-lactam antibiotics was found to be much higher in HA-MRSA strains compared to the CA-MRSA strains which is similar to the results obtained by [3,10].
Further study on biofilm production shows 53.2% among MRSA strains were biofilm producers in comparison to 28.3% among MSSA strains. In case of hVISA, VISA and VRSA 33.3%, 66.7%, 100% were biofilm producers respectively which is higher than the results observed in studies like [1]. Among MLSB phenotypes, 66.7% iMLSB, 68% cMLSB, 46.7% MSB and 42.8% CL produced biofilm. All the strains expressing MUPH and 50% (8/16) strains expressing MUPL produced biofilm. So, it is clear indication of higher prevalence of these resistant phenotypes among the biofilm producing strains. Higher degree of antibiotic resistance in biofilm producers was seen especially in case of ciprofloxacin, co-trimoxazole, rifampicin, kanamycin, erythromycin and clindamycin whereas gentamycin, tetracycline and penicillin resistance was more in non-biofilm producers which is similar to studies like [1,29].
In our study the rate of MDRSA was 57% which is quite high compared to the studies done like [6,30].
Conclusion
MRSA is the commonest nosocomial pathogens, it is essential to detect and treat them as early as possible which will definitely help in controlling nosocomial infections caused by this group of organisms associated with significant morbidity and mortality. Now-a-days, a majority of the S. aureus isolates has become multi-drug resistant. The control of these MDRSA has now become a therapeutic challenge. Co-expression of the resistance towards β-lactams, glycopeptides, aminoglycosides, fluoroquinolones and macrolides has further enhanced this adversity, as observed in our study.
Of all the available antimicrobial agents, vancomycin, daptomycin, tigecycline, teicoplanin and linezolid are the most active and reliable treatment options for infections caused by the MRSA.
Further studies on genotyping characterization of the resistant isolates along with detection of clonality by pulse field gel electrophoresis, Panton-Valentine leukocidin (PVL) virulence factor and staphylococcal cassette chromosome mec typing will help understanding the emergence of the resistant organisms. However, in resource poor setting phenotypic methods definitely help in identification of resistant strains in order to implement rational antibiotic stewardship programme.
§CL= Constitutive lincosamide resistance