Pregnancy-induced physiological and pathological ocular changes are well documented in the literature. Innocuous alterations such as chloasma of the periocular area, temporary variation in refractive error, decrease in intraocular pressure and reactive changes in retinal vessels are well described [1–3]. Pregnancy may exacerbate pre-existing conditions such as diabetic retinopathy and result in the manifestation of major late complications. A third smaller group of pregnancy-associated retinal conditions are diseases that are induced by pregnancy such as eclampsia-associated retinopathy and central serous chorioretinopathy (CSC) [1,2,4].
The choroid is a vascular region that has an important role in providing oxygen and nutrition to the outer retinal layers. This vascular network has the highest blood flow per unit weight of any tissue in the body (about 20 to 30 times greater than that of the retina), accounting for more than 70% of the blood flow in the eye [5]. Therefore, the choroid is subject to the influence of haemodynamic and possibly hormonal factors. Advances in imaging have greatly increased the ability to visualize the choroid, allowing better understanding of the choroid in health and disease. Enhanced depth imaging optical coherence tomography (EDI-OCT) is a technique, introduced by Spaide et al., that enables the visualization and measurement of the anatomical features of the choroid. This method of imaging is performed with spectral domain (SD) - OCT instruments focused on deeper ocular structures, such as the choroid [5,6].
Since the introduction of EDI-OCT the choroidal vascular response to pregnancy has been subject of few studies with discordant results [7–11]. This inconsistency might have been, at least in part, due to the fact that the choroidal thickness was measured at selected points of the macula. To our knowledge, the thickness of the macular area has not been evaluated in its entirety and choroidal macular volume has not been previously investigated in pregnancy. A quantitative assessment of overall choroidal anatomy, including volume at the posterior pole and topographic maps of this vascular bed, may be more useful in analysing choroidal behaviour [12].
The purpose of this study is to compare the thickness and volume of the maternal choroid in the third trimester of pregnancy with that of an age-matched control group of women by constructing a 3-dimensional topographic map. Considering that pregnancy is a physiological condition in which there are multiple haemodynamic and hormonal alterations that are especially pronounced in the last trimester, the authors hypothesize that pregnancy on its own may cause changes in the choroidal structure.
Materials and Methods
The present case-control study was carried out at the Centro Hospitalar Vila Nova de Gaia/ Espinho in 2014, after approval by the hospital’s Ethics Committee. Each participant was fully informed of the purpose and procedures of this study and provided written informed consent in agreement with the Declaration of Helsinki.
Twenty-four eyes of 12 healthy pregnant women and 12 healthy controls were included. The sample size was determined by the rule of thumb of 12 participants per group for pilot studies in medical research, according to vanBelle and Julious [13,14]. The pregnant women were recruited from routine medical visits of the last trimester. Inclusion criteria were an uncomplicated pregnancy in the third trimester (from 28 weeks of gestation), no systemic or ocular disease, absence of systemic medication other than prenatal vitamins, no smoking habits, emmetropia or a small refractive error (spherical equivalent <1.5D). The control group were healthy age-matched with a spherical equivalent inferior to 1.5D.
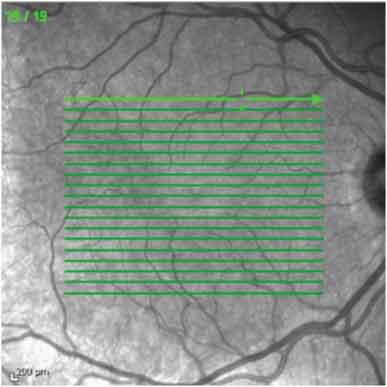
The participants underwent full ophthalmological examination including visual acuity, slit-lamp biomicroscopy, tonometry and fundus examination. The acquisition of the choroidal image was performed in the EDI mode of the Spectralis SD-OCT device (Heidelberg Engineering, Heidelberg, Germany) by a single experienced technician. A high resolution 19 raster line scan protocol was applied on a 200 by 200 area centred on the fovea with the horizontal lines spaced 240μm apart [Table/Fig-1].
The choroidal images were obtained by enhanced depth imaging optical coherence tomography (EDI-OCT) using a nineteen raster line scan protocol applied on a 200 by 200 area centred on the fovea
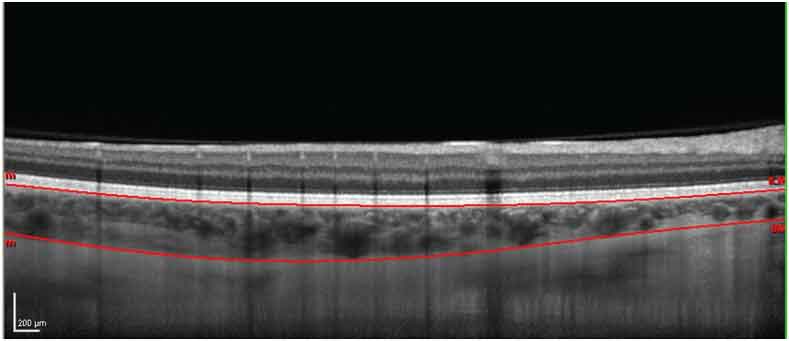
In order to improve image quality, 100 B scans were averaged together and the Eye Tracking software of the device was used. The boundaries of the retina are automatically plotted by the OCT software. For the definition of the choroidal limits, the line of the internal limiting membrane was manually readjusted to the retinal pigment epithelium (RPE) and the line on the RPE was moved to posterior boundary of the choroid [Table/Fig-2]. Images were assessed independently by two of the co-authors, masked to the status.
EDI-OCT image demonstrating the choroidal boundaries after manual readjustment of the line of the internal limiting membrane to the retinal pigment epithelium (RPE) and the line of the RPE to the posterior limit of the choroid
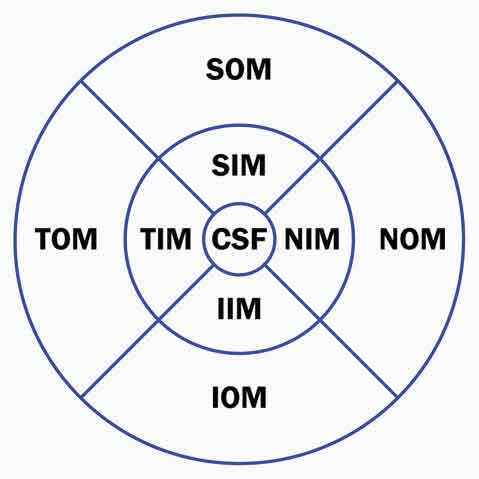
Choroidal thickness and volume were calculated automatically and presented as a colour coded topographic map by the Spectralis software. The Early Treatment Diabetic Retinopathy Study (ETDRS) grid was applied to the choroidal map dividing the macula into 9 subfields, encircled by rings of 1, 3 and 6 mm in diameter: central subfield (CSF); superior inner macula (SIM), inferior inner macula (IIM), temporal inner macula (TIM), nasal inner macula (NIM) in the second ring; superior outer macula (SOM), inferior outer macula (IOM), temporal outer macula (TOM) and nasal outer macula (NOM) in the outer ring. Additionally, the minimum and maximum central choroidal thicknesses were automatically calculated [Table/Fig-3].
Division of the macular area into the 9 ETDRS subfields: central subfield (CSF), superior inner macula (SIM), inferior inner macula (IIM), temporal inner macula (TIM), nasal inner macula (NIM), superior outer macula (SOM), inferior outer macula (IOM), temporal outer macula (TOM) and nasal outer macula (NOM)
Statistical Analysis
Statistical analysis was performed on the IBM SPSS Statistics software, version 20.0. The Kolmogorov Smirnov test was used to verify the normal distribution of choroidal thickness and volume. Two-way-ANOVA data analysis was employed to test for difference in variables between the two groups. A p-value of less than 0.05 was considered to be significant.
Results
The 48 eyes of 24 participants were included in our study. The mean age of the pregnant group was 32.77 ±2.08 years, compared to 32.92 ±3.01 years for the control group (p=0.894). The mean refractive error was -0.83 ±0.40D in the group of pregnant women and -0.52 ±0.47D in the control group (p=0.510). All participants had a best corrected visual acuity of 20/20 and normal ocular findings. The mean gestational age at the time of the examination was 32.4 weeks (range: 29 to 35 weeks).
There were no statistical differences in the total and subfield analysis of choroidal thickness and volume between right and left eyes, within the same patient [Table/Fig-4]. The average choroidal thickness of the ETDRS area was 295.15 ±42.40μm in the pregnant group and 271.56 ±37.65μm in the control group (p=0.051). The average total choroidal volume of the entire ETDRS area was 8.05 ±1.12mm3 for the pregnant group of women and 7.46 ±1.03mm3 for the control group (p=0.067).
Difference in choroidal (a) thickness (μm) and (b) volume (mm3) between control subjects and the pregnant group of women in each ETDRS subfield *p<0.05
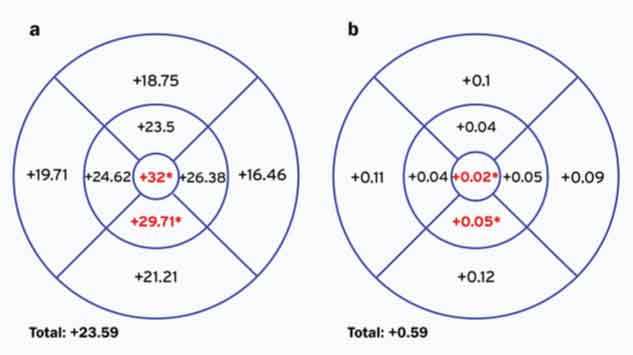
In this series, choroidal thickness and volume were greater in all subfields in the pregnant women compared to the control group. This difference was statistically significant only in the CSF and volume (p=0.034 and 0.029, respectively), minimum foveal thickness (p=0.007) and IIM thickness and volume (p=0.017 and 0.019, respectively).
[Table/Fig-5] shows the difference between groups in choroidal measurements in each ETDRS subfield. The difference in thickness and volume of the whole macular area was respectively of +23.59 μm and +0.59 mm3. In the CSF the difference in thickness and volume was of +32 μm and +0.02mm3 and in the IIM the difference was of +29.71 μm and +0.05 mm3 between the pregnant group of women and the control group (p<0.05).
Mean Choroidal Thickness and Volume in pregnant and non-pregnant women’s eyes
| Subfields | Pregnant group (n=12) | Control group(n=12) | p† | Eye‡ |
|---|
| Central subfield | Thickness | 319.58±6.11 | 287.58±43.44 | 0.034* | 0.718 |
| Min thickness | 276.21±46.32 | 240.88±39.50 | 0.007* | 0.719 |
| Max thickness | 358.92±67.37 | 335.67±58.74 | 0.217 | 0.691 |
| Volume | 0.25±0.04 | 0.23±0.04 | 0.029* | 0.673 |
| Superior inner macula | Thickness | 318.08±66.20 | 294.58±44.66 | 0.163 | 0.764 |
| Volume | 0.50±0.10 | 0.46±0.07 | 0.164 | 0.764 |
| Temporal inner macula | Thickness | 315.54±50.35 | 290.92±41.28 | 0.076 | 0.978 |
| Volume | 0.50±0.08 | 0.46±0.06 | 0.078 | 0.969 |
| Inferior inner macula | Thickness | 305.29±40.88 | 275.58±40.60 | 0.017* | 0.844 |
| Volume | 0.48±0.06 | 0.43±0.06 | 0.019* | 0.792 |
| Nasal inner macula | Thickness | 290.88±49.77 | 264.50±54.63 | 0.090 | 0.381 |
| Volume | 0.46±0.08 | 0.41±0.09 | 0.088 | 0.388 |
| Superior outer macula | Thickness | 297.13±51.01 | 278.38±37.84 | 0.163 | 0.935 |
| Volume | 1.58±0.67 | 1.48±0.20 | 0.161 | 0.948 |
| Temporal outer macula | Thickness | 288.29±47.97 | 268.58±34.37 | 0.115 | 0.753 |
| Volume | 1.53±0.254 | 1.42±0.18 | 0.123 | 0.751 |
| Inferior outer macula | Thickness | 287.92±44.50 | 266.71±40.77 | 0.097 | 0.453 |
| Volume | 1.53±0.24 | 1.41±0.22 | 0.096 | 0.444 |
| Nasal outer macula | Thickness | 233.67±51.72 | 217.21±57.07 | 0.306 | 0.326 |
| Volume | 1.24±0.27 | 1.15±0.30 | 0.296 | 0.319 |
| Total ETDRS map | Thickness | 295.15±42.40 | 271.56±37.65 | 0.051 | 0.661 |
| Volume | 8.05±1.12 | 7.46±1.03 | 0.067 | 0.643 |
Values are represented as mean± standard deviation
Inner 1-3 mm from foveal centre; outer 3-6mm from foveal centre
†Comparison between pregnant and control group eyes by the two-way ANOVA test
‡ Comparison between right and left eyes by the two-way ANOVA test
* Statistical significance if p<0.05
Discussion
The choroid is a vascular compartment which plays an important role in pressure regulation, temperature control and ocular nutrition [5,12,15,16]. It provides metabolic support of the RPE and blood perfusion to the outer layers of the retina and is the only source of metabolic exchange for the avascular fovea [5]. Abnormalities in choroidal structure and function are likely to contribute to the pathophysiology of many diseases affecting the retina, such as CSC or age-related macular degeneration [5,16,17].
Since the introduction of EDI-OCT technology by Spaide et al., it has been possible to accurately quantify choroidal thickness and volume in vivo [6]. However, few studies have investigated choroidal behaviour during pregnancy and to our knowledge, choroidal volume has not been documented in this subgroup.
Previous studies have measured choroidal thickness at selected points of the macula, with conflicting results. Takahashi et al., found no difference between control subjects and pregnant women at five locations (subfoveal and 3mm superior, inferior, nasal and temporal to the fovea), whilst Kara et al., and Sayin et al., showed an increased choroidal thickness at the subfoveal point [7–9]. Goktas et al., found an increased choroidal thickness at 3 points (subfoveal and 3mm nasal and temporal to the fovea) only in the second trimester of pregnancy [10].
Measurements taken at multiple single points could, however, be misleading in the global assessment of choroidal anatomy, since the irregularity of the inner chorioscleral border influences the measurement at few sampling points [12,18]. To overcome this problem, evaluation of the choroid over the entire posterior pole could be a better tool to evaluate its morphology during gestation.
In the current study, we evaluated the choroidal structure of healthy pregnant women and age-matched controls, using a volumetric analysis. The technique consists of applying manual choroidal segmentation at each raster line, to create a 3-dimentional topographic map, which permits an overall assessment of choroidal thickness and volume at the posterior pole. This method was described by Chhablani et al., and was found to be highly reproducible (r=0.98–0.99) [18]. Furthermore, to minimize any residual error, the manual segmentation was performed by two masked observers and the measurements were averaged.
In our study sample, all measurements of the thickness and volume of the choroid in the macular area were greater in the pregnant group than in the control group. However, this difference was statistically significant only in the CSF (thickness p=0.034, volume p=0.029 and minimum foveal thickness p=0.007) and in the IIM (thickness p=0.017 and volume p=0.019).
The choroidal measurements of the controls seem to be in line with what was to be expected for the age and sex of the group, although this is not easy to assess due to the heterogeneity of populations previously described in two studies [12,18]. In line with previous studies, the macular choroid showed gradual nasal thinning in both groups: the macular choroid was thinner in the nasal subfields than in the other quadrants both in the inner and outer rings [5,17,19,20].
In pregnancy the placenta and fetal adrenal produce abundant steroids which reach the maternal circulation [1]. It has been well established that plasma cortisol concentrations are elevated during pregnancy and found at their highest levels during the third trimester, with postpartum levels returning to within the normal range [1,21]. Pregnancy is also a recognised risk factor for CSC, especially in the third trimester [2,4,21,22]. In a case-control study by Haimovici et al., an odds ratio of 7:1 was found for the risk of CSC in pregnant women compared to control subjects, after adjustment for other risk factors [23]. Corticoids may contribute to the risk of the development of CSC in pregnancy, and it is possible that the choroid in healthy pregnant women is not immune from the influence of these hormonal levels, especially during the last trimester of pregnancy.
Corticoids can influence choroidal function by altering the production of free radicals, prostaglandins and nitric oxide (NO) with the impairment of choroidal vascular autoregulation. This may lead to abnormalities in blood pressure in the choriocapillaris and result in hyperpermeability of the choroid [21,24]. The effect of the NO/cGMP cascade on the structure of the choroid has been demonstrated using EDI-OCT with systemic sildenafil producing a significant increase in choroidal perfusion and thickness in healthy young males [25]. Corticoids also increase capillary fragility and permeability and propensity to blood coagulation which may lead to choroidal hypoperfusion and venous dilation [21,22].
In a study by Imamura et al., eyes with CSC were found to have a much thickened choroid when compared to control subjects (subfoveal thickness 505μm, p<0.001) [26]. In CSC hyperpermeable vessels from the choriocapillaris produce increased tissue hydrostatic pressure that may result in focal RPE detachment [22,27,28]. The underlying cause of choroidal thickening in CSC is not known, but it is postulated that if the tissue hydrostatic pressure induced by hyperpermeable choroidal vessels is enough to produce damage to the RPE, then it would be expected that the choroid itself would be thickened [26,28].
A possible structural change in the choroid of healthy pregnant women may result from the physiological haemodynamic and hormonal changes that are part of the adaptation to pregnancy, which in some specific cases are associated with an increased susceptibility to CSC.
In addition to hormonal factors, cardiovascular and haematological changes may affect the choroid. Choroidal thickness has been shown to exhibit a direct significant association with ocular perfusion pressure [29]. During gestation there is a decrease in vascular resistance and in arterial blood pressure and an increase in cardiac output and in resting pulse rate. Increases in renin and angiotensin levels produce an expansion of blood volume of up to 45% and a decrease in colloid osmotic pressure [1,2]. Since the choroid is primarily a vascular compartment, the haemodynamic changes of pregnancy may influence the choroidal shape.
Our study is limited by the small sample size. Moreover, the average gestational age of our study group was relatively early in the third trimester (average 32.4 weeks) and so our results may not reflect choroidal behaviour in the final weeks of pregnancy. Goktas et al., compared choroidal thickness in 3 selected points of the choroid of 3 groups of women during each trimester of pregnancy and found a significant increase of choroidal thickness in the second trimester of pregnancy, but not in the groups in the first or last trimesters [10]. In the future, a prospective study investigating choroidal changes during the gestational course may help better explain the effect of pregnancy on the choroidal structure. It would be interesting to determine whether the changes in choroidal thickness are more pronounced in the last weeks of pregnancy when serum cortisol reaches its highest levels.
Conclusion
Our results suggest that in the third trimester of pregnancy there may be an increase in thickness and volume of the maternal choroid, mainly in the central and inferior macula. Whether the physiological haemodynamic and hormonal adaptations are responsible for the choroidal structural changes in healthy pregnant women remains to be answered in future studies.
Values are represented as mean± standard deviation
Inner 1-3 mm from foveal centre; outer 3-6mm from foveal centre
†Comparison between pregnant and control group eyes by the two-way ANOVA test
‡ Comparison between right and left eyes by the two-way ANOVA test
* Statistical significance if p<0.05