WHO defined osteoporosis when bone mineral density (BMD) measured by dual energy X-ray absorptiometry (DEXA)scan is less than -2.5 standard deviation below the mean value for young adults for same age and sex (T- score), and further classified it into osteopenia, osteoporosis and severe osteoporosis according to BMD grading. Osteoporosis is one of leading cause and risk factor for fracture [1]. Globally, women have 30-40% risk of osteoporosis during her life time [2]. The ability to measure bone density by DEXA scan has been one of the most significant advances in the investigation and treatment monitoring of Osteoporosis. BMD correlates strongly with bone strength and accounts for 60% to 80% of bone strength. Bone strength depends not only on the amount of mineral but also on the structural characteristics of the skeleton such as size, shape, and three-dimensional architecture [3–5]. Until now the prediction of bone strength and risk of fracture has mainly been based on densitometry measurements. Lately, bone turnover biomarkers came into vogue to assess bone turnover rate and monitoring of treatment response in osteoporosis. Osteocalcin, also known as bone gamma-carboxyglutamic acid-containing protein (BGLAP) is secreted by osteoblasts during bone formation phase of bone remodeling [6,7]. In osteoporosis, generally there is a deficiency of calcium and phosphorus level and since osteocalcin is a calcium dependent biomarker and has a strong affinity with bone matrix (hydroxyapatite) responsible for mineralization of bone. Osteoporosis leads to decreased hydroxyapatite crystal formation and hence results in increase in serum osteocalcin levels [8,9].
The aim of this study is to assess the diagnostic potential of serum osteocalcin levels as a diagnostic indicator of primary osteoporosis in women.
Materials and Methods
The study was designed as a case-control study and was conducted in the orthopedics department of a medical college of northern India during a period of two years after clearance from the research and ethical committee of the institution. Postmenopausal females between 40-70 years of age reporting to the outpatient department were included in this study. Women with: a) secondary osteoporosis; b) bone tuberculosis; c) chronic debilitating diseases of kidney and liver; d) hormonal disorders; e) history of smoking and alcohol consumption; f) on medication with corticosteroids, anticonvulsant and heparin were excluded. We shortlisted 100 women and they were explained the purpose and relevance of the study and 82 women who volunteered were included in the study after informed and written consent. They were subjected to BMD assessment by DEXA scan of upper end femur and lumbar spine. Those with t-score above -1 SD were taken as controls and with t-scores less than -1 SD were taken as cases. Both, control and case group comprised of 41 women. The Case group subjects were graded as osteopenic, mild osteoporosis and severe osteoporosis on the basis of t-scores. Osteopenia was defined as t-score between -1 SD and up to -2.5 SD of normal adult bone mineral density, and osteoporosis was defined as t-score below -2.5 SD. T scoreless than -2.5 SD along with fragility fracture was labeled as severe osteoporosis.
Five ml whole venous blood sample of all the recruited subjects was drawn in syringe taking all aseptic precautions between 1400 hours-1600 hours. The sample taken was kept in plain vial at room temperature before sending in to laboratory. The sample was tested for serum level of osteocalcin by ELISA, serum calcium and serum alkaline phosphatase. The blood was centrifuged and serum was separated and stored in small capped vials for long term use at -200C until tested.
The results of serum calcium, serum alkaline phosphatase and serum osteocalcin levels were compared with the BMD and their relationship was assessed. Statistical analysis of levels of serum osteocalcin, the diagnostic biomarker, was done by SPSS software version. The difference in serum osteocalcin levels with respect to age, height, weight, BMI. Serum calcium, serum alkaline phosphate and status of bone mineral content (BMD) in case group and control group were analysed for the statistical significance (p-value). Correlation of serum osteocalcin levels with other variables like age, time duration since menopause, BMI and BMD was calculated by Pearson’s Correlation coefficient method.
Results
This case-control study included 82 post-menopausal females between 40-70 years and subdivided as Control group and Case group, each having 41 subjects. The mean age of the subjects was 54.51±10.4 years (Controls: 51.76±10.7, Cases: 57.27±9.4), mean weight was 63.29±16.8 kg (Controls: 60.73±16.3, Cases: 65.85±17.1), mean height was 155.35±7.9cm (Controls: 154.24±7.4, Cases: 156.46±8.3) and mean body mass index (BMI) was 25.78±4.6 kg/m2 (Controls: 25.12±4.6, Cases: 26.45±4.6). The mean duration since menopause was 7.15±5.1 years (Controls: 4.34±2.8, Cases: 9.95±5.4).
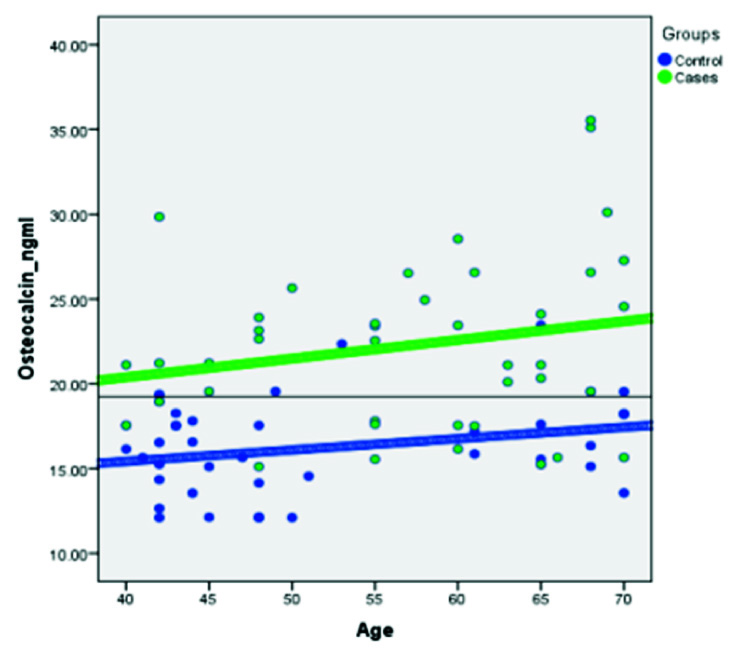
The mean serum calcium levels was 19.89±3.3 mg/dl (Controls: 20.70±3.7 mg/dl, Cases: 19.08±2.6 mg/dl), mean alkaline phosphate level was 68.23±11.7 U/L (Controls: 57.47±4.8 U/L, Cases: 78.99±3.9 U/L) and mean serum osteocalcin level was 19.25±5.1ng/ml (Controls: 16.21±2.8 ng/ml, Cases: 22.28±5.1 ng/ml). The mean t-score at femoral neck was -0.29±1.7 (Controls: 1.15±1.2, Cases: -1.74±0.6), at lumbar spine was-0.83±2.6 (Controls: 1.41±0.9, Cases:-3.07±1.4) and at forearm was -4.56 - 2.99(Controls: 1.36±1.2, Cases:-1.89±0.7) [Table/Fig-1].
Showing results of bone densitometry and blood biochemical tests
| Controls (n= 41) | Cases (n =41) | p-value |
|---|
| Age (years) | 51.76±10.7 | 57.27±9.4 | 0.016 |
| Weight (kg) | 60.73±16.3 | 65.85±17.1 | 0.169 |
| Height (cm) | 154.24±7.4 | 156.46±8.3 | 0.207 |
| BMI (kg/m2) | 25.12±4.6 | 26.45±4.6 | 0.197 |
| Total Calcium (mg/dl) | 20.70±3.7 | 19.08±2.6 | 0.025 |
| Alkaline Phosphate (U/L) | 57.47±4.8 | 78.99±3.9 | <0.001 |
| Osteocalcin level (ng/ml) | 16.21±2.8 | 22.28±5.1 | <0.001 |
| T Score | Lumbar spine | 1.41±0.9 | -3.07±1.4 | <0.001 |
| Femoral Neck | 1.15±1.2 | -1.74±0.6 | <0.001 |
The case group subjects were then graded as osteopenic, mild osteoporosis and severe osteoporosis on the basis of t-scores. There were 16 cases who had osteopenia and 25 cases had osteoporosis (mild: 19 cases and severe: 6 cases). Serum osteocalcin level in osteopenia cases was 19.25±5.09 ng/ml and in osteoporosis cases it was 22.03 ng/ml. The difference of serum osteocalcin levels between a) Control group (postmenopausal females with normal BMD) and osteopenia group as well as between; b) Control group and osteoporosis group both were assessed. The difference between controls and osteopenic group (0.005) as well as osteoporotic group (<0.001) was statistically significant [Table/Fig-2]. There was no significant difference between osteopenia and osteoporosis group osteocalcin levels (p=0.098). Osteocalcin level in mild osteoporosis cases was 21.34±3.9 ng/ml and in severe osteoporosis cases it was 22.9±4.9 ng/ml.
Shows osteocalcin level in controls, osteoporosis and osteopenia cases
| Osteocalcin level (ng/ml) |
|---|
| Osteopenia (n=16) | Control (n=41) | Osteoporosis (n=25) |
|---|
| Mean ± SD | 19.25±5.09 | 16.2±2.77 | 22.03±5.16 |
| p-value | 0.005 | <0.001 |
Next, correlation of serum osteocalcin levels with other variables like age, time duration since menopause, BMI and bone mineral density was calculated by Pearson’s Correlation coefficient method. A significant but mild correlation was found between serum osteocalcin levels with age (r=0.323, p=0.003) and years since menopause (r= 0.470, p=<0.001). BMI had weak non-significant correlation with serum osteocalcin level (r= 0.203, p= 0.067) while alkaline phosphate had strong and a positive correlation with serum Osteocalcin level (r= 0.602, p< 0.001). A significant inverse correlation between the osteocalcin level and femoral neck BMD (r=-0.527, p<0.001) and lumbar spine (r=-0.541, p<0.001) [Table/Fig-3].
Bivariate correlation of Osteocalcin levels with other variables
| Serum Osteocalcin level (ng/ml) |
|---|
| Pearson’s Correlation coefficient | Sig. (2-tailed significance) | Power of correlation |
|---|
| Age | 0.323** | 0.003 | Moderate |
| Years Since Menopause | .470** | <0.001 | Moderate |
| BMI | .203 | <0.067 | Mild |
| Alkaline phosphate | .602** | <0.001 | Strong |
| BMD | Lumbar spine | -0.541** | <0.001 | Strong |
| Femoral neck | -0.527** | <0.001 | Strong |
**Correlation is significant at the 0.01 level (2-tailed)
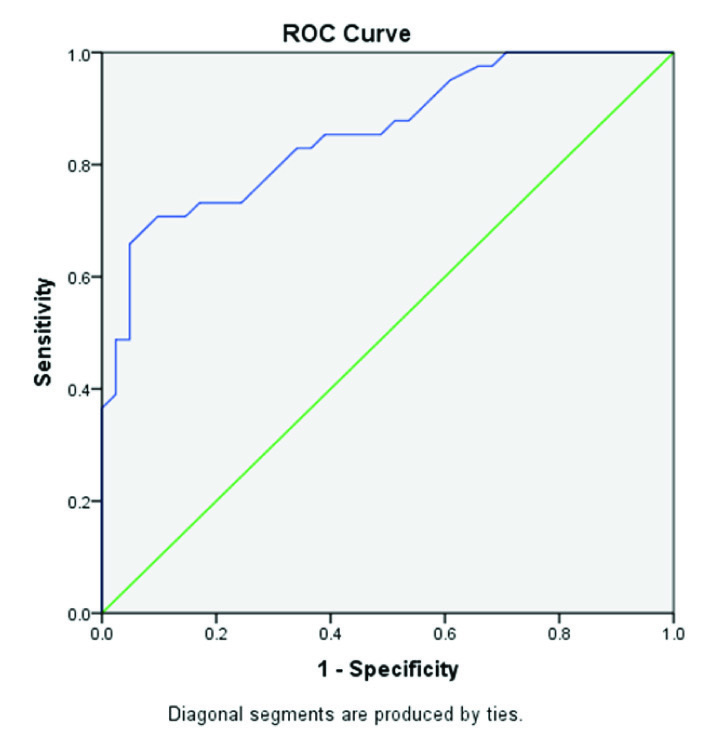
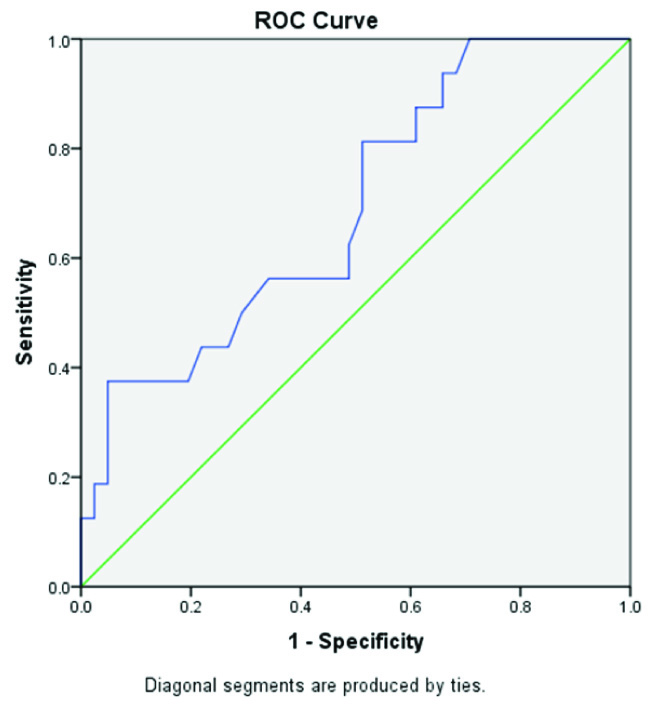
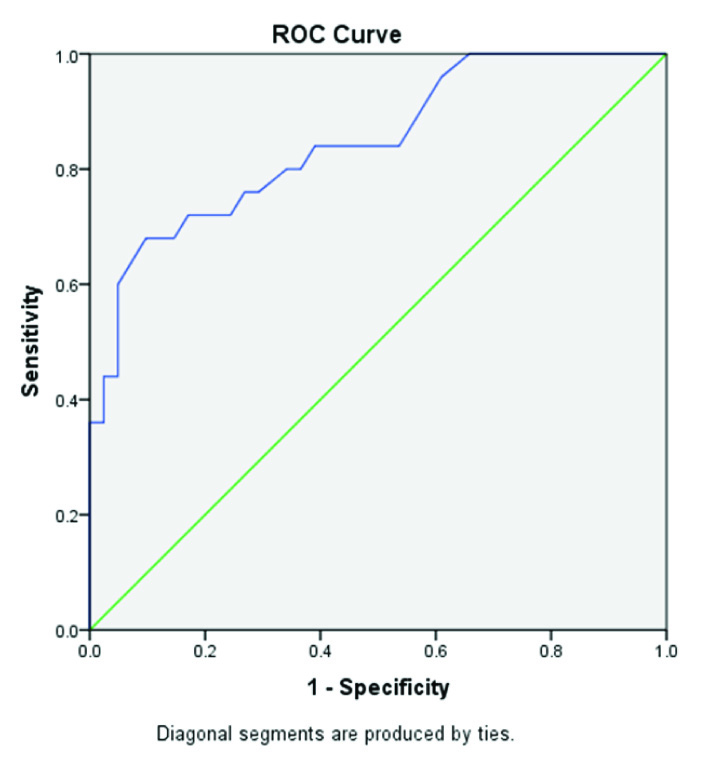
Receiver operator curve (ROC) analysis was done based on the direction of assessment. Osteocalcin was evaluated for prediction of cut-off values between: a) control group (postmenopausal females with normal BMD) and case group [Table/Fig-4]; b) between control group and osteopenia group [Table/Fig-5]; and c) between control group and osteoporosis group [Table/Fig-6] to find out the cutoff values. Regression analysis of ROC curve predicted a cutoff value of serum osteocalcin as18.22 ng/ml between control group and case group [Table/Fig-7], between controls and osteopenia group as >17.55ng/ml and between controls and osteoporotic group as >17.71ng/ml [Table/Fig-8]. The efficacy of cut-off values was then calculated. The efficacy of regressed cutoff values between controls and cases group gave an accuracy of 85.7% (sensitivity: 73.2%, specificity: 68%), between control and osteopenia subgroup was 69.1% (sensitivity: 56.3%, specificity: 65.9%) and between control and osteoporosis was 84.6% (sensitivity: 76.0%, specificity: 73.2%) [Table/Fig-8].
Showing ROC Curve between Control group and Case group
Showing ROC Curve between Control group and Osteopenia group
Showing ROC Curve between Control group and Osteoporosis group
Showing serum Osteocalcin levels in Controls and Cases and the proposed cutoff value
Showing efficacy of regressed cutoff value derived from ROC Curve analysis
| Efficacy of Regressed cut-off value | Accuracy | Sensitivity | Specificity |
|---|
| Control Vs Case | ≥ 18.2 ng/ml | 85.7% | 73.2% | 68.0% |
| Control Vs Osteopenia | >17.55ng/ml | 69.1% | 56.3% | 65.9% |
| Control Vs Osteoporosis | >17.71ng/ml | 84.6% | 76.0% | 73.2% |
Discussion
Osteoporosis is characterized by reduced bone mass with no change in ratio of mineralized to non-mineralized bone. The reduced bone mass and bone density is associated with an increase in bone fragility and risk of fractures. Osteoporosis is a generalized process affecting whole skeleton but some bones are more affected and are more likely to fracture than others. Trabecular bones show more bone loss than cortical bones and hence more likely to show osteoporosis and fragility fractures. Bone strength is dependent on bone mineral density (BMD), bone architecture and total bone mass. BMD accounts for 70 – 80% of torsion and compression strength of bone. Since, BMD is a major determining factor of bone strength and this can be measured accurately and reliably hence, diagnosis of osteoporosis is made on basis of BMD measurements along with clinical features. The risk of fractures in older people depends not only on bone density but also on other factors, such as postural instability, propensity to fall, impairment of muscle strength, neuromuscular co-ordination. Most of these factors increases with increasing age and a fracture may occur due to any one of these factors as may be also due to decreasing bone strength and hip geometry. Hence, even though DEXA scan is the most important investigation to assess BMD and to define osteoporosis but its role is limited to predicting individual diagnosis and monitoring treatment response. The role of BMD measurement as an epidemiological screening tool is not justified due to high cost of investigation, lack of access, poor sensitivity to detect future fractures and lack of availability at every medical centre [10]. To overcome these technical difficulties in diagnosing osteoporosis in a community setup various biochemical markers of bone formation and bone degradation have been investigated. Poor sensitivity and specificity of serum calcium, serum alkaline phosphatase and urinary hydroxyproline, the older biomarkers have been questioned regarding reliability to predict BMD and ability to monitor treatment response with antiresorptive medications. Serum osteocalcin has emerged as a promising bone formation biomarker to study postmenopausal osteoporosis. In this study, we have tried to assess the utility of serum osteocalcin, a bone formation biomarker as an epidemiological assessment tool to diagnose osteoporosis. This is the first study done to find the cut-off point of serum osteocalcin levels between normal population and bone mineral deficient subjects in the peri/post-menopausal age groups and to assess its efficacy in terms of accuracy, sensitivity and specificity.
In our study the height, weight and BMI of cases were slightly more than controls but were not statistically significant. Significant positive correlation of BMI and BMD has been reported in literature but our study failed to confirm this [11–15]. The reason might be because of non-significant difference between the weight of controls and cases.
The cases (post-menopausal females with low mineral density) were significantly older (p= 0.016) and the duration since menopause was greater (p= <0.001) than controls in our study. Case group showed significantly low serum calcium levels (p = 0.025) raised serum alkaline phosphatase (<0.001) and raised serum osteocalcin levels (<0.001). The positive correlation of age with alkaline phosphatase and negative correlation calcium levels is expected due to higher bone turnover in postmenopausal women and has been reported by other researchers also [16–18].
Serum osteocalcin levels were significantly higher in post-menopausal osteopenic (p< 0.005) and osteoporotic women (p< 0.001) and BMD at femoral neck and lumbar spine was significantly lower (p<0.001) than in women with normal BMD (p< 0.001) [Table/Fig-2]. This shows an inverse relationship of serum osteocalcin level and bone mineral density in present study. The inverse correlation of osteocalcin and BMD is well documented in literature [9,19–24].
Pearson’s correlation coefficient and power of correlation was tested between serum osteocalcin levels and other independent variables like age, alkaline phosphatase, calcium, BMI, years since menopause (YSM) and BMD. Analysis shows that age and YSM show significant correlation with moderate power of correlation [Table/Fig-3]. The BMI does not show a significant correlation with osteocalcin. Analysis of efficacy of suggested regressed cutoff values between controls and cases (≥ 18.2 ng/ml) shows a high accuracy (85.7%), sensitivity (73.2%) and specificity (68.0%) of the cutoff value. Similarly, the efficacy of cutoff value (>17.55 ng/ml) between normal post-menopausal women and post-menopausal osteopenic women shows accuracy (69.1%), sensitivity (56.3%) and specificity (65.9%) which are slightly low. But, the efficacy of cutoff value between normal post-menopausal women and osteoporotic women (>17.71 ng/ml) again shows high accuracy (84.6%), sensitivity (76.0%) and specificity (73.2%). This indicates that serum osteocalcin level is able to differentiate between post-menopausal women with normal BMD (controls) and post-menopausal women with low bone mass (women with BMD between -1 and -2.5 SD) or with osteoporosis (women with BMD below -2.5 SD). But, since the difference in osteocalcin levels of osteopenic women and osteoporotic women is not statistically significant (p=0.098) hence, osteocalcin levels alone cannot be taken as a tool to differentiate between osteopenia and osteoporosis. The standard values for postmenopausal women with normal BMD would be needed.
Role of BMD assessment in monitoring treatment response has been advocated and in practice now, but more recently a combination of serum osteocalcin levels and BMD assessment has been propagated by many researchers, as osteocalcin levels give a dynamic feedback on treatment response against static feedback given by BMD measurements [20,22,24].
We suggest that Serum osteocalcin level can be used as a screening purpose to detect low bone mass conditions (osteopenia and osteoporosis) in post-menopausal women. Only those subjects who show low bone mass/density as determined by raised serum osteocalcin levels may need DEXA scan for confirmation of osteoporosis before the start of treatment so that burden of DEXA scan in post-menopausal women decreases. Total cost of osteocalcin estimation is around 400 in Indian currency as compared to DEXA scan, which is about four times of osteocalcin estimation costs i.e. around 1600 in Indian currency. Moreover the samples can be collected from remote and relatively inaccessible area and transported to a laboratory for further processing in bigger centers.
The drawback of our suggestion is that the cutoff levels of osteocalcin levels have not been independently done, verified and standardized on a large scale population, yet. Also due to diurnal variation in osteocalcin levels the timing of sample collection can be a deterrent in its practical use. We suggest multicenter large scale studies, including both male and female subjects, to be done in general population before consensus on the use of serum osteocalcin levels for screening purpose for the diagnosis of osteoporosis and osteopenia.
Conclusion
Measurement of osteocalcin is accessible, inexpensive and easy. Serum osteocalcin level can be used as a screening tool in post-menopausal women and only subject having osteocalcin levels beyond cutoff point may further be advised DEXA scan to grade the severity of osteoporosis, if required.
**Correlation is significant at the 0.01 level (2-tailed)