The concentration of total proteins in urine is a good index of renal function. Several methods are available for the estimation of urinary total proteins including biuret assay [1–3], turbid metric methods using trichloroacetic acid (TCA) [4], sulfosalicylic acid (SSA) [5] or benzethonium chloride (BEC) [6] and protein dye-binding methods utilizing Co-omassie Brilliant Blue (CBB) [7,8] or Pyrogallol Red Molybdate (PRM) [9], but are found to give variable results. The turbid metric methods were found to have poor precision and sensitivity, limited linearity, and variable response to different proteins [10–12]. The dye binding methods have better precision, sensitivity and practicability, but also have variable response to different proteins [9,13,14].
Bicinchoninic acid (BCA) method is also used for the determination of proteins. This method combines the reduction of Cu2+ to Cu1+ by protein in alkaline medium with the colourimetric detection of Cu1+ using the reagent containing bicinchoninic acid. The purple coloured reaction product is formed by the chelation of two molecules of BCA with one cuprous ion [15]. This method is similar to Lowry method in having high sensitivity and low protein to protein variation [16]. However, the method was found to overestimate the urinary proteins due to the presence of interfering substances [17]. There have been very few specific studies to identify a robust method for measuring the total protein concentration in human urine samples [17–19] based on sound statistical principles to quantify ambiguity and avoid bias components in the analysis.
The comparison of two different analytical methods that measure the same analyte can be assessed by method comparison studies for agreement [20]. The PRM method for urine total proteins is being widely used in most of the hospitals because of its high sensitivity, better precision and its practicability. To the best of our knowledge there was no study comparing BCA method with the more commonly used PRM method in human urine samples. We hypothesize that both the methods are agreeable and hence, the present experimental investigation was carried out to compare the results of BCA method after removing the interfering components present in the human urine samples, with the results of PRM method and identify whether BCA method can be used as an alternative to the PRM method. This was done with an intention to identify and quantify imprecision and bias components in the urinary total protein analysis.
Materials and Methods
Urine samples
Fresh urine specimens from 36 patients who agreed to give the informed consent were collected from the Central laboratory, MediCiti Institute of Medical Sciences (MIMS), Ghanpur, Ranga Reddy district, Telangana, India, between July 2014 and October 2014 without preservatives covering a wide range of protein concentrations (urine dipstick: nil, trace, 1+, 2+ and ≥ 3+) for analysis of total proteins. All collections were approved by the Institution Ethics Review Board. They were centrifuged (2500 ×g for 10 min) and the supernatant was then subjected to analysis by the two methods.
Removal of interfering substances from urine
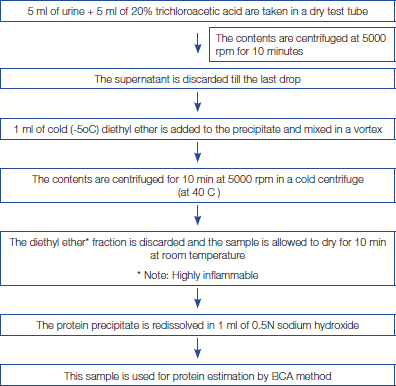
The proteins present in the urine were precipitated by tricholoroacetic acid 20% (w/v) and the interfering substances present in the supernatant were removed after centrifugation. The excess of TCA after protein precipitation was removed by adding diethyl ether. The precipitated protein was redissolved using 0.5N sodium hydroxide solution [Table/Fig-1] [21]. Alternatively, product No. 23215 (Related Thermo Scientific Pierce Protein Research Products) may be used for removal of interfering substances.
Removal of interfering substances from urine
Reagents
BCA protein assay kit (Product No. 23225) and Micro protein PRM kit were purchased from Thermo Scientific Pierce protein research products (Thermo Fisher Scientific, Rockford, IL, USA) and Euro Diagnostic Systems Pvt. Ltd., respectively. Urine dip stick strips were purchased from Euro diagnostic systems, India Pvt. Ltd.
Protein assays
Urine dipstick
The dipstick test for total proteins is based on the “protein error of indicators” phenomenon in which certain chemical indicators demonstrate one colour in the presence of protein and another in its absence. The reagent is most sensitive to albumin and less sensitive to globulins, Bence - Jones protein, mucoproteins and haemoglobin. The test procedure was performed as described by the manufacturer. The colour was read exactly after 60 seconds. Colours formed range from yellow for a negative reaction to yellow green and green to blue green for a positive reaction [22].
BCA protein assay
In this assay Cu2+ is reduced to Cu1+ by protein in alkaline medium [16,17]. Two molecules of BCA chelates to a cuprous ion resulting in the development of an intense purple colour with an absorbance maximum at 562nm. After the removal of interfering substances [Table/Fig-1] the assay procedure was performed as described by the manufacturer. BCA Reagent A consists of sodium carbonate, sodium bicarbonate, bicinchoninic acid and sodium tartrate in 0.1 M sodium hydroxide. BCA Reagent B consists of 4% cupric sulphate. Reagents A and B are stable at room temperature indefinitely.
Standard working reagent (SWR) was prepared freshly just before use by mixing 100 volumes of Reagent A with 2 volumes of Reagent B. (i.e., to 100 mL of Reagent A, 2 mL of Reagent B was added). SWR is apple green in colour. The standard assay procedure consists of mixing of 0.1mL of urine sample and protein calibrator, bovine serum albumin (BSA) 2 mg/mL with 2mL of SWR in a test tube. After incubation at 37°C for 30 min the tubes were cooled at room temperature and the absorbance was measured at 562 nm, against a reagent blank, using a double beam (UV-VIS) spectrophotometer (Systronics 2201, India). The concentration of unknown urinary protein was then determined from a plot of concentration vs. absorbance obtained for the standard protein solutions. The assay is linear up to 1000 μg/mL (= 1000 mg/L). The protein concentration above 1000 mg/dL was diluted and the value multiplied by the corresponding dilution factor.
The BCA Protein Assay has not been validated in any specific autoanalyser. The Microplate protocol may be compatible with automated pipetting systems. However, the protocol also requires a plate cover and incubation at 37°C for 30 minutes, so an incubator/ heat plate would need to be part of the system, as well as the plate reader to measure absorbance at 562nm.
Pyrogallol Red Molybdate dye-binding assay
The proteins in urine react with PRM dye reagent to form blue-purple colour complex with maximum absorbance at 600 nm. The assay procedure was performed as described by the manufacturer [23]. It consists of mixing of 20 μl of urine sample and protein calibrator, bovine serum albumin (BSA) 1000 mg/L with 1ml of micro protein PRM reagent and after incubation for 3 min at 37°C the absorbance of the assay mixture was measured at 600 nm against reagent blank within 30 min using a double beam (UV-VIS) spectrophotometer (Systronics 2201, India). The concentration of unknown urinary protein was then determined from a plot of concentration vs. absorbance obtained for the standard protein solutions. The method is linear up to 2000 mg/L. The protein concentration above 2000 mg/L was diluted and the value multiplied by the corresponding dilution factor. Unlike BCA method PRM method has been validated in most of the autoanalysers [9].
Specific performance characteristics of BCA method and PRM method
Measurement of Imprecision
Evaluation of a method begins with a precision study which estimates the random error associated with the method. It was determined by repeated analysis study and was calculated for 20 replicated measurements on standard solution of bovine serum albumin (100mg/dL) [24,25] on the same day in one run by both the methods as controls were not available for BCA method.
Measurement of Inaccuracy
Inaccuracy or bias was assessed by comparing the results of the patient’s urine samples by BCA method, after removal of interfering substances, with PRM. This comparison helps in estimating the systematic error in BCA assay and also identifies the type of systematic error (constant or proportional). We have analysed 36 fresh urine samples covering a wide range of protein concentrations (urine dipstick: nil, trace, 1+, 2+ and ≥ 3+) for urinary proteins by the two methods and the results have been compared.
Statistical Analysis
The data was entered in a MS excel database and later imported to MedCalc (MedCalc Software, 12.6.0 version, Belgium) for the analyses. Imprecision was reported in terms of coefficient of variation. For method comparison study initially correlation plots were used. Since correlation coefficient only measures the strength and direction of a relation between two methods, not the agreement between them, we employed Bland and Altman analysis [20] supplemented by Passing and Bablok regression analysis [26] to know the agreement between the two methods. They are used to identify if any systematic difference exists between the methods.
In Bland and Altman plots the difference and the average of urinary protein concentration (mg/L) by BCA and the PRM methods are plotted on the y axis and on the x axis respectively. The graph includes the mean of difference, 95% CI for the mean of difference, and the line of equality [20]. Passing and Bablok regression is a non-parametric test procedure without any assumptions regarding the distribution of the samples and the measurement errors [26]. It is non-sensitive to distribution of errors and data outliers. Here the results are presented with a scatter diagram with regression line and regression equation where the intercept and slope represents constant bias and proportional bias, respectively. The intercept A and slope B with their 95% confidence intervals were calculated. These confidence intervals are used to determine whether there is fixed bias or proportional bias [26]. The distribution of difference between both the methods around the fitted regression line can be revealed by the Residual plot which identifies the outliers and the non-linearity as well. Any significant deviation from linearity between the two sets of data was investigated using Cumulative sum linearity test. This method also provides the Residual standard deviation, which is a measure of random differences between the two methods; 95% of random differences are expected to lie in the interval of -1.96 RSD to +1.96 RSD.
Results
Measurement of Imprecision
Twenty replicate values of standard solution of BSA (100mg/dL) were analysed by BCA and PRM methods on the same day in one run and the coefficient of variation (mean/SD*100) was found to be 4.6% and 5.1% respectively.
Measurement of inaccuracy
As a first step, the results of 36 patient’s urine samples analysed by BCA method, after removal of interfering substances and PRM method were plotted on the graph and the Pearson correlation coefficient, r was observed to be 0.93 (p < 0.0001) [Table/Fig-2], which indicates a good correlation between the two methods.
Comparison of urinary proteins by BCA & PRM methods: Correlation plot

In Bland and Altman analysis [Table/Fig-3], we observed a bias (mean of difference) of 0.3, and the line of equality was within the 95 % confidence limit (CI) of the mean of difference, suggesting that there is no significant systematic difference between both the methods. In Passing and Bablok regression analysis [Table/Fig-4,5] the mean (SD) concentration of urinary proteins by PRM and BCA methods are 802.1 (911.9) and 799.1 (882.5) mg/L respectively. As the 95 % CI for the intercept (-9.47 to 3.30) and the slope (0.89 to 1.16) includes zero and one [Table/Fig-4] it can be concluded that there is no significant constant and proportional bias respectively between both the methods indicating good agreement. Residual plot [Table/Fig-6] and cumulative sum linearity test indicates no significant deviation from linearity (p = 0.96). The Residual standard deviation, ± 1.96 RSD (34.45, -67.53 to 67.53) indicate that 95% of random differences are within this interval emphasizing that the two methods are in good agreement.
Bland & Altman plot of urinary proteins. Difference of BCA & PRM methods vs. average of BCA & PRM methods

Outcome of Passing and Bablok regression analysis.
| Regression Equation: y = -1.84 + 1.03 x |
|---|
| Intercept A | 95% CI | Fixed bias or constant bias | Slope B | 95% CI | Proportional bias |
|---|
| -1.84 | -9.47 to 3.30 | No | 1.03 | 0.89 to 1.16 | No |
Passing and Bablok regression analyses of BCA & PRM methods for urinary proteins
Scatter diagram with regression line and confidence bands for regression line

Passing and Bablok regression analyses of BCA & PRM methods for urinary proteins
Residual plot of distribution of difference around the fitted regression line

Discussion
In this study, BCA method was compared for the analysis of total urinary proteins in human urine samples, after removal of interfering components of the urine, with PRM for its precision and accuracy. There was a good correlation and no significant systematic bias (constant and proportional bias) between both the methods as analysed by Bland and Altman and Passing and Bablok regression analysis [20,26].
The normal total protein concentration in urine has been observed to be 1-14 mg/dl or less than 100 mg/day [22]. However, it is found to have several interfering substances. Unlike Lowry’s method [27], BCA method has several advantages: it has more tolerance towards certain interfering substances; greater reagent stability; high sensitivity [16,17]. Nevertheless, it is observed in the present study that the protein values are high by BCA method but not by PRM method before removal of interfering substances. Also, in this study the protein values by PRM method before removal of interfering substances were correlating well with the dipstick method unlike BCA method. The removal of the interfering substances by following the protocol, mentioned in [Table/Fig-1], drastically improved the BCA test method and the results were comparable with PRM method which is rapid, simple and can readily be automated. Also, prior studies [18] have reported BCA method to be superior to Lowry and Bradford assays (Bland Altman bias: 0.08) for analysis on unprocessed human urine samples.
Conclusion
In conclusion, our results indicate that the BCA method overestimates the urinary protein concentration but if the urine sample is subjected to removal of interfering substances the results are comparable to the PRM method. Hence, BCA can be used as an alternative method to PRM. Though BCA method takes longer time for the test procedure than PRM method it can be recommended for routine use due to accuracy of the results. The major drawback of the procedure is that only one concentration of the BSA standard was used, which can hamper the quality of the results. It can be taken as a preliminary report only. Hence, further studies are needed to compare the results of both the methods for urine proteins at higher concentrations and also testing the repeatability using standards at different concentrations.