Malocclusion which is in dormant condition in the deciduous or mixed dentition period usually, surfaces after the eruption of permanent successors. A majority of children will be benefited if such developing malocclusion can be diagnosed and treated early. One of the orthodontic problems observed in the mixed dentition phase is related to arch length and tooth size discrepancy. In order to identify such space discrepancies different methods of mixed dentition space analyses have been introduced. These analyses predict the mesiodistal width of the unerrupted premolars and canines and the amount of space available in the dental arch for the alignment of the succedaneous teeth.
Space analysis in the mixed dentition is an important aspect of orthodontic diagnosis and treatment planning. The purpose of a mixed dentition analysis is to evaluate the amount of space available in the arch for the succeeding permanent teeth and occlusal adjustment [1]. Different methods of predicting the sizes of permanent canines and premolars have been published [2]. Early attempts of estimating tooth sizes by G.V. Black and others were based on tables of average mesiodistal width [3–5]. Other methods of prediction were based on estimating the size of permanent teeth on radiographs alone or in combination with crown diameters measured on dental casts [5–8]. One method that is widely used correlates the mesiodistal crown diameters of erupted mandibular permanent incisors as the predictor for the size of unerupted canines and premolars [9].
Among the different methods available Moyer’s mixed dentition analysis is probably the most widely used. Moyer’s probability tables were developed from studies conducted on Caucasian population [10–14]. This is a correlative method that uses the combined mesiodistal widths of the erupted mandibular permanent incisors to predict the mesiodistal widths of the unerupted canines and premolars with the use of a prediction chart that has been prepared. Moyer’s has also suggested that the seventy-fifth percentile readings on the prediction chart be taken as the most applicable value. However, the applicability of these tables to other ethnic groups has been studied and found wanting [15,16]. It has also been well established in the literature that mesiodistal widths of teeth vary considerably between different racial groups [17–19]. Sexual dimorphism has also been confirmed in several studies [20,21].
The objectives of this study were to test the reliability of moyer’s mixed dentition analysis and to produce new regression equation for Bangalore population sample, which would help to estimate the mesiodistal widths of the unerupted permanent successors.
Materials and Methods
The study was conducted in the Department of Pediatric and Preventive Dentistry, Bangalore (March - August 2014 Six Months) and sample comprised of 400 school children (200 boys and 200 girls) of Bangalore, India in the age group of 13-16 years whose mother tongue was Kannada. Bangalore was divided into north and south, from which two schools were randomly selected from each zone. From these schools, 200 children from north Bangalore and 200 children from south Bangalore were selected by stratified random sampling. Questions were asked regarding numbers of years of stay (min of 10years) in Bangalore as per the guidelines of Bangalore Tashildhar Administrative system to issue domicile certificate along with Kannada as their mother tongue.
Selection Criteria
1. The children should be in the age group of 13-16 years. 2. All the permanent teeth should be present in each arch and fully erupted (with the exception of third molars).3. Permanent teeth should be caries free. 4. No more than minor malocclusion or mild crowding or spacing should be present. 5. Children with congenital craniofacial anomalies or previous history of orthodontics were excluded. 6. Children with restorations or significant attrition were excluded.
Impressions of maxillary and mandibular arches were made of the selected children with alginate impression material. Study models were then prepared carefully using dental stone plaster. A standardized method was used to measure the mesiodistal crown widths [22]. The greatest mesiodistal crown width of each tooth was measured between its contact points, with the caliper placed parallel to the occlusal and vestibular surfaces. This method was reported to be highly accurate for measuring mesiodistal crown widths [23]. Measurements of the mesiodistal widths of mandibular incisors, maxillary and mandibular canines and premolars were made with the help of Vernier gauge calipers calibrated to 0.01 of a millimeter. Measurement reliability was checked according to a method suggested by Lundstorm, where a single investigator does all the measurements after carefully marking the maximum mesiodistal width on the teeth to be measured and then re-measures certain randomly selected casts [11]. The coefficient of test reliability on 40 such randomly selected casts (each 10th cast was selected) was calculated. R-value was 0.97 hence reliability confirmed.
The sum of the mesiodistal measurements of the following groups of teeth was pooled and the means were calculated: the four mandibular incisors, the mandibular canines and premolars, the maxillary canines and premolars in each quadrant. These data were then used to develop regression equation that could be used clinically for the prediction of tooth sizes in local ethnic population. Statistical analysis was done by using software.
Statistical Analysis
The data collected was subjected to statistical analysis using SPSS (statistical package for social sciences) software version 22.
Results
The results of the present study are presented as follows.
[Table/Fig-1]: Descriptive statistics for summation of upper canine and premolars diameters (UCPM), summations of lower canine and premolars diameters (LCPM), and summation of lower incisors mesiodistal diameters (LI) are presented in [Table/Fig-1] for the sexes, males and females separately. The canine premolar segment in both arches is statistically larger in men than in women (p<0.05).
Descriptive statistics for UCPM, LCPM, and LI
| Groups of teeth | Male | Female |
|---|
| Mean ± SD | Mean ± SD |
|---|
| Lower Incisors | 23.87 ± 2.15 | 23.51 ± 1.43 |
| LCPM | 21.36 ± 0.63 | 21.18 ± 0.95 |
| UCPM | 21.89 ± 0.89 | 21.82 ± 0.90 |
[Table/Fig-2]: There were significant differences (all p<0.05 except for means of upper) for t-tests comparing the means of males with females for summations of mandibular incisors and maxillary and mandibular canines and premolars width, males having the larger values.
Shows t-test for independent samples
| Independent Samples Test | t-test for Equality of Means |
|---|
| t | df | sig |
|---|
| Comb. M-D width of lower incisors | 1.922 | 346.394 | .055• |
| mean lower | 2.291 | 346.571 | .023• |
| mean upper | .777 | 397.958 | .438• |
• p<0.05
[Table/Fig-3]: Correlation coefficient and equations of prediction were derived from the data collected. [Table/Fig-3] shows correlation coefficients (r) between LI and canines and premolars for males and females, the regressions values of ‘a’ and ‘b’ in the standard linear regression equation (Y=a+b.x), the SEE, and the r square of the maxillary and mandibular regression equation.
Regression parameter for prediction of M-D widths
| Variables | X | Sex | N | Constant (a) | p(a) | Constant (b) | p(b) | r2 | SEE | r |
|---|
| UCPM | LI | M | 200 | 16.904 | <0.01 | 0.209 | <0.01 | 0.254 | 0.773 | 0.504 |
| UCPM | LI | F | 200 | 15.627 | <0.01 | 0.263 | <0.01 | 0.175 | 0.821 | 0.419 |
| LCPM | LI | M | 200 | 17.204 | <0.01 | 0.174 | <0.01 | 0.352 | 0.511 | 0.593 |
| LCPM | LI | F | 200 | 13.431 | <0.01 | 0.330 | <0.01 | 0.247 | 0.827 | 0.497 |
The correlation between the mesiodistal width of erupted mandibular incisors and mesiodistal width of erupted canines and premolars showed a fair correlation.
The correlation coefficients between the independent variable (LI) and the dependent variables were 0.50(for UCPM) and 0.59(for LCPM) in males and 0.41 and 0.49, respectively, in females. The correlation coefficients ranged from 0.41 to 0.59 with the coefficients higher in men. In order to assess the effect of sex on the regressions, the combined diameters of the canines and premolars were first regressed on combined lower incisor diameters and sex using a general linear model procedure. The p-value associated with sex was found to be less than 0.01. Hence simple linear regressions were performed with the sexes separated. All four-regression models were statistically significant.
The coefficients of determination (r2) explained the portion of variability of the dependent variable that could be explained by the variability of the independent variable. The r2 values ranged from 17% in females to 35%, with the figures in males consistently better than those for the females. The standard errors of estimate ranged from 0.511mm to 0.827 with the errors smaller in males. The values of coefficients ‘b’ ranged from 0.174 to 0.330 and significant at p<0.01. The values of coefficient ‘a’ ranged from 13.431 to 17.204 and significant at p<0.01.
Linear regression equations, based on the dental measurements of 200 males and 200 females, were developed for predicting the sum of the mesiodistal widths of unerupted canine and premolar segments for both maxillary and mandibular dental arches during the mixed dentition period for the population of study sample.
The following are the equations in this study for prediction:
The equation is Y = a+b.(x)
For LCPM width
Y= 17.204+0.174.(x)–Males
Y= 13.431+0.330.(x)–Females
For UCPM width
Y=16.904+0.209.(x)–Males
Y=15.627+0.263.(x)–Females
Probability tables (males and female) for Bangalore population is derived.
[Table/Fig-4]: Showing Probability tables for Males.
Prediction table for Bangalore Boys (mm)
| Sum of L I | LCPM | UCPM |
|---|
| 19 | 20.51 | 20.88 |
| 19.5 | 20.60 | 20.98 |
| 20 | 20.68 | 21.08 |
| 20.5 | 20.77 | 21.19 |
| 21 | 20.86 | 21.29 |
| 21.5 | 20.95 | 21.40 |
| 22 | 21.03 | 21.50 |
| 22.5 | 21.12 | 21.61 |
| 23 | 21.21 | 21.71 |
| 23.5 | 21.29 | 21.82 |
| 24 | 21.38 | 21.92 |
| 24.5 | 21.47 | 22.02 |
| 25 | 21.55 | 22.13 |
| 25.5 | 21.64 | 22.23 |
| 26 | 21.73 | 22.34 |
| 26.5 | 21.82 | 22.44 |
| 27 | 21.90 | 22.55 |
| 27.5 | 21.99 | 22.65 |
| 28 | 22.08 | 22.76 |
| 28.5 | 22.16 | 22.86 |
| 29 | 22.25 | 22.97 |
• p<0.05
[Table/Fig-5]: Depicting Probability tables for Females.
Prediction table for Bangalore Girls (mm)
| Sum of L I | LCPM | UCPM |
|---|
| 19 | 19.70 | 20.62 |
| 19.5 | 19.87 | 20.76 |
| 20 | 20.03 | 20.89 |
| 20.5 | 20.20 | 21.02 |
| 21 | 20.36 | 21.15 |
| 21.5 | 20.53 | 21.28 |
| 22 | 20.69 | 21.41 |
| 22.5 | 20.86 | 21.54 |
| 23 | 21.02 | 21.68 |
| 23.5 | 21.19 | 21.81 |
| 24 | 21.35 | 21.94 |
| 24.5 | 21.52 | 22.07 |
| 25 | 21.68 | 22.20 |
| 25.5 | 21.85 | 22.33 |
| 26 | 22.01 | 22.47 |
| 26.5 | 22.18 | 22.60 |
| 27 | 22.34 | 22.73 |
| 27.5 | 22.51 | 22.86 |
| 28 | 22.67 | 22.99 |
| 28.5 | 22.84 | 23.12 |
| 29 | 23 | 23.25 |
The accuracy of the prediction equations has been checked by using the following method. Standard Deviation of the differences and the absolute error of mean have been calculated by obtaining the predicted measurements independently for Moyer’s LCPM & UCPM with values ranging from 19-29mm with absolute interval of 0.5mm. The values obtained by the above method using prediction equations and by actual measurements of the dental casts are almost in agreement.
[Table/Fig-6]: Showing Standard Deviation and Absolute Mean Error
Standard Deviation and Absolute SE
| Estimation of SD & Absolute SE of mean for prediction equations |
|---|
| Variable | Sex | N | Mean | SD | SE of Mean |
|---|
| Sum of Lower Incisors | Males | 21 | 24.00 | 3.10 | 0.68 |
| Females | 21 | 24.00 | 3.10 | 0.68 |
| Moyers LCPM | Males | 21 | 21.38 | 0.54 | 0.12 |
| Females | 21 | 21.35 | 1.02 | 0.22 |
| Moyers UCPM | Males | 21 | 21.92 | 0.65 | 0.14 |
| Females | 21 | 21.94 | 0.82 | 0.18 |
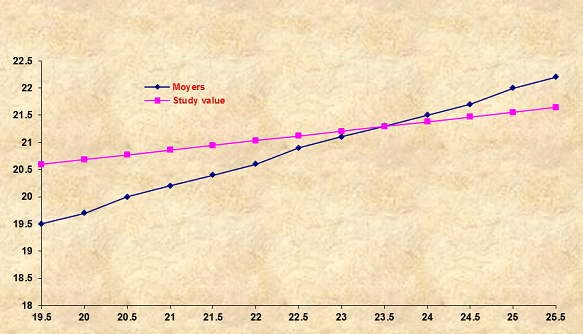
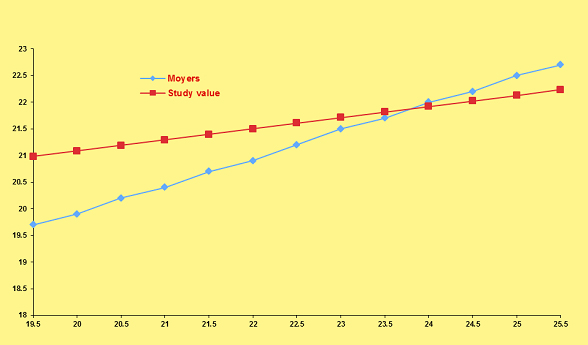
Graphically when comparing Moyer’s tables and the new probability tables at the 50% probability level for males [Table/Fig-7,8] in the maxilla and mandible, the slopes from the lines connecting the predicted data are crossing over. As the slopes of the two sets of predicted data differ, the lines tend to cross each other. This implies that if the sum of the lower incisors is less than 23.5mm, the predicted size for canines and premolars is smaller for Bangalore subjects as predicted by Moyer’s tables. The tooth sizes for males fall in a high range. The male subject’s canines and premolars are approximately 1mm larger per quadrant than predicted by the Moyer’s probability tables.
A graph to compare the predicted values of unerrupted mandibular canines and premolar as calculated from the Moyer’s tables and the new proposed probability tables for Bangalore subjects at the 50% probability for male
A graph to compare the predicted values of unerupted maxillary canines and premolar as calculated from the Moyer’s tables and the new proposed probability tables for Bangalore subjects at the 50% probability for males
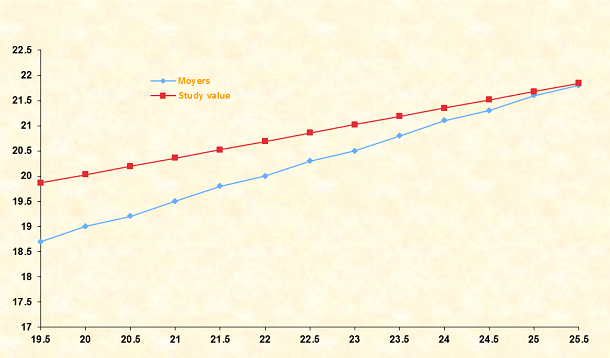
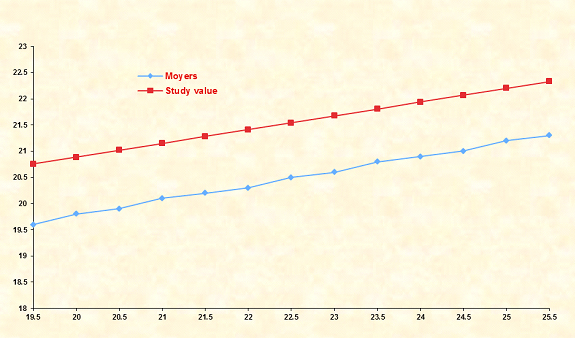
Graphically when comparing Moyer’s tables and the new probability tables at the 50% probability level for females [Table/Fig-9,10] in the maxilla and mandible, the sizes of canines and premolars of the Bangalore subjects are larger than those predicted by the Moyers tables. The difference is approximately 1mm per quadrant.
A graph to compare the predicted values of unerrupted mandibular canines and premolar as calculated from the Moyer’s tables and the new proposed probability tables for Bangalore subjects at the 50% probability for females
A graph to compare the predicted values of unerupted maxillary canines and premolar as calculated from the Moyer’s tables and the new proposed probability tables for Bangalore subjects at the 50% probability for females
Discussion
This study was done to assess the reliability of the Moyer’s prediction chart as well as to generate a regression equation suitable for the local ethnic Kannada speaking population. In order to ensure the reliability of the data a sufficiently large sample size was taken (n=400), they were aged between 13 to 16 years. This was a longitudinal study that assessed the tooth size correlation between lower incisors and the posterior segments.
Definite racial and ethnic differences in tooth size have been emphasized in several studies [18,21,24–27]. The prediction tables formulated at the University of Michigan, which are based on data derived from population of Northern European descent, is neither accurate nor applicable when applied to a population of different ethnic origin.
Multiple regression analyses have indicated that the sum of the mesiodistal width of the four mandibular permanent incisors is the best predictors for unerupted canines and premolars [28–30]. Fortunately these are the teeth that are among the first to erupt during the early mixed dentition. It is the ease of Moyer tables that makes them clinically attractive and popular and an effective method to predict the mesiodistal dimensions of unerupted maxillary and mandibular canines and premolars.
The predicted sum of the mesiodistal widths of unerupted canines and premolars can be read at the probability level of the practitioner choice. The 75% percentile level is recommended by Moyer’s and generally used. This means that in 75% of cases, the unerupted canines and premolars will be at the predicted value or less [31].
The correlation between the mesiodistal width of erupted mandibular incisors and mesiodistal width of erupted canines and premolars showed a fair correlation. Realizing the importance of diagnosing the arch size to tooth size discrepancy at an early stage, many investigators have formulated criteria for predicting the size of unerupted permanent teeth [32–34].
Nance, Ballard and Wylie and Moyers [4,10,28] used the mesiodistal width of erupted permanent mandibular incisors for the prediction of the mesiodistal width of unerupted canines and premolars. Moyers prediction tables were mainly formulated for the American Whites and he chose the 75% level of probability since it was most practical from the clinician stand point. Moyers sample has not been characterized in the literature. While applying Moyers prediction tables to a section of the south Indian population, Rani and Goel [25] found it to be more applicable at the 35% level instead of 75% as observed by Moyers for his sample [28]. Priya and Munshi formulated a prediction chart for mixed dentition analysis [35], Aggrawal and chopra [36] formulated their own prediction tables and graphs for a section of the North Indian population. The present study showed that 50% probability is more applicable for boys and 75% for girls. Since the literature is lacking in the formulation of such regression equation for its own population, keeping in view the racial, geographic and other differences from those of the Americans, the present study attempted to formulate a regression equation for the children of Bangalore.
The mesiodistal crown dimensions of the teeth for men and women from various studies in both arches are presented in [Table/Fig-11]. The combined mesiodistal crown diameters of the canine and premolar segments and the mandibular incisors seemed relatively smaller than those of black South Africans [18], whose teeth are the largest of all groups, but comparable to those African Americans, Thai [26], and Hong Kong Chinese groups [2]. Definite racial and ethnic differences in tooth size have been emphasized in several studies. Descriptive statistics also showed that the mesiodistal diameters of the mandibular incisors and the maxillary and mandibular canine and premolar segments were greater in men than in women (p<0.05). Significant sexual dimorphism has also been noted in other studies [27,37,38].
Summation of M-D widths of mandibular incisors and maxillary and mandibular canine premolar segments from various studies
SD-Standard deviation; M-male; F-female
| Study | Sex | Sample (n) | Arch | Mean(mm) | SD(mm) |
|---|
| Jaroontham and Godfrey (Thai) [26] | M | 215 | LI | 23.89 | 1.37 |
| UCPM | 23.31 | 1.03 |
| LCPM | 23.16 | 1.04 |
| F | 215 | LI | 23.23 | 1.26 |
| UCPM | 21.77 | 1.02 |
| LCPM | 22.64 | 1.00 |
| Schirmer and Wiltshire (South African) [18] | M | 50 | LI | 23.92 | 1.90 |
| UCPM | 23.45 | 1.37 |
| LCPM | 23.22 | 1.11 |
| F | 50 | LI | 23.66 | 1.59 |
| UCPM | 22.20 | 1.24 |
| LCPM | 22.28 | 1.28 |
| Frankel and Benz (Black American) [15] | M | 39 | LI | 23.06 | 1.59 |
| UCPM | 22.57 | 1.45 |
| LCPM | 22.53 | 1.30 |
| F | 41 | LI | 22.94 | 1.28 |
| UCPM | 21.58 | 0.94 |
| LCPM | 21.78 | 0.83 |
| Yuen et al (Hong Kong Chinese) [2] | M | 51 | LI | 23.15 | 1.25 |
| UCPM | 22.30 | 0.39 |
| LCPM | 23.37 | 1.10 |
| F | 46 | LI | 23.28 | 1.22 |
| UCPM | 21.58 | 1.16 |
| LCPM | 22.67 | 1.09 |
| Present Study (Bangalore) | M | 200 | LI | 23.87 | 2.15 |
| UCPM | 21.89 | 0.89 |
| LCPM | 21.36 | 0.63 |
| F | 200 | LI | 23.51 | 1.43 |
| UCPM | 21.82 | 0.90 |
| LCPM | 21.18 | 0.95 |
[Table/Fig-12] shows r-values for the buccal segments of each arch, constants ‘a’ and ‘b’, the SEE, and the r2 of the maxillary and the mandibular regression equations from different investigations. The correlation coefficients for the Bangalore subjects between the buccal segments of each arch and the mandibular incisors were found to be smaller than for Hong Kong Chinese and the Thai population.
Regression parameters from various investigations
| Study | Sex | Arch(y) | r | Constant a | Constant a | SEE(mm) | R2 |
|---|
| Jaroontham and Godfrey (Thai) [26] | M | Mandible | 0.58 | 11.92 | 0.43 | 0.85 | 0.34 |
| Maxilla | 0.54 | 13.36 | 0.41 | 0.88 | 0.29 |
| F | Mandible | 0.65 | 9.49 | 0.53 | 0.78 | 0.42 |
| Maxilla | 0.62 | 11.16 | 0.49 | 0.78 | 0.39 |
| M+F | Mandible | 0.64 | 10.30 | 0.50 | 0.82 | 0.41 |
| Maxilla | 0.60 | 11.87 | 0.47 | 0.84 | 0.36 |
| Furguson et al., (Negro) [16] | M+F | Mandible | 0.62 | 11.93 | 0.44 | | 0.38 |
| Maxilla | 0.70 | 9.93 | 0.52 | | 0.49 |
| M | Mandible | 0.72 | 9.15 | 0.58 | 0.92 | 0.51 |
| Maxilla | 0.79 | 5.97 | 0.72 | 0.91 | 0.62 |
| Frankel and Benz (Black Americans) [15] | F | Mandible | 0.61 | 12.83 | 0.39 | 0.67 | 0.37 |
| Maxilla | 0.70 | 10.34 | 0.49 | 0.70 | 0.43 |
| M+F | Mandible | 0.65 | 10.18 | 0.52 | 0.87 | 0.42 |
| Maxilla | 0.70 | 8.30 | 0.64 | 0.94 | 0.49 |
| Yuen et al (Hong Kong Chinese) [2] | M | Mandible | 0.79 | 7.97 | 0.66 | 0.68 | 0.62 |
| Maxilla | 0.77 | 8.82 | 0.58 | 0.61 | 0.60 |
| F | Mandible | 0.65 | 8.30 | 0.61 | 0.81 | 0.42 |
| Maxilla | 0.69 | 6.66 | 0.64 | 0.82 | 0.47 |
| Al Khadra (Saudi Arab) [27] | M+F | Mandible | 0.65 | 7.20 | 0.63 | | 0.42 |
| Maxilla | | 8.60 | 0.55 | | 0.49 |
| Present study (Bangalore) | M | Mandible | 0.59 | 17.20 | 0.17 | 0.51 | 0.35 |
| Maxilla | 0.50 | 16.90 | 0.20 | 0.77 | 0.25 |
| F | Mandible | 0.49 | 13.43 | 0.33 | 0.82 | 0.24 |
| Maxilla | 0.41 | 15.62 | 0.26 | 0.82 | 0.17 |
Relative comparison of regression parameters from different studies showed the regression parameter ‘a’ is comparatively greater than other studies. This study showed greatest (17.20) and the least (13.43) constant ‘a’ values in the mandible in females.
The r2 values are the indicators of predictive accuracy of the regression equations. This study showed lesser r2 values for both the arches than Thai population and Hong Kong Chinese.
The SEE indicate the error in use of prediction equations. In this study the SEE ranged from (0.51 to 0.82) comparatively lower than the findings of other investigations.
Predicted values from the new proposed probability tables for Bangalore subjects indicate that the mesiodistal tooth sizes of canines and premolars are larger than those of incisors. Merz et al., in their study also found similar results [39]. It is recommended that the proposed regression equation be considered for Bangalore subjects because the Moyers prediction tables may adversely affect the space assessment in our population. Permanent teeth may be either inappropriately retained or extracted on the basis of such an inaccurate tooth width prediction.
Conclusion
Significant sexual dimorphism in tooth sizes exists in this study sample. In this study it was found that 50% probability level is more applicable to boys and 75% probability level to girls than the Moyer’s probability table. As the regression equation was formulated based on data from Bangalore population, it should be accurate when applied to local children. The derived regression equation is very convenient to use; also probability tables for the local Bangalore population is derived using this regression equation.
Abbreviations Used in This Study
UCPM- Combined mesiodistal crown diameters of upper permanent canine, first and second premolars on one side of the arch. LCPM- Combined mesiodistal crown diameters of lower permanent canine, first and second premolars on one side of the arch. LII- Combined mesiodistal crown diameters of the four lower permanent incisors.
• p<0.05