Right Dorsolateral Frontal Lobe N-Acetyl Aspartate and Myoinositol Concentration Estimation in Type 2 Diabetes with Magnetic Resonance Spectroscopy
Rajani Santhakumari Nagothu1, Yogananda Indla Reddy2, Archana Rajagopalan3, Ravi Varma4
1 Assistant Professor, Department of Physiology, MediCiti Institute of Medical Sciences, Hyderabad, India.
2 Associate Professor, Department of Physiology, MediCiti Institute of Medical Sciences, Hyderabad, India.
3 Professor, Department of Physiology, Saveetha Medical college, Chennai, India.
4 Professor, Department of Radiology, MediCiti Institute of Medical Sciences, Hyderabad, India.
NAME, ADDRESS, E-MAIL ID OF THE CORRESPONDING AUTHOR: Dr. Yogananda Reddy, Associate Professor, Department of Physiology, MediCiti Institute of Medical Sciences, Hyderabad-5014011, India. E-mail : Yoga4udotcom@yahoo.co.in
Introduction
Chronic hyperglycaemia in type 2 diabetes, effects the central nervous system by altering the concentrations of brain metabolites like N-acetyl aspartate (NAA) and myoinositol (mI), which are indicators of neuronal integrity and glial cell damage respectively. Dorsolateral frontal lobe is associated with aspects of cognition especially right frontal lobe is involved in episodic memory retrieval, ninety percent of the diabetic cases are type 2 in nature globally and yoga is very effective in stabilizing the brain metabolites by bringing the blood glucose levels to near or within the physiological range in type 2 diabetes.
Aim and Objectives
The aim of the study was to observe the effects of yogasana and pranayama on glycosilated haemoglobin (HbA1c) levels and right dorsolateral frontal cortical NAA and mI concentration in type 2 diabetic subjects.
Materials and Methods
It’s a case control study. Sixty eight type 2 diabetic subjects of both the sex, aged between 35-65 years are included in the study, subjects are divided in to test and control group 34 each. Test group subjects did the yogasana and pranayama for a period of 6 months, 6 days in a week, 45-60 minutes daily under the supervision of a qualified yoga teacher. Control group subjects are not on any specific exercise regimen. Both the group subjects are taking oral hypoglycaemic agents. HbA1c levels are measured using the Bio-Rad D-10™ haemoglobin A1c program and Magnetic Resonance Spectroscopy (MRS) is used in assessing the metabolite concentrations.
Statistical analysis
Analysis of data was done by using unpaired t-test. P-value for HbA1c level is <0.001, which is highly significant statistically. P-value for NAA was < 0.02 and for myoinositol was < 0.01, which are statistically significant.
Results
HbA1c levels in control and test group subjects are 7.7 ± 1.84 and 6.02 ± 0.46 respectively. NAA concentrations in the right dorsolateral frontal lobe of control and test group are 1.44 ± 0.15 and 1.54 ± 0.19 respectively. The mI concentrations in the right dorsolateral frontal lobe of control and test group are 0.61 ± 0.22 and 0.47 ± 0.24 respectively.
Conclusion
Yogasana and pranayama minimized the neuronal and glial cellular damage in test group, which is evident by minimal changes in right dorsolateral frontal lobe NAA and mI levels in type 2 diabetic subjects.
Frontal lobe, Glycosilated haemoglobin, Yogasana and pranayama
Introduction
Globally 387 million people are suffering with diabetes out of which 90% of the cases are type 2 diabetic in nature, it is expected that 592 million people are going to suffer with diabetes by 2035 [1]. Type 2 diabetes mellitus is the result of non-responsiveness by the peripheral tissues to the secreted insulin or by the decreased secretion of insulin from the β cells of pancreas and the aetiological factor for type 2 diabetes is mainly obesity [2]. Reduced frontal lobe volumes are observed in obese type 2 adolescents [3]. Type 2 diabetes affects the functioning of central nervous system (cognition) by altering the brain metabolite concentrations [4]. Regular yogasana and pranayama enhances the functioning of central nervous system (cognition) [5]. Magnetic resonance spectroscopy (MRS) enables the identification and quantification of metabolites in given sample [6]. As frontal lobe is involved in executive functions and working memory, we are interested in finding, how the N-acetyl aspartate (NAA) & myoinositol (mI) concentrations are altered in the right dorsolateral frontal lobe of type 2 diabetic subjects and also to observe the effects of yogasana and pranayama on these metabolite concentrations. Change in the metabolite concentrations in the right dorsolateral frontal lobe will affect the memory [7,8]. Glycosilated haemoglobin (HbA1c) concentration is related to the development of complications and it reflects the mean plasma glucose levels over the last 2-3 months and has a minimum effect from the drugs that are influencing the glucose metabolism [9]. Absence or decreased concentration of N-acetyl aspartate (NAA) is a sign of neuronal loss or degradation [6,10] and it might reflect intrinsic imbalance between excitatory versus inhibitory neurons [11].
Increased myoinositol (mI) concentration is observed with proliferation of glial cells or with increased glial-cell size, as found in inflammation [6]. Blood glucose levels will be elevated in type 2 diabetes [12]. In type 2 diabetic subjects, increased blood glucose levels will also increase the brain glucose levels and increased brain glucose levels will alter the brain metabolite concentrations [13]. The study is aimed to observe the HbA1c levels, NAA and mI concentrations in right dorsolateral frontal lobe in type 2 diabetic subjects who did the yogasana and pranayama and to compare the same with diabetic controls.
Materials and Methods
The present study was approved by the Institutional Ethical Committee.
Inclusion criteria: Type 2 diabetes patients, both the sex are included, minimum duration of diabetes is 2 years, age between 35-65 years were included in the study.
Exclusion criteria: Smokers, alcohol consumers, any neuro-psychological disorders, recent history of major surgeries & those who are on insulin treatment were excluded. Sixty eight type 2 diabetic subjects were recruited in this study after taking the written informed consent. Thirty four type 2 diabetic test group subjects did the yogasana and pranayama for 6 months, 6 days in a week, for a period of 45-60 minutes daily under the supervision of a qualified yoga expert in Yogi Vemana Yoga Research Institute in Hyderabad. Age and sex matched 34 type 2 diabetic subjects, who are not on any specific exercise regimen were included in the study as control group. Test group subjects did a set of yogasana followed by a set of pranayama which are listed in detail in [Table/Fig-1,2] respectively. Both the control and test group subjects are on oral hypoglycaemic agents. HbA1c levels were estimated by using the Bio-Rad D-10™ haemoglobinA1c program, and it is intended for the percent determination of haemoglobin A1c in human whole blood. It is based on high-performance liquid chromatography (HPLC). Samples will be injected in to the analytical cartridge after diluting them on D-10, programmed buffer gradient of increasing ionic strength will be delivered to the cartridge by the D-10 and here the haemoglobins are separated. The D-10 software and the exponentially modified Gaussian (EMG) algorithm will do the rest in quantifying the HbA1c levels [14]. The D-10 Haemoglobin A1c program is for use only with the Bio-Rad D-10 Haemoglobin Testing System [14]. Magnetic Resonance Spectroscopy was performed in the Department of Radiology in MediCiti Institute of Medical Sciences. Metabolite concentrations in right dorsolateral frontal lobe were estimated with 1.5 Tesla Phillips magnetic resonance imaging machine.
| S. No | Name of Yogasana | Duration |
|---|
| 1 | Dhanurasana | 1/2 minute to one minute for the pose being maintained, adding 1/2 minute per week |
| 2 | Naukasana | 2 - 4 turn of each, the pose being maintained for ten seconds adding one turn each, every fortnight |
| 3 | Arthamasthendrasana | ¼ minute to one minute for each side, adding ¼ minute per week |
| 4 | Bhujangasana | 2 - 4 turn of each, the pose being maintained for ten seconds adding one turn each, every fortnight |
| 5 | Shavaasana / Makarasana | 3 turn of each, the pose being maintained for 30 seconds |
| S. No | Name of Pranayama | Duration |
|---|
| 1 | Anuloma-viloma | 2-5 minutes |
| 2 | Surya anuloma-viloma | 5 minutes |
| 3 | Chandra anuloma-viloma | 5 minutes |
| 4 | Nadishuddi pranayama | 10 minutes |
Acquisition parameters
Right dorsolateral frontal lobe NAA and mI concentrations were estimated with Magnetic Resonance Spectroscopy (MRS) using a single voxel technique. Single voxel point resolved spectroscopy (PRESS) sequence was used for volume of interest (VOI) localization (TR/TE =1800 msec/36msec; NSA 96; Spectral band width 1000; scan time 3 min 25 sec) [6]. Based on the axial T2-weighted image, a voxel (20×20×15 mm) was positioned in the frontal white matter, avoiding the cortex and lateral ventricle. MOIST was used for water suppression in spectroscopy sequences and spectral correction was done [6]. Only peaks of NAA and mI were estimated but not the peaks of other metabolites like choline, glutamate, glutamine, acetylcholine etc.
Statistical Analysis
The results were analysed by using Med Calc Statistical Software version 12.7.8 (Med Calc Software bvba, Ostend, Belgium; http://www.medcalc.org; 2014). Unpaired student’s t-test was used in finding the metabolite concentration between test and control groups. A p-value <0.05 was considered as statistically significant.
Results
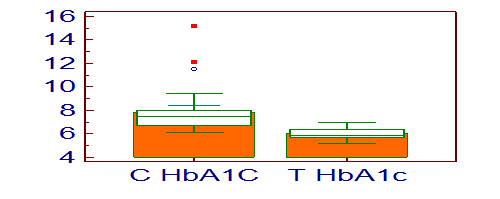
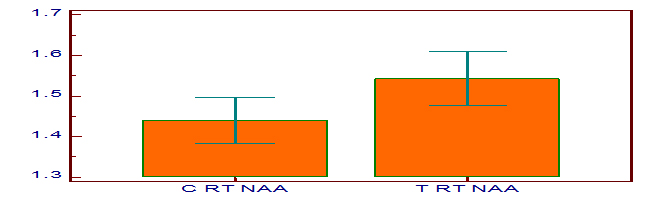
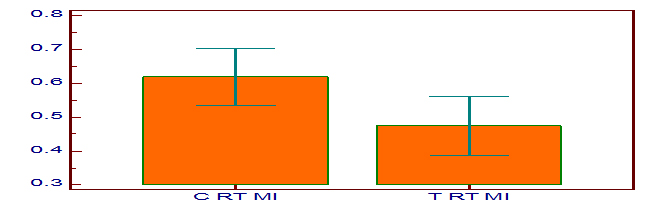
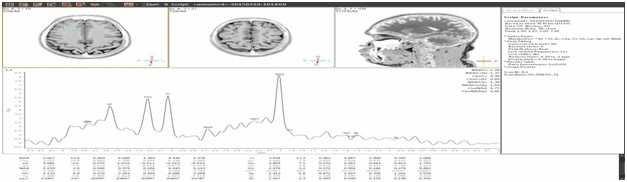
[Table/Fig-3] shows the HbA1c levels in control and test group subjects and they are 7.7 ± 1.84 and 6.02 ± 0.46 respectively. The p-value for HbA1c is <0.001 which is highly significant statistically. [Table/Fig-4] shows the NAA concentrations in the right dorsolateral frontal lobe of control and test group, and they are 1.44 ± 0.15 and 1.54 ± 0.19 respectively. The p-value for NAA is 0.02. [Table/Fig-5] shows the mI concentrations in the right dorsolateral frontal lobe of control and test group, and they are 0.61 ± 0.22 and 0.47 ± 0.24 respectively. The p-value for mI is 0.01. [Table/Fig-6] is the graphical representation of Magnetic Resonance Spectroscopy (MRS) of right dorsolateral frontal lobe in a given subject, showing the peaks of the different metabolites.
HbA1c levels in control and test group subjects
N-acetyl aspartate concentration in right dorsolateral frontal lobe in control and test group
Myoinositol concentration in right dorsolateral frontal lobe in control and test group
Right dorsolateral frontal lobe MRS in a subject
Discussion
High HbA1c levels and low NAA concentration are observed in controls when compared to yogasana and pranayama group that are reflected in [Table/Fig-3,4] respectively. Low concentration of NAA in control group is because of decreased neuronal viability [6,11]. It indicates that neuronal loss is the cause for low concentration of NAA in type 2 diabetes, this neuronal loss is the result of osmolyte imbalance and this is due to accumulation of advanced glycosilated end products [6]. Myoionositol concentration is more in controls than the yogasana and pranayama group as shown in [Table/Fig-5]. Increased mI concentration is an indication of myelin degradation, proliferation of glial cells or with increased glial cell size i.e., inflammation [15]. Increased HbA1c levels in controls will increase the right dorsolateral frontal lobe glucose levels [13]. High glucose levels in right dorsolateral frontal lobe will increase the myoinositol concentration in type 2 diabetic subjects [16–18] and decreases the N-acetyl aspartate (NAA) concentration [13,16]. Myoinositol (mI) concentration is more in diabetic controls than the yogasana and pranayama group and this is either because of increased intra neuronal glucose which have converted in to inositol 1-phosphate which in turn converted in to mI [19] or because of increased intracellular osmotic pressure which have led the increase in mI levels [6]. Where as in a study by Sinha et al., there is no significant change in the mI concentration in right frontal lobe although increased right frontal lobe glucose was observed [13]. Further studies are required in analysing this contradicting variation in frontal lobe myoinositol (mI) in type 2 diabetes. In test group yogasana and pranayama normalized or near normalized the HbA1c levels either by increasing the peripheral uptake of glucose or by increasing insulin secretion by beta cells of islets of Langerhas [20]. Increased uptake of peripheral glucose or increased insulin secretion in test group is because yogasana and pranayama stimulate the parasympathetic nervous system resulting in normal HbA1c levels. Normal or near normal plasma HbA1c levels might have kept the right dorsolateral frontal lobe glucose levels in control. Normal right dorsolateral frontal lobe glucose levels maintained the near normal N-acetyl aspartate (NAA) and myoinositol (mI) concentrations in test group subjects. Thus yogasana and pranayama are helpful in stabilizing the plasma HbA1c levels [20–33] and stable HbA1c levels will keep the N-acetyl aspartate (NAA) and myoinositol (mI) concentrations near normal values in right dorsolateral frontal lobe. Outcome of this study is, yogasana and pranyama should be advised to type 2 diabetic patients for maintaining the normal functioning of the right frontal lobe by keeping the normal N-acetyl aspartate (NAA) and myoinositol (mI) concentrations.
Study limitations and Future Prospects
We could not measure the type and quantity of food the subjects were taking. Measuring the stress levels also help in better understanding the role of yogasana and pranayama on HbA1c levels. Difficult to record the number of hyperglycaemic and hypoglycaemic attacks per day in diabetic subjects for assessing the effects of the same on brain metabolites. All the brain metabolite concentrations should be explored in multiple lobes of the brain in type 2 diabetes. By knowing the degree of variations of these metabolites in different lobes of the brain with HbA1c levels one can take the prophylactic measures.
Conclusion
In test group, yogasana and pranayama reduced the HbA1c levels to near upper limit of the normal values and this near normal HbA1c level is restricted the wide variations of right dorsolateral frontal lobe N-acetyl aspartate (NAA) and myoinositol (mI) concentrations, which are seen in diabetic controls.
[1]. International Diabetes Federation. Diabetes update-2014. http://www.idf.org/diabtesatlas/update-2014 (accessed 29 November 2014) [Google Scholar]
[2]. World Health Organization. Diabetes Fact sheet No.312. http://www.who.int/mediacentre/factsheets/fs312/en/ (accessed 10th October 2013) [Google Scholar]
[3]. Bruehl H, Sweat V, Tirsi A, Shah B, Convit A, Obese Adolescents with Type 2 Diabetes Mellitus Have Hippocampal and Frontal Lobe Volume ReductionsNeurosci Med 2011 2(1):34-42. [Google Scholar]
[4]. Rajani S, Reddy IY, Archana R, Effect of Type 2 Diabetes Mellitus on Brain Metabolites by Using Proton Magnetic Resonance Spectroscopy - A Systematic ReviewInt J Pharm Bio Sci 2014 5(4):1118-23. [Google Scholar]
[5]. Rajani S, Reddy IY, Kumar S, Archana R, Study of cognition in type 2 diabetes with yoga asana and pranayamaRJPBCS 2013 3(2):1637-41. [Google Scholar]
[6]. Bertholdo D, Watcharakorn A, Castillo M, Brain Proton Magnetic Resonance Spectroscopy: Introduction and OverviewNeuroimaging Clin N Am Elsevier Inc 2013 23(3):359-80. [Google Scholar]
[7]. Van Harten B, De Leeuw FE, Weinstein HC, Scheltens P, Biessels GJ, Brain Imaging in Patients with Diabetes, A Systamatic reviewDiabetes Care 2006 29(11):2539-48. [Google Scholar]
[8]. Tiehuis A, Van Der Meer F, Mali W, Pleizier M, Biessels GJ, Kappelle J, MR spectroscopy of cerebral white matter in type 2 diabetes; No association with clinical variables and cognitive performanceNeuroradiology 2010 52(2):155-61. [Google Scholar]
[9]. Lapolla A, Mosca A, Fedele D, The general use of glycated haemoglobin for the diagnosis of diabetes and other categories of glucose intolerance: Still a long way to goNutrition, Metabolism & Cardiovascular Diseases 2011 21:467-75. [Google Scholar]
[10]. Cecil KM, Proton Magnetic Resonance Spectroscopy Technique for the NeuroradiologistNeuroimag Clin N Am 2013 23:381-92. [Google Scholar]
[11]. Grachev ID, Kumar R, Ramachandran TS, Szeverenyi NM, Cognitive interference is associated with neuronal marker N-acetyl aspartate (NAA) in the anterior cingulate cortex: an in vivo 1H-MRS study of the Stroop Color- Word taskMolecular Psychiatry Nature Publishing Group 2001 6:529-39. [Google Scholar]
[12]. Christopher Haslett, Davidson’s Principles and Practice of Medicine 2002 19 edChurchill Livingstone [Google Scholar]
[13]. Sinha S, Ekka M, Sharma U, Raghunandan P, Pandey RM, Jagannathan NR, Assessment of changes in brain metabolites in Indian patients with type-2 diabetes mellitus using proton magnetic resonance spectroscopyBMC Research Notes 2014 7(41):2-7. [Google Scholar]
[14]. Pack R, Haemoglobin A1c Program Instruction ManualUnited StatesBio-Rad Laboratories, Inc., Hercules, CA, 94547:1-28. [Google Scholar]
[15]. Geissler A, Frund R, Scholmerich J, Feuerbach S, Zietz B, Alterations of cerebral metabolism in patients with diabetes mellitus studied by proton magnetic resonance spectroscopyExp Clin Endocrinol Diabetes 2003 111:421-27. [Google Scholar]
[16]. Sahin I, Alkan A, Keskin L, Cikim A, Karakas HM, Firat AK, Evaluation of in vivo cerebral metabolism on proton magnetic resonance spectroscopy in patients with impaired glucose tolerance and type 2 diabetes mellitusJ Diabetes Complications 2008 22(4):254-60. [Google Scholar]
[17]. Ajilore O, Haroon E, Kumaran S, Darwin C, Binesh N, Mintz J, Measurement of brain metabolites in patients with type 2 diabetes and major depression using proton magnetic resonance spectroscopyNeuropsycho pharmacology 2007 32:1224-31. [Google Scholar]
[18]. Haroon E, Watari K, Thomas A, Ajilore O, Mintz J, Elderkin-Thompson V, Prefrontal myo-inositol concentration and visuospatial functioning among diabetic depressed patientsPsychiatry Res 2009 171(1):10-19. [Google Scholar]
[19]. Van der Graaf M, Janssen SWJ, van Asten JJ, Hermus ARMM, Sweep CGJ, Pikkemaat JA, Metabolic profile of the hippocampus of Zucker Diabetic Fatty rats assessed by in vivo 1H magnetic resonance spectroscopyNMR Biomed 2004 17:405-10. [Google Scholar]
[20]. Sahay BK, Role of yoga in diabetesJ Assoc Physicians India 2007 55:121-26. [Google Scholar]
[21]. Shembekar AG, Kate SK, Yoga exercises in the management of diabetes mellitusJ Diabetic Assoc India 1980 20:167-71. [Google Scholar]
[22]. Nagarathna R, Nagendra HR, Proceedings of the Ninth Annual Conference of the IEEE Engineering in Medicine and Biology Conference 1987 New York, USAIEEE, Integrated approach of yoga therapy in the management of diabetes mellitus:1593-94. [Google Scholar]
[23]. Gupta SM, Modern medicine and yogaJ Intern Med India 2001 4:155-56. [Google Scholar]
[24]. Malhotra V, Singh S, Tandon OP, Madhu SV, Prasad A, Sharma SB, Effect of Yoga asanas on nerve conduction in type 2 diabetesIndian J PhysiolPharmacol 2002 46(3):298-306. [Google Scholar]
[25]. Manyam BV, Sahay BK, Sahay RK, Lifestyle modification in management of diabetes mellitusJ Indian Med Assoc 2002 100(3):178-80. [Google Scholar]
[26]. Stevens DL, The use of complementary and alternative therapies in diabetesClin Fam Prac 2002 4:911-28. [Google Scholar]
[27]. Kaplan-Mayer G, Get moving with yogaDiabetes Self Manag 2003 20(4):28:31-3. [Google Scholar]
[28]. Manyam BV, Diabetes mellitus, Ayurveda, and yoga. CommentJ Altern Complement Med 2004 10(2):223-25. [Google Scholar]
[29]. Khalasa SB, Yoga as a therapeutic intervention: a bibliometric analysis of published research studiesIndian J Physiol Pharmacol 2004 48(3):269-85. [Google Scholar]
[30]. Nayak NN, Shankar K, Yoga: a therapeutic approachPhys Med Rehabil Clin N Am 2004 15:783-98. [Google Scholar]
[31]. Singh S, Malhotra V, Singh KP, Madhu SV, Tandon OP, Role of Yoga in modifying certain cardiovascular functions in type 2 diabetic patientsJ Assoc Physicians India 2004 52:203-06. [Google Scholar]
[32]. Malhotra V, Singh S, Tandon OP, Sharma SB, The beneficial effect of yoga in diabetesNepal Med Coll J 2005 7(2):145-47. [Google Scholar]
[33]. Dham S, Shah V, Hirsch S, Banerji MA, The role of complementary and alternative medicine in diabetesCurr Diab Rep 2006 6(3):251-58. [Google Scholar]