Introduction
The sickle cell gene in India was first described amongst the tribal groups in South India and is now in Central India too, where prevalence varies between 9.4 – 22.2% [1].
The Vidarbha region in Maharashtra popularly known as Central India is also called as ‘Sickle Belt’. Prevalence in Vidarbha region is maximum in Samudrapur Block (7%) followed by Wardha (4.6%) [1]. It is predominantly found in scheduled castes (SC), scheduled tribes (ST) and other backward communities (OBC) population with overall prevalence of 10% amongst these groups [2].
Sickle cell disease involves nearly every organ in the body. The clinical manifestations are mainly attributed to three mechanisms: Vaso-Occlusion, Chronic Haemolytic Anaemia, and Infection.
In view of the high prevalence of skeletal changes in sickle cell disease, we have studied the skeletal changes of 103 cases by using MRI. The significance of the study is that, we observed various manifestations on MRI in asymptomatic cases. These findings might help in early initiation of therapy.
Materials and Methods
This was a cross-sectional study of 103 diagnosed cases (64 males and 39 females) of sickle cell disease from May 2012 -July 2014. The patients who reported to the Sickle Cell Clinic set up in our institute at Acharya Vinoba Bhave Rural Hospital, India were included in our study. Patients with skeletal system trauma and other skeletal pathologies were excluded. The age group varied from 5 years to 45 years. All the patients who were diagnosed of sickle cell anaemia by a combination of electrophoretic technique with solubility test were included in the study. Consent was obtained from all patients and the risks and benefits explained to them before participating in the study.
MRI was performed in a super conducting 1.5 Tesla MRI machine. The appendicular and axial skeleton system was evaluated using T1 weighted image, T2 weighted image, STIR sequences and T1 + Gadolinium wherever needed. Femur, humerus, vertebral column and pelvic bones were evaluated for all asymptomatic cases. Those patients with history of skeletal pain or infection were evaluated for additional sites depending upon affected site using gadolinium contrast. Age, gender, community and chief complaints were noted for all the cases. Each case was assessed for persistent red marrow, avascular necrosis of femur head, bone infarcts, infections, soft tissue changes and features of arthritis. Avascular necrosis of femur head was graded as per Ficat and Arlet system of classification.
Results
In the series of 103 cases, the age group involved from 5-45 years comprised of 64 males and 39 females. The common presentation was with musculoskeletal pain (61.1%). Maximum cases belonged to Mahar community in our series (38.8%).The common sites of skeletal involvement was vertebral column mostly thoracic and lumbar followed by pelvic bones, femoral head, shafts of femur, tibia and humerus.
Skeletal changes
1. Persistent red marrow was seen in 62 cases (60.1%) with most common site being the axial skeleton as shown in [Table/Fig-1,2]. Extramedullary haematopoiesis was noted in 4 cases [Table/Fig-3].
2. Avascular necrosis of femur head was seen in 32 cases (30.1%), with bilateral involvement in 30 cases (29%) as in [Table/Fig-4]. The MRI findings include oedema of femur head, crescent sign, cortical collapse and degenerative changes including reduced joint space [Table/Fig-5].
3. Osteonecrosis of the long bones was noted in 46 cases of which 31 were in spine and pelvis followed by shaft of femur in 23, tibia in 11 and humerus in 13 cases [Table/Fig-6]. Involvement of multiple sites was commonly noted in 40 cases (38.8%).
4. Osteomyelitis was an associated finding with SCD. In our series we found 14 cases as shown in [Table/Fig-7]. MRI revealed bone marrow oedema [Table/Fig-8], subperiosteal fluid collection, cortical irregularity, soft tissue collections [Table/Fig-9] with irregular peripheral post contrast enhancement. The different sites of involvement were femur 8 cases, tibia 5 cases and humerus in 4 cases.
5. Joint effusion was noted in 38 (36.8%) cases. Depending upon the amount of fluid, the patients were graded as shown in [Table/Fig-10]. Out of 38 cases, septic arthritis was found in 13 cases [Table/Fig-11].
6. In 5 cases, there was bone marrow oedema, discitis with post Gd enhancement, destruction of vertebral bodies and enhancing paravertebral soft tissue collections confirming the diagnosis of Pott’s Spine.
Discussion
In our series of 103 cases, incidence of Sickle Cell Disease was slightly higher in males (62.1%). Similar findings were noted by Kamble M et al., in Central India [3]. They concluded that, the high prevalence is due to the gender bias prevailing in our community, where males are given better medical care than females. The same factor plays a significant role in our region too.In our study, maximum cases of sickle cell disease belonged to the Mahar community 40 (38.8%) cases. Kate SL et al., studied the epidemiology of sickle cell in Maharashtra and identified prevalence of sickle cell disease in Scheduled castes (SC) [2], Scheduled tribes (ST) and other backward communities (OBC).This higher incidence in backward communities is due to the fact that they have a low socio-economic status, leading to infections and poor nutrition status [4]. The age group involved in our series ranges from 5 to 45 years.
The most common clinical presentation in our series was pallor due to anaemia, found in 64% cases which occur due to haemolysis and rapid removal of the abnormal red blood cells by the reticulo endothelial system in SCD. Ambekar SS et al., did a study in Maharashtra and reported anaemia as the most common clinical picture [5]. This was followed by bony pain in 63 cases (61.1%) and gait abnormality in 18 cases (17.4%) due to high incidence of avascular necrosis in SCD. Piognard A et al., studied 24 SCD patients and reported bony pain in all cases [6].
MRI is the imaging modality of choice for evaluation of bone marrow disorders and to understand the conversion pattern of bone marrow. The knowledge of distribution of red and yellow marrow according to age is very important to know the marrow abnormality.
Normal MRI Signal in Bone Marrow
The appearance of bone marrow on MRI depends upon the cellularity, protein and fat content. The red or haematopoietically active marrow has approximately 40% water, 40% fat and 20% protein. With growing age, from infancy to adulthood, the yellow marrow predominates, containing 80% fat, 15% water and 5% protein. The conversion of red to yellow marrow is a dynamic phenomenon and occurs in an orderly, symmetrical and centripetal pattern. It begins in distal aspect of the extremities (hands and feet) and extends proximally to involve the long bones of extremities. Within the long bones, the conversion follows a centrifugal pattern beginning in shafts of long bones and progressing to the ends [7,8]. The T1 weighted sequence is best for differentiating red from yellow marrow. Haematopoietic marrow appears slightly lower in signal intensity on T1 than adjacent muscle or intervertebral disc in case of vertebral column. Yellow marrow is isointense to subcutaneous tissue on T1 weighted images. On T2, fatty marrow appears higher in signal intensity than muscle and equal to subcutaneous tissue whereas red marrow appears hypointense to slightly isointense to muscles. On STIR sequence, haematopoietic marrow shows intermediate signal intensity similar to muscle, however fatty marrow shows signal intensity lower than muscles [9].
Infantile Marrow (upto one year): There is high concentration of red marrow throughout the axial and appendicular skeleton. Thus, the diaphyses and metaphyses of long bones on MRI have low T1 signal, while unossified epiphyses and apophyses composed predominantly of cartilage exhibit intermediate signal on T1 weighted images [10]. On T2 weighted images, red marrow appears slightly hypointense to isointense to muscles.
Childhood Marrow (One to 10 Years): By end of first year marrow conversion begins in phalanges of hand and feet and completed by one year and in femoral diaphyses.
Adolescent Marrow (10-25 years): In second decade there is continued conversion in the diaphyses of long bones along with recession of red marrow from the distal metaphyses.
Adult Marrow (over 25 Years): By the middle of the third decade, the mature or adult pattern of marrow is achieved with yellow marrow predominating throughout the appendicular skeleton, except for the proximal metaphyses of the femora and humeri. Marrow conversion in proximal femur occurs with progressive loss of red marrow from the medial femoral neck, probably related to mechanical stress [11].
The reconversion to red marrow shows a symmetrical involvement. Patchy or heterogenous appearance was seen mostly in the older patients. The articular ends and epiphysis however were spared in most of the cases.In our series, with age group ranging from 5 to 45 years, more number of cases showed persistent red marrow in femur with the proximal and distal metaphysis involved in 45 cases and femoral shaft in 38 cases. The humerus on the other hand showed comparatively lesser number of persistent red marrow cases with the proximal and distal metaphysis involvement in 41 cases and shaft involvement in 34 cases. Khedr SA et al., studied 27 known cases of SCD with acute painful vaso-occlusive crisis and found persistent red marrow in all cases [12].
In our study, the marrow changes also occurred because of infections, avascular necrosis and bone infarcts. Osteomyelitis was seen in 14 cases, showing bone marrow oedema in all of them. Bone marrow oedema appears as hypointense signal on T1 and hyperintense on T2 and STIR. The edges of this signal intensity area are ill defined. Subperiosteal fluid collection was seen in eight cases appearing hyperintense on T2WI and STIR sequences. Subperiosteal fluid collection, cortical destruction and irregularity, soft tissue collection and thick irregular peripheral post contrast enhancement of marrow are indicators of osteomyelitis [13]. Young patients of SCD are more prone to infections due to low socio-economic conditions. Balogun RA et al., studied 131 SCD cases with musculoskeletal presentations and reported 49 osteomyelitis cases (37.4%) [14].
Joint effusion, noted in 38 patients appears as low signal intensity on T1, high signal on fat suppressed T2 images and does not enhance on post Gd images. It is graded as: Grade 1 minimal joint fluid, Grade 2 enough to surround the femoral neck and Grade 3 distension of capsular recesses [15]. Out of these 38 patients of joint effusion, 13 cases (12.6%) also revealed thick and irregular articular synovium with post gadolinium enhancement, altered signal intensity in periarticular bone marrow and soft tissues of affected joint along with postgadolinium enhancement. These changes appear hypointense on T1, hyperintense on T2 and show a rim of enhancing tissue in periarticular region on post Gd T1 fat sat images suggestive of inflamed synovium. Signal intensity changes in the soft tissue around affected hip joint are seen as ill-defined areas of high signal on fatsat T2 images showing enhancement on post Gd T1 fat sat images. All these findings are suggestive of infective arthritis. Khedr SA et al., also noted septic arthritis in 2 out the 27 SCD patients that they evaluated [12].
Osteonecrosis or avascular necrosis occurs when vaso-occlusion results in the infarction of the articular ends and heads of long bones. Out of the 32 cases, 30 patients had bilateral involvement of femoral head while other two had unilateral involvement. These patients presented with bony pain as the disease progressed. Our cases were graded according to the Ficat and Arlet classification system [16] as follows [Table/Fig-12]. Grade I AVN on MRI was seen in 14 hips. Grade II seen in 11 hips. Grade III seen in 18 hips. This occurs due to continuous weight bearing which leads to weakening of the trabeculae which causes microfractures and hence collapse and sequestration. There was also associated joint effusion which appears as increased signal intensity on T2 and STIR due to reactive and superimposed infection. Grade IV seen in 20 hips, had additional degenerative features in form of reduced joint space, osteophytes from femoral and acetabular margins and low signal intensity thin, curvilinear sclerotic margin of the articular ends. Total of 32 patients presented with avascular necrosis of femur head. Balogun RA et al., [14] studied 131 patients of SCD with musculoskeletal complaints and reported 28 cases (21.4%) of AVN, finding similar to our study.
Bone marrow necrosis other than femoral head, were found at 78 sites of 46 (44.6%) patients. There were vertebral infarcts in 31 patients, 23 in shaft of femur, 11 in tibia and 13 in humerus. Many patients had bone infarcts at multiple sites with vertebrae and shaft of femur being the most common sites. The vertebral end plates are prone to infarction. They appear as central, square shaped end plate depression (H-shape deformity). Vertebral collapse was also noted in three patients. MRI features of bone infarcts are central region of hyperintensity on T2 surrounded by low signal intensity line on T1 and T2. The peripheral band shows post gadolinium enhancement which represents reactive granulation tissue at interface between viable and necrotic bone. Crisis in sickle cell are a repetitive process, hence the patients may show the effects of vaso-occlusive episodes of the past and the present event. Therefore, even during the pain-free period the MRI of the marrow may show skeletal abnormalities. This is the reason for appearance of infarcts in patients without bony pain.
Apart from these findings, extramedullary haematopoiesis was seen in four cases in form of paraspinal soft tissue masses. Three of these lesions showed intermediate signal intensity on T1 and T2 weighted images. The lesions were located in the thoraco-lumbar region and did not show any significant post Gadolinium enhancement. One patient however, showed reduced signal intensity on both T1 and T2WI due to iron deposition as a result of multiple blood transfusions. Gumbs RV et al., studied 108 homozygous sickle cell patients and reported paraspinal masses in 8 (7%) patients on X-ray and CT Scan [17]. Extramedullary haematopoiesis is a physiologic compensatory mechanism for bone marrow dysfunction characterized by the presence of haematopoietic tissue outside of the bone marrow [17]. These lesions are seen as bilateral, smooth, sharply delineated lobulated paraspinal masses without any bony erosion.
Association with spinal tuberculosis was seen in 5 cases. The probable reason for this could be poor socio-economic status and reduced immunity which predisposes to tubercular infection. Moreover vaso-occlusive crisis in sickle cell disease makes the vertebral end plates susceptible to infection by tubercular bacilli [18]. Krupniewski L et al., [18] reported a patient of sickle cell disease with spondylodiscitis on the thoracic spine.
Persistent red marrow distribution pattern in skeleton
| Axial Skeleton | Appendicular Skeleton |
|---|
| Spine | Sternum | Pelvis | Femur | Humerus |
|---|
| (T1- signal intensity less than adjacent muscles and intervertebral discs) | (T1- signal intensity less than adjacent muscles) |
| 44 (42.7%) | 12 (11.6%) | 25 (24.2%) | Shaft – 38 | Shaft – 34 |
| Proximal and Distal -45 | Proximal and Distal -41 |
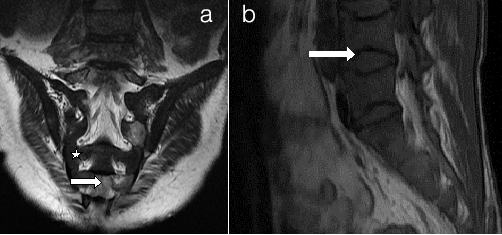
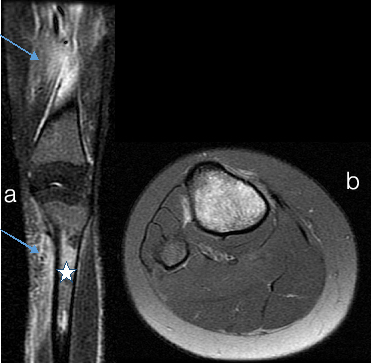
Persistent red marrow a) Sacrum b) Spine (a) Coronal T2WI of sacrum and (b) Sagittal T1WI of Spine shows low signal intensity marrow (white star) compared to adjacent muscles suggestive of cellular (red) marrow. There are multiple bony infarcts in S2, S4 and S5 vertebrae (small arrow). There are vertebral end plate concavities at multiple levels due to end plate infarction giving fish mouth appearance
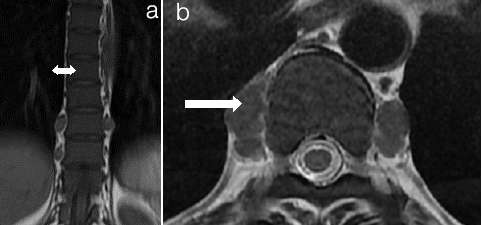
Extramedullary haematopoiesis (a) T1Weighted Image (b) T2Weighted Image (a) Coronal and; (b) Axial MRI Images of Thoracolumbar spine. Extramedullary Haematopoiesis is seen as lobulated paravertebral soft tissue masses (arrow in b) with intermediate signal intensity on T1 and T2 weighted images similar to signal intensity of normal intrameduallary haematopoietic tissue. Also there is Persistent red marrow in vertebral bodies (double head arrow in a)
Avascular necrosis of femoral head on MRI
| AVN = 32 patients 27 with MSK pain + 5 others | RIGHT | LEFT |
|---|
| I - Uniform Oedema | 7 (6.7%) | 7 (6.7%) |
| II - Crescent Sign | 6 (5.8%) | 5 (4.8%) |
| III - Crescent Sign, Sequestra, Cortical Collapse | 8 (7.7%) | 10 (9.7%) |
| IV - Crescent Sign, Cortical collapse with Degenerative changes and Reduced joint space | 10 (9.7%) | 10 (9.7%) |
| TOTAL | 31 (30%) | 32 (31%) |
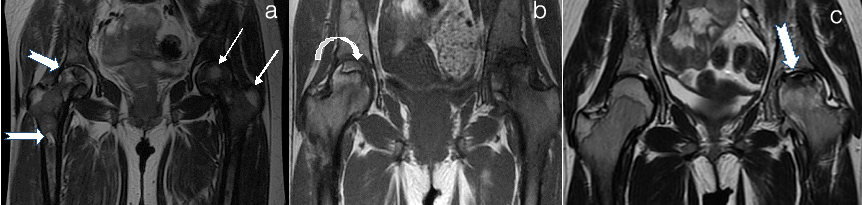
Avascular necrosis of femur head mri (ficat and arlet) (a) Right Grade II Left Grade I (b) Right Grade II Left Grade IV C .Left Grade III (a) Cor T2WI hip joint shows hyperintense signal suggestive of oedema FICAT Grade I (thin white arrows in a). There are multiple infartcs in head, neck and shaft of right femur showing hyperintense signal with hypointense rim (arrows in a) FICAT Grade II. Reduced signal of marrow suggesting red marrow in both femur. Bilateral hip joint effusion. (b) T1WI shows Crescent sign in head of right femur consisting inner hyperintense rim with outer hypointense sclerotic rim FICAT Grade II (curved arrow in b). There is collapse of head on left side with crescent sign and reduced joint space FICAT Grade IV (white arrow in b). (c). Cor T2WI shows flattening and reduced signal with crescent sign in head of femur on left side (arrow in c) suggesting Grade III AVN with joint effusion. Note infarcts in bilateral iliac bones
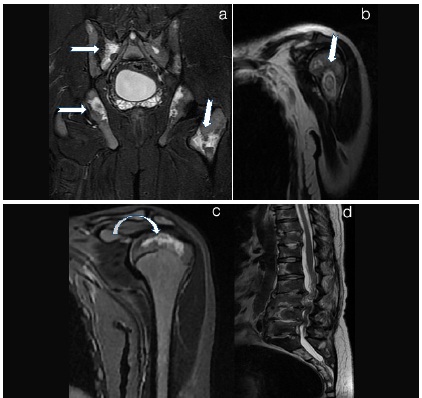
Bony infarcts at multiple sites a) Pelvis STIR b) Left Humeral neck T2WI c) Left Humerus epiphyseal infarct T2WI d) T2 Weighted Image a) Cor STIR of Pelvis shows multiple areas of hyperintense signal in iliac bones, sacrum and left femur neck suggesting infarcts (arrows in a). b) and c) Cor T2WI Head and neck of left humerus shows altered signal intensity areas with a hypointense rim suggesting infarcts (arrow in b, curved arrow in c) . d) T2WI of the vertebral column shows multiple vertebral bone marrow infarcts with infective pre and paravertebral collection
Number of patients with bone infections
| BONE IN FECTI ON (OSTEOMYELITI S) = 14 |
| Bone marrow oedema (T1- hypo, T2- hyper) in medullary cavity | 14 (13.5%) |
| Sub periosteal fluid collection | 8 (7.7%) |
| Cortical irregularity and destruction | 7 (6.7%) |
| Soft tissue collections | 7 (6.7%) |
| Thick irregular peripheral post Gd enhancement | 8 (7.7%) |
Bone marrow and soft tissue oedema a) Tibia and Femur Coronal b) Axial Tibia a) STIR image Extensive bone marrow oedema (star in b) in tibia with surrounding soft tissue hyperintensity (arrows in b) suggesting soft tissue oedema. b) Axial STIR tibia shows increased signal in medulla of tibia and surrounding soft tissues suggesting marrow oedema
Osteomyelitis a) X-RAY LEFT LEG b)T1WI c)T2WI d)T1 fat sat + Gd
a) X-ray left leg shows multiple irregular cortical erosions in femur shaft and lower end. Extending into the medulla of femur (arrow in a). There is lamellated type of periosteal reaction.
b) and c) MRI T1WI Coronal show multiple cortical irregularities and erosions with medullary hyperintense signal in shaft and distal femur. There are multiple collections in surrounding soft tissues which appear hypointense on T1 and hyperintense on T2. (arrow in c). d) Contrast enhanced T1 fat sat image - shows enhancement in medulla and surrounding soft tissues

Patient distribution with septic arthritis
| SEPTIC ARTHRITIS |
|---|
Joint effusion• Grade- 1 minimal • Grade- 2 enough to surround joint • Grade-3 distension of capsular recesses
| 38 (36.8%)15 (14.5%) 10 (9.7%) 13 (12.6%)
|
| Signal intensity changes in soft tissue in pericapsular area | 13 (12.6%) |
| Signal intensity changes in bone marrow of affected joint | 13 (12.6%) |
| Inflamed synovium (enhance on Post Gd) | 8 (7.7%) |
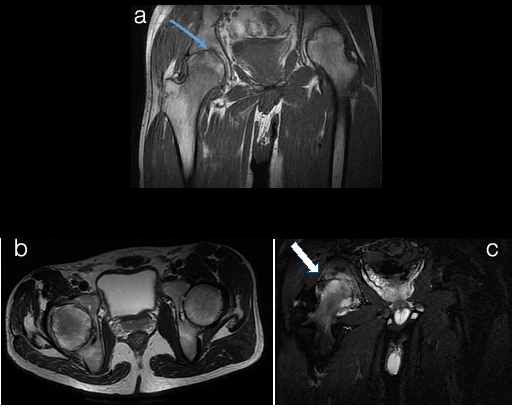
Infective arthritis of hip joint a)T1WI b)T2WI c)STIR
a) Coronal T1WI show cortical erosions of right acetabulum and subarticular region of right femoral headwith reduced joint space (thin arrow in a). b) Axial T2WI show minimal right hip joint effusion with cortical erosion and marrow oedema in pariarticular region. C) Axial STIR image shows extensive high signal intensity areas in head of femur and acetabulum with surrounding soft tissues showing abnormal high signal intensity and reduced joint space on right side suggesting bone marrow and soft tissue oedema (arrow in c). This was suggestive of arthritis and was proven to be of Tubercular aetiology on cytology
The Ficat and Arlet classification system [16]
| Stage | Clinical | Radiograph | MRI |
|---|
| 0 | No Symptoms | Normal | Normal |
| I (7 hips- bilaterally) | May have symptoms | Normal or may have patchy osteoporosis | Normal to uniform oedema (low signal on TIWI, high signal on T2WI) subchondral zone of non enhancement or minimal enhancement due to oedema on Gd |
| II (6 hips-right, 5 hips - left) | Pain, Stiffness | Osteopenia mixed, osteopenia and sclerosis, cystic changes | Wedge shaped crescent sign (X-ray Stage III) |
| III (8 hips- right, 10 hips- left) | Stiffness, Groin and Knee Pain | Crescent sign, sequestra, cortical collapse, joint preserved | Crescent sign, sequestra, cortical collapse, joint preserved. |
| IV (10 hips- bilateral) | Pain and limp, may be severe | III plus degenerative changes and narrow joint space | III plus degenerative changes and narrow joint space |
Limitations of study
1.Our study was conducted in a rural set-up. Due to poor socioeconomic status, only the affording patients were included in the study.
2. Gadolinium contrast agent could not be administered in those patients with impaired renal function and those with financial constraints.
3. There is inadequate health awareness and education about the disease and associated co-morbidities in the rural set up. Illiterate parents and other family members were reluctant to accept the disease and hence failed to undergo relevant investigations like MRI.
Conclusion
The most common presentation of patients in our series was bony pain involving one or multiple sites in 61.1% cases. Along with pain, these patients also had anaemia and jaundice. MRI is the most sensitive and useful imaging tool which can identify the various musculoskeletal abnormalities in SCD non- invasively. Asymptomatic cases have shown various manifestations on MRI which may help in early initiation of therapy. Red marrow persistence has been thoroughly evaluated and the pattern of reconversion is only possible with MRI.
[1]. P Deshmukh, BS Garg, N Garg, NC Prajapati, MS Bharambe, Prevalence of Sickle Cell Disorders in Rural WardhaIndian J Community Medicine 2006 31:01-03. [Google Scholar]
[2]. SL Kate, DP Lingojwar, Epidemiology of Sickle Cell Disorder in the State of MaharashtraInt J Hum Genet 2002 2(3):161-67. [Google Scholar]
[3]. M Kamble, P Chaturvedi, Epidemiology of Sickle Cell Disease In A Rural Hospital In Central IndiaIndian Pediatrics 2000 37:391-96. [Google Scholar]
[4]. SH Yale, N Nagib, T Guthrie, Approach to the Vaso-occlusive Crisis in Adults with Sickle Cell DiseaseAm Fam Physician 2000 61(5):1349-56. [Google Scholar]
[5]. SS Ambekar, MA Phadke, GD Mokashi, MP Bankar, VA Khedkar, V Venkat, Pattern of Haemoglobinopathies in Western MaharashtraInd J Paedtr 2001 38:530-34. [Google Scholar]
[6]. A Poignard, M Bouhou, P Herniguo, Septic Arthritis of the Hip in Adults with Sickle Cell DiseaseOrthop Rev (Pavia) 2011 3(1):e1 [Google Scholar]
[7]. BC Vande berg, J Majghem, FE Lecouvet, B Maldague, Magnetic Resonance Imaging of Normal Bone MarrowEuropean Radiology 1998 8:1327-34. [Google Scholar]
[8]. RP Guillerman, Chapter 177 Imaging of Normal and Abnormal Bone Marrow. Cafey’s Paediatric Diagnostic Imaging 2008 11th EditionPhiladelphiaThomas L Slovised, Mosby Elsevier [Google Scholar]
[9]. MJ Siegelm, Imaging of Pediatric Bone Marrow DiseasesJ Hong Kong Coll Radiol 2000 3:38-50. [Google Scholar]
[10]. K Foster, S Chapman, K Johnson, MRI of the marrow in the paediatric skeletonClinical Radiology 2004 58:651-73. [Google Scholar]
[11]. C Ricci, M Cova, YS Kang, A Yang, A Rahmouni, MW Scott, Normal Age- Related Patterns of Cellular and Fatty Bone Marrow Distribution in the Axial Skeleton: MR Imaging StudyRadiology 1990 177:83-88. [Google Scholar]
[12]. SA Khedr, MA Hassan, AA Shabana, AH Gaballah, DA Mohktar, Musculoskeletal manifestations of Sickle cell disease, diagnosis with whole body MRIThe Egyptian Journal of Radiology and Nuclear medicine 2012 43:77-84. [Google Scholar]
[13]. S Ahmad, ZA Khan, R Rehmani, MY Sheikh, Diagnostic Dilemma In Sicklers With Acute Bone Crisis: Role Of Subperiosteal Fluid Collection On MRI In Resolving This IssueJ Pak Med Association 2010 60(10):819-22. [Google Scholar]
[14]. AR Balogun, DC Obalum, Spectrum of Musculoskeletal Disorders in Sickle Cell Disease in Lagos, NigeriaJ Orthop Surg Res 2010 5:2 [Google Scholar]
[15]. SK Lee, KJ Suh, YW Kim, HS Ryeom, YS Kim, JM Lee, Septic Arthritis versus Transient Synovitis at MR Imaging: Preliminary Assessment with Signal Intensity Alterations in Bone MarrowRadiology 1999 211:459-65. [Google Scholar]
[16]. RP Ficat, J Arleta, Ischemia and Necrosis of bone. In: Hungerford DS ,ed. Ischemia and necrosis of bone 1980 BaltimoreWilliams & Wilkins:68 [Google Scholar]
[17]. RV Gumbs, EAH Ford, JS Teal, CG Kletter, O Castro, Thoracic Extramedullary Haematopoiesis in Sickle Cell DiseaseAJR 1987 149:889-93. [Google Scholar]
[18]. L Krupniewski, P Palczewski, M Golebiowski, Tuberculous spondylodiscitits in a patient of sickle cell disease: CT FindingsPol J Radiol 2012 77(1):72-76. [Google Scholar]