Fluorides constitute about 0.032% of the earth’s crust and originate from the burning of coal fuels, the dusts of fluoride containing soils and from the gaseous industrial wastes. However, a small amount of fluoride also enters water directly from the seas and the atmospheric contamination. Fluoride in drinking water is known for both beneficial and detrimental effects on health. The presence of fluoride, in quantities in excess of limits is a serious matter of concern from a public health point of view. In areas of endemic fluorosis, ingestion levels of fluoride from diet and water is about 8.0 mg/l daily. About 60% of fluoride intake is through water [1]. Globally, the primary source of fluoride intake is food and almost all foodstuffs contain traces of fluoride. The levels of fluoride in meat, fruits and vegetables are usually low. However, it is high in canned fishes such as salmon and sardines. [2,3]. It was reported that in India 0.90 - 1.0 mg/l fluoride in drinking waters is associated with mottled enamel. The consumption of water is greater in India than in temperate and subtropical countries. Most of the rural population is accessible to only primitive wells rich in fluorine sediment. The reported optimal concentration of fluoride considered to be beneficial to dental health is in the range of 0.50 - 0.80 mg/l in water. Chronic ingestion of high fluoridated water can lead to skeletal fluorosis in adults [4].
Around 25 nations, involving over 200 million people have health risks due to high fluoride levels in groundwater. In India, about 62 million people are at risk due to high fluoride concentration in drinking water. Dental fluorosis is endemic in 14 states, most commonly in Andhra Pradesh, Bihar, Gujarat, Madhya Pradesh, Punjab, Rajasthan, Tamil Nadu and Uttar Pradesh, [5]. The manifestations due to high fluoride intake in drinking water is highly endemic and widespread in developing countries. In India, dental fluorosis was first reported in 1937, from Prakasam district of Andhra Pradesh [6].
Fishes have been a traditional food in Andhra Pradesh. While small amounts of fluoride in food have been shown to help prevent tooth decay, too much fluoride in the diet or long-term excessive intake of fluoride can result in macular teeth [7]. The culture prevailing in the state also contributes to the increased consumption of fishes, atleast once in a week. Being a high fluoridated belt area, the availability of fluoride through the dietary fishes has raised a hypothesis that whether fluoride intake through fish diet has any impact on dental fluorosis. Salmon and Sardine fishes have shown an increased fluoride content but no relevant information about fluoride content in other most commonly consumed fishes is available.
In some coastal areas, the amount of fluoride levels are high and can result in adverse manifestations which may range from mild dental fluorosis appearing as mottled enamel and white spots to brownish discolouration and to crippling skeletal fluorosis, as the level and period of exposure increases. There are reports that excessive fluoride consumption promotes cancer, has detrimental neurological effects, and causes hip fracture leading to stillbirth or birth defects [8].
We have hypothesized that fluoride present in the fishes could be a contributing factor to fluorosis. Thus, in the present study an attempt has been made to provide an overlook about the fluoride retention capacity in the skin, muscle and bone of locally consumed fishes in different aquatic environments (freshwater, estuary and marine) and to determine its contributing impact to fluorosis.
Materials and Methods
Study Design and Study Sites
The present study was a cross-sectional study to evaluate the amount of fluoride retention due to most commonly consumed estuarine fishes amongst fish consuming population of Andhra Pradesh, India.
Ethical Considerations
The research protocol of the study was reviewed and ethical clearance was obtained from Jaipur Dental College Institutional Board. Informed consent was obtained from the subjects who participated in the study.
Fluoride Analysis
Ten species of most commonly consumed estuarine fishes including five species from river i.e.: Catla, Goldfish, King fish, Murrel, Rahu and five species from sea i.e.: Indian Sardine, Indian Mackerel, Pomfret, Conger Eel, Tunny were purchased from a local fish market in Hyderabad, where fishes are brought from different fish markets of Andhra Pradesh. The fishes were brought to the laboratory and were dissected with clean stainless steel instruments. Muscle, bone and skin were homogenized and ground first with a meat mincer and later dried to powder. One gram samples of dry skin, muscle and bone powder were weighted and placed in plastic Petri dishes. Then, deionized water was added to bring the final volume of the sample up to 3 ml. On the inside cover of each Petri dish, a sodium hydroxide (0.05N) trap solution (50 μl) was placed. Then the dishes were sealed by application of Vaseline inside the rim of the Petri dish cover. A hole was made on top of each Petri dish with a soldering iron, to which 1 ml of 3N sulphuric acid saturated with HMDSO (hexa-methyldisiloxane) was added. The dishes were then immediately resealed with Vaseline and kept overnight which allowed HF to diffuse out of the sample into the NaOH trap. Neutralization of NaOH in the trap was done by mixing it with 25 μl of 0.1N perchloric acid and brought to a volume of 100 μl with TISAB II (Total Ionic Strength Adjustment Buffer solution). The F contents of the samples were measured directly after calibration of the F ion selective electrode with a standard solution of NaF of known and exact F concentration. Linear calibration curve of the ISE was obtained with R2 = 0.99. The accuracy was verified by an average recovery of 98.6% by spiking five of the samples with the addition of three known quantities of F (as NaF). The standard SPADNS Spectrophotometric method (2-(p-sulfophenylazo)-1,8-dihydroxy-3,6-napthalenedisulfonic acid, trisodium salt; 2-(4-sulfophenylazo)-1,8-dihydroxy-3,6-napthalenedisulfonic acid, trisodium salt) was used for analysis of Fluoride using DR/ 5000s Spectrophotometer [9].
Examiner training and calibration
Prior to the survey, a 5 day training programme was completed by the examiners in the Department of Public Health Dentistry, Jaipur Dental College. In order to assess the intra examiner reliability, the investigator examined 10 subjects and recorded the Deans Fluorosis Index. The same subjects were examined by different examiners on the same day and were randomly called on the next day and the investigator repeated the examinations. The Kappa co-efficient value for intra-examiner reliability with respect to the Deans Fluorosis Index was 0.85. The values reflected high degree of conformity in observation.
Sampling Design
Simple random sampling was employed to select the study population. Out of the four common fish markets- Begum bazar fish market, Ramnagar fish market, Musheerabad fish market and Ameerpet fish market, Musheerabad fish market in Secunderabad was randomly selected by lottery method. Then, systematic sampling was employed by selecting the subjects in every 4th house starting from the first house. Thus, a total of 102 subjects who were fulfilling the inclusion criteria were selected which included natives belonging to that area/community since birth, within the age group of 13 to 25 years and who were consuming locally available fishes atleast 3 times in a week. The subjects who were not willing to participate were excluded.
Clinical Assessment and Data Collection
After explaining the purpose and details of the study, a written informed consent was obtained from subjects and parents of the children who were willing to participate. Oral examination was performed by trained and calibrated dentists. The presence and severity of dental fluorosis was recorded using Community Fluorosis Index [10]. Each tooth in the mouth was scored according to one of the six categories of Dean’s index, and the individual’s dental fluorosis score was arrived at based on the severest form recorded for two or more teeth. Community fluorosis index (CFI) was calculated by adding up the individual scores of dental fluorosis as described by Dean and dividing the sum by the total sample size. The public health significance of CFI values were based on values as mentioned in [Table/Fig-1] [10].
Public Health significance of community fluorosis index
| CFI value range | Public health significance |
|---|
| 0.0-0.4 | Negative |
| 0.4-0.6 | Borderline |
| 0.6-1.0 | Slight |
| 1.0-2.0 | Medium |
| 2.0-3.0 | Marked |
| 3.0-4.0 | Very marked |
Statistical Analysis
Qualitative data thus collected was summarized as Mean and Standard Deviation (Mean ± SD). Std Error of Mean and 95% CI. Analysis was done using MedCalc v12.2.1.0 software. Descriptive statistics were used to describe the prevalence and severity of Dental fluorosis.
Results
[Table/Fig-2] shows the distribution of fluoride content in river water fishes. Fluorine concentration was expressed in parts per million (ppm). Three fishes per variety were analysed using standard SPADNS Spectrophotometric method and mean was calculated for skin, muscle and bone separately. Thus, amongst the river fishes that were analysed, the fluoride levels in bone were maximum in Catla (1.51 ppm) whereas the levels were maximum in the muscle and skin of goldfish (0.98 ppm and 0.81 respectively).
Distribution of fluoride in river water fishes
| Habitat | Fish | Tissue | n | Mean | Std. Deviation | Std. Error of Mean | 95% CI | Min | Max |
|---|
| River Fish | Catla | Bone | 3 | 1.51 | 0.06 | 0.03 | 1.44-1.57 | 1.45 | 1.56 |
| Muscle | 3 | 1.02 | 0.06 | 0.03 | 0.95-1.08 | 0.96 | 1.08 |
| Skin | 3 | 0.59 | 0.04 | 0.02 | 0.55-0.63 | 0.56 | 0.63 |
| Total | 9 | 1.04 | 0.40 | 0.13 | 0.78-1.30 | 0.56 | 1.56 |
| Gold Fish | Bone | 3 | 1.13 | 0.07 | 0.04 | 1.06-1.20 | 1.06 | 1.19 |
| Muscle | 3 | 0.98 | 0.08 | 0.04 | 0.90-1.07 | 0.91 | 1.06 |
| Skin | 3 | 0.81 | 0.06 | 0.03 | 0.75-0.88 | 0.76 | 0.87 |
| Total | 9 | 0.98 | 0.15 | 0.05 | 0.88-1.07 | 0.76 | 1.19 |
| King Fish | Bone | 3 | 1.36 | 0.04 | 0.02 | 1.32-1.40 | 1.32 | 1.39 |
| Muscle | 3 | 0.74 | 0.03 | 0.02 | 0.71-0.78 | 0.71 | 0.77 |
| Skin | 3 | 0.22 | 0.06 | 0.03 | 0.16-0.28 | 0.17 | 0.28 |
| Total | 9 | 0.77 | 0.50 | 0.17 | 0.45-1.10 | 0.17 | 1.39 |
| Murrel | Bone | 3 | 1.30 | 0.05 | 0.03 | 1.25-1.35 | 1.25 | 1.34 |
| Muscle | 3 | 0.94 | 0.03 | 0.02 | 0.91-0.97 | 0.91 | 0.97 |
| Skin | 3 | 0.33 | 0.03 | 0.02 | 0.29-0.36 | 0.30 | 0.36 |
| Total | 9 | 0.85 | 0.43 | 0.14 | 0.58-1.13 | 0.30 | 1.34 |
| Rahu | Bone | 3 | 1.00 | 0.05 | 0.03 | 0.95-1.06 | 0.95 | 1.05 |
| Muscle | 3 | 0.61 | 0.06 | 0.03 | 0.54-0.67 | 0.56 | 0.67 |
| Skin | 3 | 0.34 | 0.02 | 0.01 | 0.31-0.36 | 0.32 | 0.36 |
| Total | 9 | 0.65 | 0.29 | 0.10 | 0.46-0.84 | 0.32 | 1.05 |
| Total | Bone | 15 | 1.26 | 0.19 | 0.05 | 1.16-1.35 | 0.95 | 1.56 |
| Muscle | 15 | 0.86 | 0.17 | 0.04 | 0.77-0.94 | 0.56 | 1.08 |
| Skin | 15 | 0.46 | 0.23 | 0.06 | 0.34-0.57 | 0.17 | 0.87 |
| Total | 45 | 0.86 | 0.38 | 0.06 | 0.75-0.97 | 0.17 | 1.56 |
[Table/Fig-3] shows the distribution of fluoride content in sea water fishes. Amongst, all sea water fishes that were analysed, the fluoride levels in bone were maximum in Indian Sardine (4.22 ppm) whereas the levels were maximum in the muscle and skin of Indian Mackerel (3.91 and 2.88 ppm respectively).
Distribution of fluoride in sea water fishes
| Habitat | Fish | Tissue | n | Mean | Std. Deviation | Std. Error of Mean | 95% CI | Min | Max |
|---|
| Sea Fish | Black Pomfret | Bone | 3 | 3.14 | 0.14 | 0.08 | 2.98-3.30 | 3.01 | 3.29 |
| Muscle | 3 | 2.34 | 0.11 | 0.06 | 2.22-2.46 | 2.22 | 2.43 |
| Skin | 3 | 1.00 | 0.09 | 0.05 | 0.90-1.10 | 0.93 | 1.10 |
| Total | 9 | 2.16 | 0.94 | 0.31 | 1.55-2.77 | 0.93 | 3.29 |
| Conger Eel | Bone | 3 | 1.91 | 0.08 | 0.05 | 1.82-2.00 | 1.82 | 1.98 |
| Muscle | 3 | 1.32 | 0.04 | 0.02 | 1.27-1.36 | 1.28 | 1.36 |
| Skin | 3 | 0.83 | 0.08 | 0.04 | 0.75-0.92 | 0.77 | 0.92 |
| Total | 9 | 1.35 | 0.47 | 0.16 | 1.05-1.66 | 0.77 | 1.98 |
| Indian Sardine | Bone | 3 | 4.22 | 0.06 | 0.04 | 4.15-4.29 | 4.17 | 4.29 |
| Muscle | 3 | 2.86 | 0.08 | 0.05 | 2.76-2.95 | 2.79 | 2.95 |
| Skin | 3 | 2.15 | 0.05 | 0.03 | 2.09-2.21 | 2.10 | 2.20 |
| Total | 9 | 3.08 | 0.91 | 0.30 | 2.48-3.67 | 2.10 | 4.29 |
| Mackerel | Bone | 3 | 4.11 | 0.09 | 0.05 | 4.01-4.21 | 4.01 | 4.18 |
| Muscle | 3 | 3.91 | 0.07 | 0.04 | 3.83-3.99 | 3.83 | 3.97 |
| Skin | 3 | 2.88 | 0.10 | 0.06 | 2.77-2.99 | 2.80 | 2.99 |
| Total | 9 | 3.63 | 0.57 | 0.19 | 3.26-4.01 | 2.80 | 4.18 |
| Tunny | Bone | 3 | 3.09 | 0.07 | 0.04 | 3.01-3.17 | 3.02 | 3.16 |
| Muscle | 3 | 2.83 | 0.08 | 0.04 | 2.74-2.91 | 2.76 | 2.91 |
| Skin | 3 | 2.21 | 0.08 | 0.05 | 2.12-2.30 | 2.14 | 2.30 |
| Total | 9 | 2.71 | 0.40 | 0.13 | 2.45-2.97 | 2.14 | 3.16 |
| Total | Bone | 15 | 3.29 | 0.87 | 0.22 | 2.85-3.73 | 1.82 | 4.29 |
| Muscle | 15 | 2.65 | 0.87 | 0.23 | 2.21-3.09 | 1.28 | 3.97 |
| Skin | 15 | 1.82 | 0.81 | 0.21 | 1.41-2.23 | 0.77 | 2.99 |
| Total | 45 | 2.59 | 1.03 | 0.15 | 2.28-2.89 | 0.77 | 4.29 |
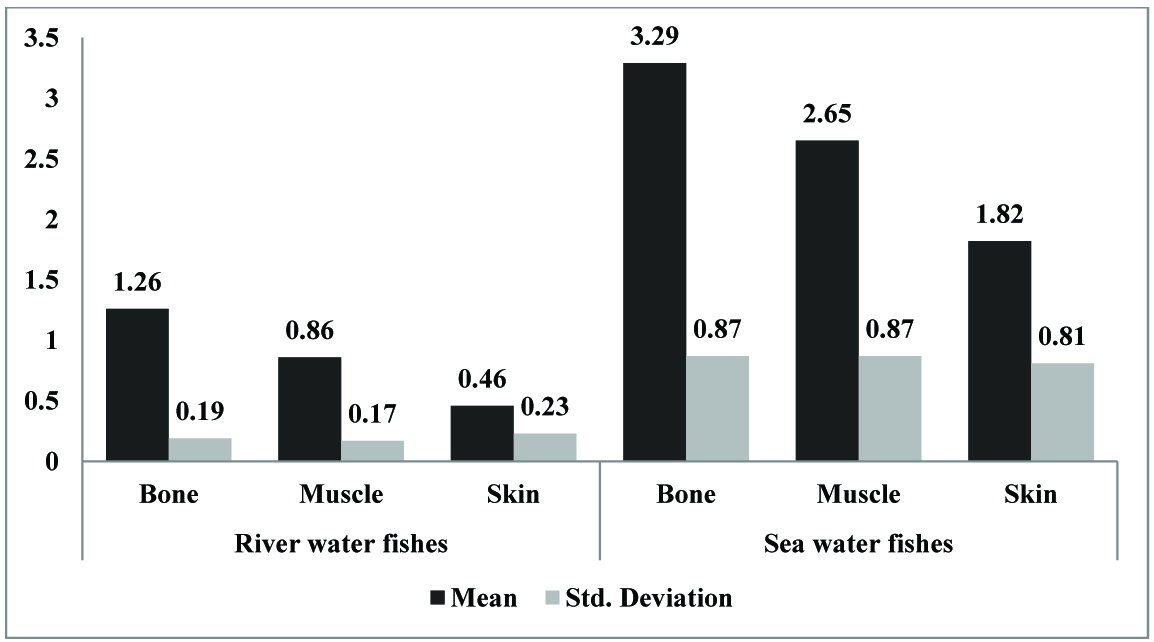
It was also unveiled that the mean total fluoride concentration of all the river fishes in skin, muscle and bone were less (0.86 ppm) as compared to the sea water fishes (2.59 ppm) [Table/Fig-4].
Mean Fluoride Content of Various River and Sea Fishes
[Table/Fig-5] shows the mean Community Fluorosis Index was 1.06 amongst a sampled fish consuming population.
Mean community fluorosis index among sampled fish consuming population
| Subjects | Gender | n | Deans Fluorosis Index | Affected with Fluorosis | Community Fluorosis Index (CFI |
|---|
| 0 | 0.5 | 1 | 2 | 3 | 4 | N | % |
| 13- 25 years | M | 44 | 9 | 7 | 18 | 5 | 4 | 1 | 85 | 83.33 | 1.06 |
| F | 58 | 8 | 15 | 21 | 10 | 3 | 1 |
| Total | 102 | 17 | 22 | 39 | 15 | 7 | 2 |
Discussion
As dental fluorosis is increasing in the prevalence and severity, the increase in the consumption of fluoride from various sources, including foods and beverages is a matter of concern. There is substantial variation in the intake of different foods, foodstuffs and beverages and in the fluorine content of these products which makes difficult to precisely determine the total fluorine intake from the diet [11]. Fishes such as salmon, sardines and some sea foods contain high levels of fluoride. Dried sea food, which constitutes a significant part of diet in some cultures also contain high levels of fluoride (3-290 ppm) [12]. The high levels of fluoride in these products might be due to incorporation and accumulation of fluoride from environment into the fishes during the process of drying. The meat of fish has a fluoride content up to 2-5 mg/kg which is relatively low as compared to the fish protein concentrates which may contain up to 370 mg/kg. However, even with a comparative high fish consumption in a mixed diet, the fluoride intake from fish alone, rarely exceeds 0.2 mg of F per day [13]. Various studies [14–17] have reported the F content of skeletal bone and muscle in fishes. Our study presents a comprehensive overview of various forms of dietary fluoride intake mainly through the consumption of fishes and also the retention capacity of fluoride in the skeletal bone, muscle and skin amongst the most commonly consumed fishes. This study provides important new data towards the evidence base related to the F concentration of various fishes and the likely manifestations due to increased consumption of fluoride in the diet.
It is likely, that this higher fluoride content of the habitat in this part of India contributes to the elevated F content of the fish skin, muscle and bone. In agreement with this view it was observed that fish in certain environments can accumulate relatively large amounts of fluoride [18], and because of the same reason, Andhra Pradesh being a high fluoride prone belt in India, the fluoride concentration of water exceeds the optimal level, thus fishes also contain more amount of fluoride.
Evaluation by Community Index for Dental fluorosis (CFI) suggested that the fluorosis was of medium public health importance. The findings were somewhat similar to a study conducted [19] where the prevalence of fluorosis (TFI score, ≥1) was 100% at all the 4 different fluoride levels and the prevalence and severity increased with increased fluoride levels in drinking water.
Most foods have fluoride concentrations well below 0.05 mg/100g. Exceptions to this include teas, some marine fish, beverages and some infant formulas that are made or reconstituted with fluoridated water. More recent studies reported average fluoride values for fish close to 0.05 mg/100 g and a range of 0.01 to 0.17 mg/100 g [20]. In India, the occurrence of high fluoride in drinking water is reported from different parts of the states of Rajasthan, Gujarat and Andhra Pradesh. Genu Valgum commonly called knock knees which is a manifestation of systemic fluorosis was also reported first in Andhra Pradesh. It has been found through various studies that the major contributing factor for both systemic and dental fluorosis is fluoride present in drinking water. But fluoride taken through other forms such as dietary fluoride might be a contributing factor to some extent.
The total mean fluoride concentration of all the river fishes in skin, muscle and bone was less as compared to the sea water fishes. This can be attributed to increased fluoride content of sea water as there is increased availability of fluoride by leaching of the parent fluoride containing minerals with which these waters are in contact. Research also suggests that the “halo” effect of community water fluoridation, beverages and packaged/ canned foods especially fishes may result in a significantly greater intake of fluoride for people in non-fluoridated communities.
There is a belief prevailing in rural coastal Andhra communities that eating fish makes children more intelligent and sharp, which might be one of the reasons for including fishes as weaning foods, in the form of fish porridge in those communities. Fishes are a rich source of omega 3 fatty acids which are found in high concentrations in the brain, eyes and central nervous system. Thus in infants, along with fluoridated drinking water, fluoride through consumption of fishes might also contribute to some extent to the dietary intake. Further research is warranted to support the findings of the study.
An important issue to be considered is the bioavailability of fluorine. A study observed low bioavailability of fluoride from most solid foods, such as fish and algal flour and for mammalian fish bones which was attributed to the high calcium content of these products [21]. Thus, it is possible that it may contribute to some extent to the dietary fluorine intake. This should be tested in bioavailability experiments in humans, ideally, or in vitro, simulating the gastric conditions. Also, the presence of food bolus when fluorine is ingested may increase the degree of fluorine absorption by the stomach by increasing the residence time [22].
A crucial factor for the development of fluorosis, is the critical period of fluorine exposure. Enamel fluorosis can occur as a result of an acute or chronic exposure to fluorine during amelogenesis. The characteristic feature of fluorosed enamel is the retention of amelogenins in the early-maturation stage of tooth development and is manifested by the formation of more porous enamel with subsurface hypomineralization [11]. During amelogenesis, the tooth when chronically exposed to low-dose fluoride results in development of the double-response lines, formed at the secretory stage. Posteruptive defects after a single high plasma peak level of fluoride are deep and shallow pits that result from sub-ameloblastic cysts formed by damaged early- and late-secretory ameloblasts [23].
Limitations
One of the limitations of this study is that the nature of this study was cross–sectional study, which prohibited the ability in drawing inferences about causal relationships. The role of diet and other sources of fluoride are not recorded in the present study. But a well known fact remains that majority of the fluorosis occurs as a result of consumption of drinking water. However, fishes high in fluoride content taken over a period of time can also be a contributing factor to fluorosis. Climatic conditions prevalent in the area, where the study was conducted which could have an influence on water consumption were not recorded.
Further research and long term studies are needed to assess the fluoride levels in the skin, muscle and bone tissues of fishes using other methods for fluoride analysis. More information is required on the intake of fish and the dietary sources of fluorides by different populations and age groups, especially in countries like India with a large endemic fluorosis belt. Studies are needed to define the effects of metabolic and environmental variables on the absorption, excretion, retention and biological effects of fluoride due to consumption of these fishes.
Conclusion
Our study illustrates the fact that fluoride is not homogeneously distributed in the bodies of fishes. Bone tends to accumulate more amount of fluoride followed by muscle and skin due to increased permeability of the hard tissues and the chemical trapping of fluoride. Thus, the amount of fluoride present in fishes is directly related to the amount of Fluoride in the habitat they live in. Also fluoride shows more affinity towards the hard calcified tissues resulting in higher concentration of fluoride in the bones. And the consumption of such fishes in the diet cooked in high fluoridated water results in greater intake of fluoride and might act as a contributing factor to fluorosis.