Introduction
Worldwide,15 million babies born in 2010 were born prematurely and more than one million died as a result of their prematurity [1]. Moreover, over 60% of preterm births occur in Africa and South Asia, Egypt is among the ten countries with the greatest number of preterm births [2]. According to the world wide statistics of 2012, preterm births are more likely to occur in the context of multiple births which partially explained due to the wide use of fertility treatments, and a greater number of older women bearing children [3]. Assessing neonatal illness severity is an important issue in the Neonatal Intensive Care Unit (NICU) and estimating the risk of in-hospital mortality in the NICU environment provides important information for health-care quality control, management studies and rational use of resources [4], hence the importance of using the standardized comparisons of outcomes to be performed across health care facilities [5]. Scoring systems are means to quantify clinical states that are difficult to be summarized by other subjective or objective means [6]. Scoring systems and risk prediction rules are tools to quantify the severity of clinical condition and stratify patients according to a specified outcome. In intensive care medicine, the complexity and number of clinical scoring systems is increasing as the utility in services research and clinical medicine broadens [7]. Different tools for assessing and predicting mortality risk among neonates have been developed to overcome the problems imposed by the difference in birth weight, varied causes of neonate mortality, varied pattern of care given at the neonatal units, and other risk factors predispose to neonatal mortality. Of these tools are Clinical Risk Index for Babies (CRIB), CRIB II (An update of the clinical risk index for babies score), Score for Neonatal Acute Physiology (SNAP), SNAP Perinatal Extension (SNAP-PE), SNAP II, and SNAPPE-II [8]. These scoring systems help in predicting mortality and morbidity and may improve the validity of assessing the outcome among different hospitals and units [9]. CRIB II score is a validated measure of initial mortality risk and illness severity within one hour of admission. It takes into account the birth weight, gestational age, body temperature, base excess and sex of the baby to determine initial mortality risk [10]. The CRIB II score ranged from 0 to 27, with better prognosis with lower scores attained the best favourable results with score of one [11]. Survival of neonates in the ICU is dependent on the ability and experience of the working intensive care doctors to apply the suitable prognostic tools [12]. Subsequently this study aimed at improving the survival of LBW babies admitted to NICU's through early prediction of factors that may increasing their vulnerability to early neonatal mortality, and the objectives of this study were to validate and calibrate the CRIB II score in predicting the neonatal mortality in preterm neonates ≤32 weeks gestational age at the neonatal intensive care unit (NICU) of Kasr El-Aini hospital, Cairo University, and to compare the CRIB II score in survivors and non-survivors with observing the outcome along the different CRIB II score levels.
Materials and Methods
Setting and Design
A prospective cohort study included 113 neonates who were admitted during their first 24 hours of birth to the NICU at Kasr El-Aini hospital, Cairo University through a time period extending from November 2013 till May 2014.
Inclusion criteria: All preterm neonates of both sexes with 23 to 32 weeks gestational age, admitted to the NICU.
Exclusion criteria: All preterm neonates with birth weight <500 grams, major congenital anomalies, genetic disorders, with surgical emergencies, delivery room deaths or admission after 12 hours of birth.
Data collection: the following data set were collected including:
1. Obstetric history of mothers, to know time of delivery, and gestational age in weeks, calculated from the first day of last menstrual period (LMP).
2. Neonatal data for:
a. Gestational age assessment using New Ballard score, in cases with undefined LMP [13].
b. Sex of the neonate and birth weight (in grams): recorded for each baby on admission using an electronic scale.
c. Admission temperature: recorded rectally.
d. Laboratory Examination: Arterial blood gas analysis for all babies during first hour of admission to estimate base excess.
3- Calculation of CRIB II score for each baby was done using the following variables: gender, gestational age (in weeks), birth weight (in grams) and base excess. The total CRIB II score was calculated (Ranged from 0 to 27). The scores were further classified into four levels as follows, Level 1:0 to 5, Level 2:6 to 10, Level 3:11 to 15 , Level 4 above 15 [11].
Statistical Analysis
Data entry and analysis was carried out using the Statistical Package of Social Science Software program, version 21 (SPSS). Quantitative variables were expressed using mean, standard deviation, median and interquartile range (IQR), while for qualitative variables, frequency and percentage were reported. Comparison between survivors and non-survivors was performed using independent sample t-test or Mann-Whitney test for quantitative variables and Chi-square test with Fisher’s-exact test for qualitative ones as properly indicated.
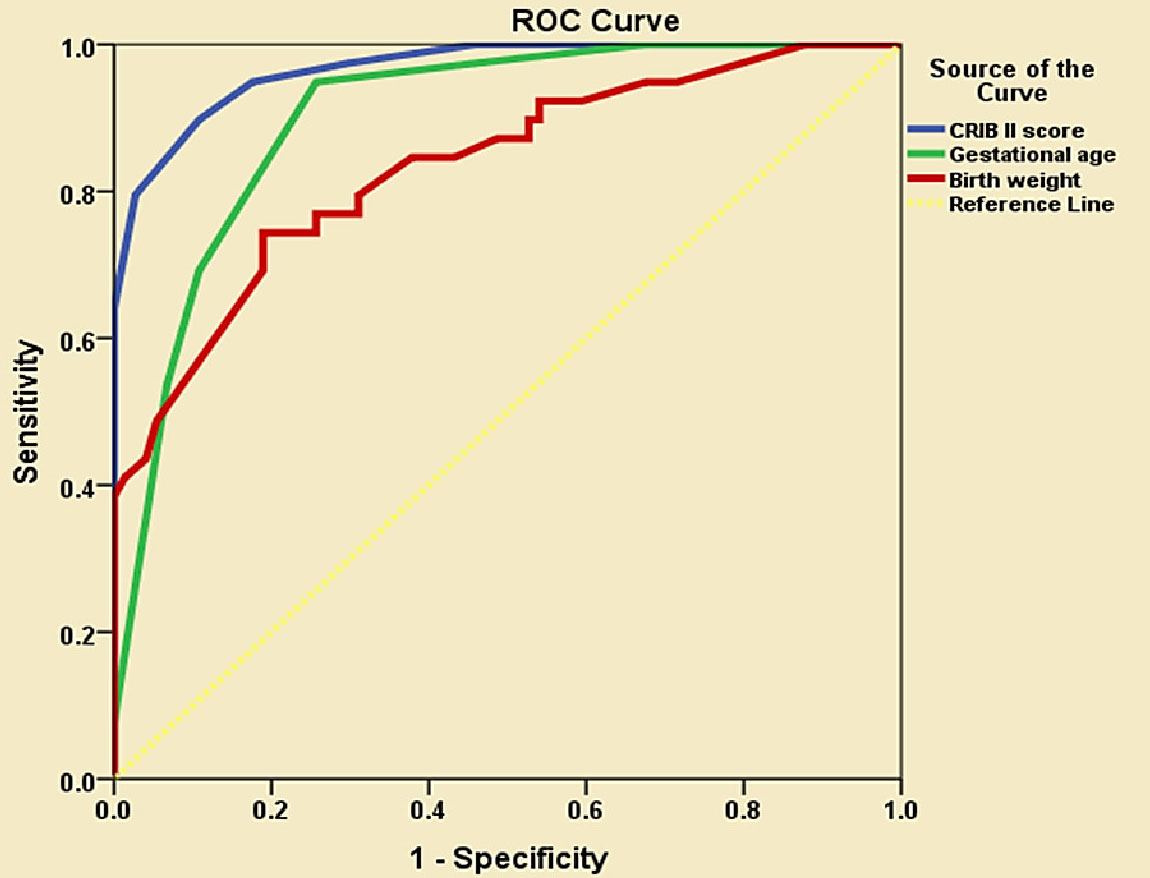
Receiver operating characteristic (ROC) curve analysis with associated area under the curve (AUC) was conducted to explore the discriminate ability of CRIB II score, gestational age and birth weight in predicting NICU mortality with selection of the most suitable cut-off point of each parameter with the best sensitivity, specificity, positive predictive value (PPV), negative predictive value (NPV) and overall accuracy. The Hosmer–Lemeshow test for goodness of fit was performed to calibrate CRIB II score in predicting mortality. Cox regression model was designed considering the time element in predicting mortality by CRIB II score with generating of the hazard ratio (HR) with 95% confidence intervals. Kaplan Meier survival analysis was done to explore the mortality pattern by time. p-values < 0.05 were considered statistically significant.
Ethical consideration: Approval was obtained from both paediatric department council and, head of the neonatology department. Verbal consent was taken from the Parents of the involved neonates. The study was approved by Cairo University research ethics committee. All procedures, included individual data were treated with confidentiality following Helsinki Declaration.
Results
One hundred and thirteen babies were enrolled in this study, 58 (51.3%) were males and 55 (48.7%) were females [Table/Fig-1]. Non-survivors represented 39 (34.5%) while survivors represented 74 (65.5%).According to CRIB II score babies were classified into 4 groups:
- Level 1 (CRIB II score from 1 to 5) were 21 (18.6%).
- Level 2 (CRIB II score from 6 to 10) were 42 (37.2%).
- Level 3 (CRIB II score from 11 to 15) were 41 (36.3%).
- Level 4 (CRIB score more than 15 were 9 (8.0%).
CRIB II score of the studied neonates ranged from 1 to 19 with mean 9.9 ± 4.0 (median 10, IQR 7-13). The gestational age ranged from 25 to 32 weeks with the mean of 28.7 ± 2.1 weeks (median 29, IQR 27-30). The birth weight ranged from 700 to 1500 gm with the mean of 1134.5 ± 202.0 gm (Median 1100, IQR 1000-1300). Temperature ranged from 31 to 37 Celsius with the mean of 34.6 ± 1.4 Celsius (Median 35, IQR 34-36). Base excess ranged from -23 to 0 with the mean of -11.5 ± 6.0, (median -10,IQR -17.5 to -4), and the length of stay ranged from 2 to 62 days with median length of stay of 22 days.
There was no significant differences between males and females regarding mortality, (p= 0.2) [Table/Fig-2]. Mortality was significantly associated with lower gestational age, birth weight, temperature, length of stay (LOS), higher base excess and CRIB II score.
[Table/Fig-3] showed a progressive increase in mortality with increasing CRIB II score level; mortality was 0 (0%), 2 (4.8%), 28 (68.3%) and 9 (100%) in level I, II, III and IV CRIB II score respectively. As shown in [Table/Fig-4]; area under the curve (AUC) was 0.968 (95% CI=0.940-0.996) p<0.001, 0.900 (95% CI=0.844-0.957) p<0.001, and 0.834 (95% CI=0.753-0.914) p<0.001 for CRIB II, gestational age and birth weight respectively, Also, ROC curve analysis revealed that the most suitable cut-off points in predicting mortality (the best sensitivity and specificity) were ; ≥ 11 for CRIB II score, ≤ 28 for gestational age, ≤ 1100 for birth weight.
Using the suitable cut off points, the following findings were observed [Table/Fig-5]: CRIB II score and gestational age, showed higher sensitivity and Negative Predictive Value (NPV) in comparison to birth weight. CRIB II score showed the highest specificity (82.4%) followed by gestational age (74.3%) and birth weight (68.9%). CRIB II score showed the highest positive Predictive Value (PPV) (74.0%) followed by gestational age (66.1%) and birth weight (57.4%). The highest Accuracy (the proportion of true results, both true positives and true negatives) was obtained by CRIB II score (86.7%) followed by gestational age (81.4%) and birth weight (72.5%). Hosmer-leme show of goodness of fit test was done to calibrate CRIB II score and revealed that (p-value) was 0.952 which is > 0.1. [Table/Fig-6] Cox regression analysis for CRIB II score was done to predict mortality, the model was significant (p-value <0.001) with hazard ratio 1.479 (95% CI 1.334-1.639).
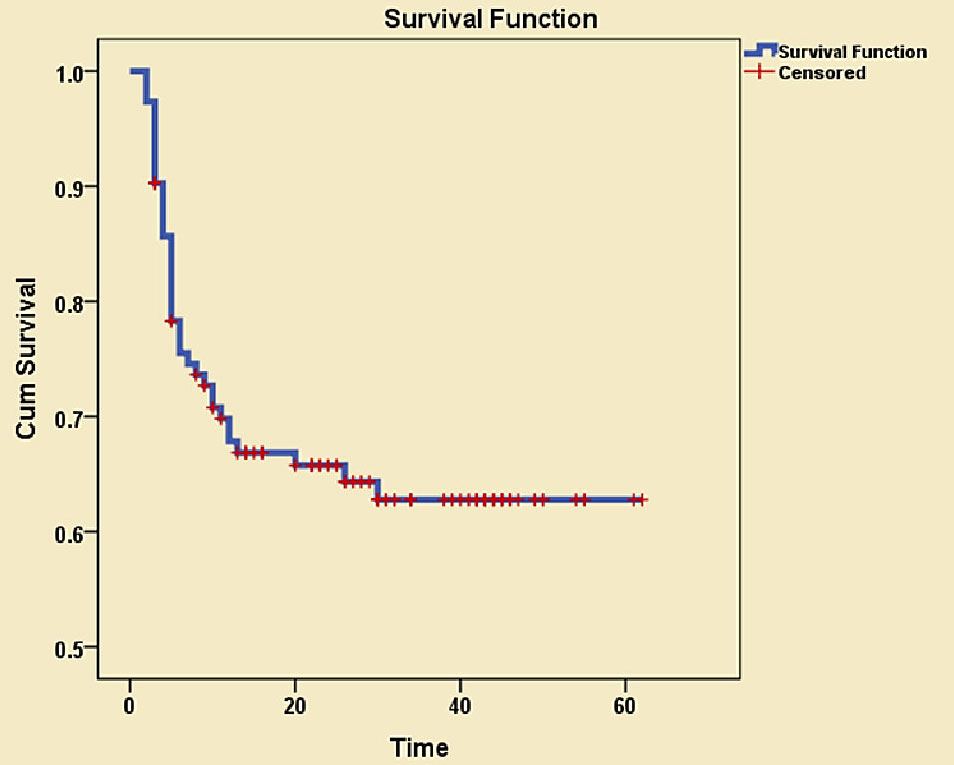
As shown in the Neonatal survival curve [Table/Fig-7], the highest mortality rate was in the first few days, and then the mortality showed slow progression to be stationary at day 30.
Discussion
Preterm birth is the major direct cause of neonatal deaths, responsible for about 35% of the world's 3.1 million deaths a year, and the second most common cause of under five deaths following pneumonia [14]. Premaure births are outnumbered by males with higher susceptablity of mortalitity [15]. This finding is consistent with results of the current study where male to female cases were 1.1:1 respectively, with higher mortality in males. A valid Timeand simple method of risk-adjustment for neonatal intensive care is important to ensure accurate assessment of quality of care [10]. This study revealed positive associations between the gestational age, the birth weight and the mortality; the lower the gestational age, birth weight the higher the mortality. This was proved to be statistically significant (p-value <0.001). This is in agreement with a study done for neonatal mortality risk assessment in a NICU in University of Tehran for 213 newborns where it was found that the birth weight and the gestational age were significantly related to neonatal deaths (p=0.02), (p=0.03) respectively [16]. While another study reporting that birth weight and gestation were responsible for a wide range of late neonatal mortality of 11 to 60% [17]. However, in similar study from an NICU in a general hospital in Porto Algere, Southern Brazil included 494 newborns admitted immediately after delivery; birth weight has been used, for many years, as a mortality risk indicator for newborn neonates. The birth weight was found to be the indicator that least able to predict neonatal mortality [18].
The study results, showed a statistical significant correlations (p-value <0.001) between CRIB II score and the outcome. Survivors had a mean CRIB II score of less than non-survivors. This study compares well with a study done in Italy on 720 preterm babies in 2004 which found a mean CRIB II score of (7) for survivors while non-survivors had a mean CRIB II score of (14) [19]. CRIB II score for predicting severity of illness found to be strongly correlated with the length of hospital stay (LHS), and it was better than other independent variables such as birth weight, gestational age, base excess and temperature at admission in predicting mortality [20]. This was reported in this study in the results for variables of LHS (range 2-62 days), base excess (-23-0) and temperature (31-37).
In the current study, CRIB II score as tool predicting neonatal mortality was quantified using the ROC curve. CRIB II score was found to predict mortality better than birth weight and gestational age with relatively high accuracy of (0.968, 0.900 and 0.834) for score, birth weight and gestational age respectively. In addition, we found that the highest accuracy (the proportion of true results, both true positives and true negatives) was obtained by CRIB II score (86.7%) followed by gestational age (81.4%) and birth weight (72.5%), which means that CRIB II score was the best discriminate parameter for neonatal mortality.
A study included 135 baby at the NICU of Kenyatta National Hospital, found a sensitivity of (80.6%), best predictive value (77.7%) and specificity (75.0%) on using a cutoff point of 4, lower sensitivity value (32.3%) was obtained on using a cutoff point of 10 [21]. The current study showed a higher CRIB II score cutoff point with higher sensitivity and specificity. The difference between this study and the ours can be explained in the lights of using lower mean CRIB II score in comparing survivors and non survivors (3.7 vs. 7.7) in survivors and (7.7 vs. 14.1) in non survivors. The mortality rate was lower in the current study (34.5%) compared Kenyatta hospital study (45.9%) which may indicate better management and outcome in Kasr El-Aini NICU. Moreover, the sensitivity, specificity and predictive values for CRIB II score were found to be better than any of the traditional models separately and the area under the ROC curve for predicting death was greater for CRIB II score than for birth weight or gestational age alone.
In a study done in Italy for comparing the ability of CRIB, CRIBII, and SNAPPE-II scoring systems in predicting neonatal mortality for 720 preterm baby > 1500 gm weight, who were admitted to 12 neonatal units in Lombardy, Italy. AUC for CRIB, CRIB-II, and SNAPPE-II scoring systems were found to be (0.90, 0.91, 0.84) respectively. It was reported that CRIB II score had the greatest ability of mortality prediction in comparison to CRIB and SNAPPE-II [19]. Comparative analysis between the four levels of CRIB II score for our hospital mortality showed a progressive increase in mortality with increasing CRIB II score level. The previous CRIB II score level results showed better outcome in comparison to Kenyatta study results which were 18 (22%), 30 (79%), 14 (93%) [21].
This study showed that babies of level 3 and 4 CRIB II score had the highest incidence of mortality; these groups deserve special attention, since greater efforts are necessary to reduce their mortality rate. Hosmer-lemeshow of goodness of fit test was done to calibrate CRIB II score and to test the difference between observed and expected outcome, There was no significant difference between expected and observed outcome (p= 0.952) in comparison to 0.829 and 0.600 in the study of Parry et al., [10] and Rastogi et al., [22] respectively, which means that in the current study CRIB II score showed better calibration to predict neonatal mortality.
In this study, the highest mortality rate was in the first few days, this was in consistent with the results reveled form another study based on information from the National Inpatient Sample Database from 1997 to 2004 that included 115,350 very LBW Egyptian infants, reported that about 50% of death during birth hospitalization occurred in the first three days after delivery [23]. Based on the study results, it is noted that CRIB II score is a better predictor of neonatal mortality compared to birth weight and gestational age independently. It is also found to be applicable and therefore should replace the traditional models as the predictor of neonatal outcome. This is in agreement with several other studies [10,19,21,22].
Descriptive data of the studied neonates
| Variables | Description (n=113) |
|---|
Sex n, %
Male Female
| 58 55
| 51.3 48.7
|
Mortality n, %
Non-survivor Survivor
| 39 74
| 34.5 65.5
|
CRIB II score
Range, Mean ± SD Median, IQR
| 1.0 - 19.0 10.0
| 9.9 ± 4.0 7.0 - 13.0
|
CRIB II score levels n, %
Level I (1 - 5) Level II (6 - 10) Level III (11 - 15) Level IV (> 15)
| 21 42 41 9
| 18.6 37.2 36.3 8.0
|
Gestational Age (weeks)
Range, Mean ± SD Median, IQR
| 25.0 - 32.0 29.0
| 28.7 ± 2.1 27.0 - 30.0
|
Weight (gm)
Range, Mean ± SD Median, IQR
| 700.0 - 1500.0 1100.0
| 1134.5 ± 202.0 1000.0 - 1300.0
|
Temperature (Celsius)
Range, Mean ± SD Median, IQR
| 31.0 - 37.0 35.0
| 34.6 ± 1.4 34.0 - 36.0
|
Base Excess
Range, Mean ± SD Median, IQR
| -23.0 - 0.0 -10.0
| -11.5 ± 6.0 -17.5 - -7.4
|
Length of stay
Range, Mean ± SD Median, IQR
| 2.0 - 62.0 22.0
| 22.4 ± 16.8 5.0 - 38.5
|
Comparison between survivors and non-survivors regarding important parameters
| Variables | Non-survivor (n=39) | Survivor (n=74) | P-value |
|---|
Sex n, %
Male Female
| 24 (61.5) 15 (38.5)
| 34 (45.9) 40 (54.1)
| 0.2 NS
|
Gestational Age (weeks)
Range Mean ± SD Median
| 25.0 - 30.0 26.8 ± 1.2 26.0
| 26.0 - 32.0 29.6 ± 1.8 30.0
| <0.001 S
|
Weight (gm)
Range Mean ± SD Median
| 700.0 - 1400.0 987.9 ± 167.3 1000.0
| 950.0 - 1500.0 1211.7 ± 174.7 1214.0
| <0.001 S
|
Temperature (Celsius)Range
Mean ± SD Median
| 32.0 - 37.0 33.4 ± 1.3 33.0
| 31.0 - 37.0 35.2 ± 1.1 35.0
| <0.001 S
|
Base Excess
Range Mean ± SD Median
| -23.0 - -8.0 -17.1 ± 3.7 -18.0
| -21.0 - 0.0 -8.6 ± 4.8 -8.0
| <0.001 S
|
CRIB II score
Range Mean ± SD Median
| 9.0 - 19.0 14.1 ± 2.1 14.0
| 1.0 - 13.0 7.7 ± 2.9 8.0
| <0.001 S
|
LOS
Range Mean ± SD Median
| 2.0 - 30.0 7.1 ± 6.2 5.0
| 3.0 - 62.0 30.5 ± 14.9 30.0
| <0.001 S
|
Outcome of CRIB II score levels among studied neonates
| Variables | Non-survivor (n=39) | Survivor (n=74) |
|---|
| N | % | N | % |
|---|
| CRIB II score |
| Level I (1 - 5) | 0 | 0.0 | 21 | 100.0 |
| Level II (6 - 10) | 2 | 4.8 | 40 | 95.2 |
| Level III (11 - 15) | 28 | 68.3 | 13 | 31.7 |
| Level IV (> 15) | 9 | 100.0 | 0 | 0.0 |
ROC curve for prediction of hospital neonatal mortality by CRIB II score, birth weight and gestational age
Screening analysis of CRIB II score, gestational age and birth weight in predicting mortality using the most suitable cut-off point
| Cut-off point | Sensitivity | Specificity | PPV | NPV | Accuracy |
|---|
| CRIB II score | ≥ 11 | 94.9% | 82.4% | 74.0% | 96.8% | 86.7% |
| GA | ≤ 28 | 94.9% | 74.3% | 66.1% | 96.5% | 81.4% |
| Birth weight | ≤ 1100 | 79.5% | 68.9% | 57.4% | 86.4% | 72.5% |
| Beta coefficient | p-value | HR | 95% CI of HR |
|---|
| CRIB II score | 0.391 | <0.001 | 1.479 | 1.334 - 1.639 |
Neonatal Survival curve in relation to Time
Limitations of the study
The results of the current study should be interpreted in the lights of the following limitations mainly the small sample size with the limited number of neonates with gestational age ≤ 32 weeks.
Conclusion
CRIB II score as tool predicting neonatal mortality is an accurate measure to assess mortality among Egyptian neonates, and it should be implemented as an essential component of routine care to all neonates admitted to NICUs.
[1]. H Blencowe, S Cousens, MZ Oestergaard, D Chou, AB Moller, R Narwal, National, regional, and worldwide estimates of preterm birth rates in the year 2010 with time trends since 1990 for selected countries: a systematic analysis and implicationsLancet 2012 379(9832):2162-72. [Google Scholar]
[2]. BE Hamilton, JA Martin, MJK Osterman, SC Curtin, Births: Preliminary data For 2013National Vital Statistics Reports 2014 63(2):1-34. [Google Scholar]
[3]. JA Martin, BE Hamilton, MJK Osterman, SC Curtin, TJ Matthews, Births: final data for 2012Natl Vital Stat Rep 2013 52(9):1-68. [Google Scholar]
[4]. BE Fleisher, L Murthy, S Lee, JC Constantinou, WE Benitz, DK Stevenson, Neonatal severity of illness scoring systems: a comparisonClinPaediatr (Phila) 1997 36(4):223-37. [Google Scholar]
[5]. L Sutton, GP Sayer, B Bajuk, V Richardson, G Berry, DJ Henderson-Smart, Do very sick neonates born at term have antenatal risks? 1. Infants ventilated primarily for problems of adaptation to extra-uterine lifeActa Obstet Gynecol Scand. 2001 80(10):905-16. [Google Scholar]
[6]. DG Altman, P Royston, What do we mean by validating a prognostic model?Stat Med 2000 19(4):453-73. [Google Scholar]
[7]. MM Pollack, MA Koch, DA Bartel, I Rapoport, R Dhanireddy, AA El-Mohandes, A comparison of neonatal mortality risk prediction models in very low birth weight infantsPaediatrics 2000 105(4):1051-57. [Google Scholar]
[8]. PW Fowlie, CRIB in relation to nosocomial bacteraemia in VLBW or pretermArch Dis child 1996 75:149-52. [Google Scholar]
[9]. A Vasudevan, A Malhotra, R Lodha, SK Kabra, Profile of neonates admitted in paediatric ICU and validation of Score for Neonatal Acute Physiology (SNAP)Paediatr 2006 43(4):344-48. [Google Scholar]
[10]. G Parry, J Tucker, W Tarnow-Mordi, CRIB II: an update of the clinical risk index for babies scoreLancet 2003 361(9371):1789-91. [Google Scholar]
[11]. AS Brito, T Matsuo, MR Gonzalez, AB Carvalho, LS Ferrari, Rev Saude PublicaTeratology 2003 37(5):597-602. [Google Scholar]
[12]. W Meadow, L Frain, Y Ren, G Lee, S Soneji, J Lantos, Serial assessment of mortality in the neonatal intensive care unit by algorithm and intuition: certainty, uncertainty, and informed consentPaediatrics 2002 109(5):878-86. [Google Scholar]
[13]. JL Ballard, JC Khoury, K Wedig, L Wang, BL Eilers-Walsman, R Lipp, New Ballard Score, expanded to include extremely premature infants.J Paediatr 1991 119(3):417-23. [Google Scholar]
[14]. L Liu, HL Johnson, S Cousens, J Perin, S Scott, JE Scott, NH Lawn, Global, regional, and national causes of child mortality: an updated systematic analysis for 2010 with time trends since 2000Lancet 2012 379(9832):2151-61. [Google Scholar]
[15]. J Zeitlin, MJ Saurel-Cubizolles, J Mouzon, L Rivera, PY Ancel, B Blondel, Fetal sex and preterm birth: are males at greater risk?Hum Reprod 2002 17(4):2762-68. [Google Scholar]
[16]. M Kadivar, S Sagheb, F Bavafa1, L Moghadam, B Eshrati, Neonatal Mortality Risk Assessment in a Neonatal Intensive Care Unit (NICU)Iran J Ped 2007 17(1):325-31. [Google Scholar]
[17]. C Grandi, JL tapia, G Marshall, Grupo Colaborativo NEOCOSUR. An assessment of the severity, proportionality and risk of mortality of very low birth weight infants with fetal growth restriction. A multicenter South American analysis J Paediatr(Rio J) 2005 81(3):198-204. [Google Scholar]
[18]. SZ Mariani, SP Renato, Comparison between different mortality risk scores in a neonatal intensive care unitREV SaudePublica 2003 37(5):597-602. [Google Scholar]
[19]. L Gagliardi, A Cavazza, A Brunelli, M Battaglioli, D Merazzi, F Tandoi, Assessing mortality risk in very low birthweight infants: a comparison of CRIB, CRIB-II, and SNAPPE-IIArch Dis Child Fetal Neonatal Ed 2004 89(5):F419-22. [Google Scholar]
[20]. P Lago, F Freato, T Bettiol, Is CRIB score a valid tool in predicting neurodevelopmental outcome in ELBW infants?Biology of the Neonate 1999 76:220-27. [Google Scholar]
[21]. IK Marete, AO Wasunna, PA Otieno, Clinical risk index for babies (CRIB) II score as a predictor of neonatal mortality among low birth weight babies at Kenyatta National HospitalEast Afr Med J 2011 88(1):18-23. [Google Scholar]
[22]. PK Rastogi, V Sreenivas, N Kumar, Validation of CRIB II for prediction of mortality in premature babiesIndian Paediatr 2010 47(2):145-47. [Google Scholar]
[23]. MA Mohamed, A Nada, H Aly, Day-by-day postnatal survival in very low birth weight infantsPaediatrics 2010 126(2):e360-66. [Google Scholar]