QT interval is the interval between the onset of QRS complex, which represents ventricular depolarisation, and the end of T-wave which represents ventricular repolarisation. The variability of QT interval with heart rate, age and gender limits its clinical utility. To overcome this drawback, the heart-rate corrected QT interval (QTc) is used. The QTc interval depends largely on cardiac repolarization since the duration of cardiac depolarization is fairly constant in the normal heart [1]. Slower cardiac repolarization manifests in the ECG as longer QTc interval, and therefore factors that prolong cardiac repolarization, like serum electrolytes and certain drugs, also prolong the QTc [2]. QTc can be derived by applying various formulae like Bazetts, Fridericia, Framingham and Hodges but the Bazetts formula is considered the best when the heart rate is within physiological limits [3].
QTc at rest as well as during exercise has many clinical implications. It has significant direct correlation with various risk factors of atherosclerotic diseases [4]. QTc is prolonged with larger dispersion in diabetes of all age groups [5–7] and has proven to be an independent predictor of cardiovascular mortality in individuals with type 1 and type 2 diabetes mellitus [6,8,9]. It also predicts the risk of developing diabetes mellitus in healthy adults [5].
Dynamic and static exercises refer to aerobic and resistance exercises respectively. These exercises when performed for a short duration or on a regular basis have varying effects on heart. The changes in cardiovascular parameters associated with these exercises have been well studied but electrocardiographic changes especially QTc interval have not been compared. To standardize the exercise and for comparison, the intensity of both types of exercise was kept as sub-maximal.
Excessive QTc prolongation during dynamic exercise presages cardiovascular events like ischemic disease, supraventricular arrhythmias and the long QT syndrome [10]. QTc is prolonged after dynamic exercise in normal males and females [11,12]. Makarov et al., have shown QTc to increase after graded exercise test in healthy adolescents aged 11-15 years [12]. There are fewer studies on the effect of static (hand-grip) exercise on QTc [13,14]. Moreover, there are no studies that have compared the relative effects of dynamic and static exercise.
According to our hypothesis, since dynamic and static exercises are associated with similar cardiovascular responses, the effect on QTc would be the same and akin to dynamic exercise, static exercises can also be used to assess the cardiovascular fitness of an individual. In this study, QT interval was measured and QTc derived/calculated in young men at rest and also assessed how it is further modulated by submaximal dynamic and static exercises.
Materials and Methods
The study was conducted in healthy young men (n-30, age-18-22 years) randomly selected from the male students of our institute. Number of subjects were calculated by nMaster 2.0 software (KMC, Vellore) using the formula:

where N: required sample size, Z1-α/2: Z is a constant set by convention according to the accepted α error, Z1-β: Z is a constant set by convention according to power of the study, μ1: Pre-test mean, μ2: Post-test mean, σ1: Standard deviation in the pre-test, σ2: Standard deviation in the post-test, Δ: Effect size, α: significance level, 1-β: power.
Females were not included in the study due to the variations in QTc with the phases of menstrual cycle [13]. The study was commenced after obtaining clearance from the institutional ethical committee and the students who gave written consent were enrolled. Volunteers with frank cardiovascular or respiratory disease, congenital heart disease, or any signs or symptoms of the same were excluded from the study. Also, excluded were those with a history of chest pain or breathlessness, smoking, alcohol or tobacco intake or with a family history of longer QT syndrome, arrhythmias or sudden death were not included in the study.
Experimental Protocol
Before going through the experimental protocol, the subjects were familiarized with the experimental set-up and procedure of static and dynamic exercises. ECG recording was done using Power lab 4/35 (AD Instruments) and analysed on lab chart. To avoid the disturbances associated with limb movements, limb leads were placed in the torso throughout the experiment. To prevent variability of electrode placement and methodology, one technician carried out all ECG recordings. Blood pressure was measured using continuous non-invasive pressure monitor, CNAP-Monitor 500 (CN Systems). Measurements were done in conformity with the updated American Heart Association guidelines for BP measurements [15]. The ECG recording and arterial blood pressure (ABP) monitoring was done throughout the protocol but following recordings were taken for analysis:
Baseline (pre-exercise) recording of ECG and ABP after 10 minutes rest.
Post submaximal dynamic exercise (Post-SDE): ECG and ABP recording after performing standard Harvard step test.
Post submaximal static exercise (Post-SSE): ECG and ABP recording after performing hand-grip exercise.
The subject was asked to perform the Harvard step test by stepping up and down on a platform in a cycle of one step per two seconds. To ensure the desired rate of stepping, a metronome was used. The platform was at a height of about 40 cm. Such cycles were repeated till the desired heart rate was achieved. The heart rate was kept as 75% of the maximum attainable heart rate (MHR), which is empirically taken to be {220 – age in years} [16]. ECG recording and blood pressure were measured immediately after cessation of exercise.
After an hour’s rest, the subjects were asked to perform sustained isometric contraction of handgrip using a hand mechanical dynamometer: He was instructed to grip the dynamometer maximally with his dominant hand for a few seconds. The procedure was repeated thrice. The highest value of the three contractions was taken as the maximum voluntary contraction (MVC). A “submaximal intensity” of hand grip exercise was defined as the handgrip maintained steadily at 75% MVC till fatigue [17]. ECG and blood pressure were recorded within a minute of cessation of handgrip exercise. During the protocol, the subjects were instructed to terminate the exercise if they experienced fatigue, shortness of breath, wheezing, chest pain, leg cramps, ataxia, dizziness, or near-syncope and if at any time they desired to quit. The exercise was also to be terminated if there were an SBP-drop of 10 mmHg or more, abnormal ECG changes, signs of poor perfusion (cyanosis or pallor) or any technical difficulties in ECG or BP monitoring.
The QRS complex, PR interval, QT interval and RR interval were recorded using lead II. The measured QT interval was automatically corrected for heart rate by the ECG software using the formula of Bazett et al., {QTc=QT/RR1/2} [18].
Statistical Analysis
Statistical analysis was done using Graph pad Prism 5 software (California, USA). The baseline and post-exercise data were compared using paired t-test. A p-value <0.05 was taken to be statistical significant.
Results
The age of the subjects and the mean values of MHR and MVC for attaining submaximal dynamic and static exercise are given in [Table/Fig-1]. Since minute to minute variations are seen in HR and BP, the baseline parameters were recorded separately during both the protocols. There were statistically significant increases in HR, SBP, DBP and QTc interval after dynamic exercise in comparison to the baseline values (p<0.05). The values are given in [Table/Fig-2] and QTc represented in [Table/Fig-2&3].
Mean age of the subjects and basic criteria for submaximal dynamic and static exercise
| Age (years) | 18.8 ± 0.99 |
|---|
| MHR (bpm) | 201.2 ± 0.99 |
| 75% of MHR (submaximal dynamic exercise) in bpm | 150.9 ± 0.75 |
| MVC | 23.27 ± 4.6 |
| 75% of MVC (submaximal static exercise) | 17.45 ± 3.45 |
All values are Mean ± SD. MHR- Maximum attainable heart rate, MVC-Maximum Voluntary Contraction (MVC)
Baseline and post dynamic exercise values of cardiovascular and electrocardiographic parameters in the subjects
| Parameters | Baseline | Post dynamic exercise | p-value |
|---|
| HR (bpm) | 79.83 ± 11.60 | 155.3 ± 13.39**** | <0.0001 |
| SBP (mmHg) | 121.9 ± 10.76 | 155.7 ± 16.69**** | <0.0001 |
| DBP (mmHg) | 75.77 ± 7.85 | 81.13 ± 10.58** | 0.0024 |
| QT interval (sec) | 0.31 ± 0.04 | 0.25 ± 0.05**** | <0.0001 |
| QTc interval (sec) | 0.35 ± 0.04 | 0.40 ± 0.09* | 0.012 |
Data expressed as mean ± SD. Comparison of data between various parameters was done by paired t-test. The * represents comparison with baseline values;
* p < 0.05; ** p<0.01 **** p < 0.0001. HR- Heart Rate, SBP-Systolic Blood Pressure, DBP-Diastolic Blood Pressure, QTc-Heart rate corrected QT interval
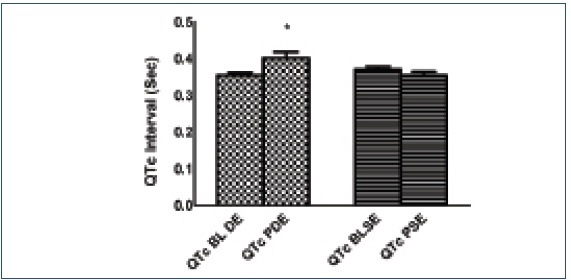
Baseline and post static and dynamic exercise QTc interval
‘*’is p<0.05 and represents significant post QTc interval value as compared to baseline value. All values are expressed as mean ± SD
Significant increase in HR was observed immediately after static exercise (p<0.05) when compared to baseline values. No significant changes were observed in other parameters (p>0.05) as shown in [Table/Fig-3,4].
Baseline and post static exercise values of cardiovascular and electrocardiographic parameters in the subjects
| Parameters | Baseline | Post static exercise | p-value |
|---|
| HR (bpm) | 89 ± 13.93 | 95.7 ± 18.73* | 0.064 |
| SBP (mmHg) | 123 ± 16.40 | 126.5 ± 17.24 | 0.25 |
| DBP (mmHg) | 75.70 ± 8.80 | 76.70 ± 9.17 | 0.41 |
| QT interval (sec) | 0.30 ± 0.04 | 0.29 ± 0.04 | 0.277 |
| QTc interval (sec) | 0.37 ± 0.94 | 0.36 ± 0.52 | 0.214 |
Data expressed as mean ± SD. Comparison of data between various parameters was done by paired t-test. The *represents comparison with baseline values;
*p < 0.05. HR- Heart Rate, SBP-Systolic Blood Pressure, DBP-Diastolic Blood Pressure, QTc-Heart rate corrected QT interval
Discussion
In our study, we measured heart rate corrected QT interval (QTc) at rest and also compared QTc changes after dynamic and static exercises in healthy young adults. The baseline QTc in this age group was found to be 0.36s and was as expected far below the western standards [5,19–21]. The duration of QTc interval is affected by the sympathetic and para sympathetic activity. Exercise and post exercise recovery periods are usually associated with withdrawal of parasympathetic activity. Significant prolongation of QTc was observed following dynamic exercise whereas following static exercise, the QTc was less than the baseline, though the difference was not significant.
Our finding is comparable to the findings of other authors [12,19, 22,23]. Ogedengbe et al., has showed significant prolongation of QTc in males after quasi dynamic exercise stress test by bicycle ergometer [20]. Similar to this, Makarov and co-workers have shown prolongation of QTc with graded exercise especially during first stage of exercise [12].
QTc prolongation is associated with higher risk of mortality in cardiac patients and also in general population. A prospective population study in individuals (48-64 year) found a high correlation between QT interval and cardiovascular mortality in both males and females [24]. In our study on young subjects, QT was significantly low at baseline in comparison to QTc in elderly population; we presume the age group not to be at risk of developing any cardiovascular disease (CVD). In Hisayama study conducted for Asian population in Japan, the risk of CVD, shock and coronary artery disease in group with QTc interval >440ms was 3.09-fold higher than that in the lowest group even after controlling for various confounding factors like age, hypertension, ECG abnormalities etc in men, whereas no association was found between QTc levels and risks of CVD in women [10]. In our case, the mean QTc was far below the risk level, it was 0.40 sec. Contrary to this, ARIC study has shown that women with prolonged QTc and normal QRS duration are at increased risk of CHD but not men [24].
Static exercises alter this electrographic parameter or not is a matter of debate. Very scanty and controversial information is available with regards to QTc and static exercise. In our study, we intended to investigate whether QTc interval is modulated by static exercise or not, we observed that QTc was not prolonged, rather post static exercise QTc was less than the baseline QTc, though the decrease was not significant. Recently another study, contrary to our findings, have documented prolongation of QTc after a period of isometric exercise [14].
The cardiovascular responses in both the types of exercises are the same, associated with high overload, increased sympathetic activity and vagal withdrawal. Intense sympathetic activity and vagal withdrawal lead to prolongation of QTc in submaximal dynamic exercise. A study by Poliana et al have shown that response of the heart rate during isometric (static) exercise depends on the intensity and duration of the contraction [25]. In our study, the sub-maximal intensity of static contraction maintained for a short period of time may not be strong enough to generate maximal vagal withdrawal and sympathetic over activity, so the HR and consequent QTc interval changes were not obvious.
From our study, we documented the prolongation of QTc after dynamic exercise with no effect after static exercise, emphasizing on the importance of post dynamic exercise QTc interval prolongation in screening patients of CAD, DM and other cardiac disorders, whereas the role of static exercise for the same remains controversial.
Conclusion
By carrying out this study that involves measuring resting and post exercise QTc in healthy young men, we gathered data on QTc in young men (18-22 years) who are not at risk of developing any cardiovascular disease at rest or after exercise. Significant increase in QTc interval was observed after dynamic exercise but no change in QTc was observed following static exercise and hence we conclude that static exercises may not be useful in assessing the cardiovascular status of an individual or in predicting cardiovascular events.
For further studies, it would be interesting to carry out the study in large number of subjects to: (a) assess the effects of maximal intensity of static exercise on QTc. (b) evaluate the chronic effects of static/resistance exercise training on ECG.
All values are Mean ± SD. MHR- Maximum attainable heart rate, MVC-Maximum Voluntary Contraction (MVC)
Data expressed as mean ± SD. Comparison of data between various parameters was done by paired t-test. The * represents comparison with baseline values;
* p < 0.05; ** p<0.01 **** p < 0.0001. HR- Heart Rate, SBP-Systolic Blood Pressure, DBP-Diastolic Blood Pressure, QTc-Heart rate corrected QT interval
Data expressed as mean ± SD. Comparison of data between various parameters was done by paired t-test. The *represents comparison with baseline values;
*p < 0.05. HR- Heart Rate, SBP-Systolic Blood Pressure, DBP-Diastolic Blood Pressure, QTc-Heart rate corrected QT interval