Recently, leptin has been of the spotlight for its protective role in the periodontium. The decreasing leptin level in GCF and gingival tissue was associated with a deteriorated periodontal status, and smokers also showed reduced GCF leptin levels in recent studies. This has led to the suggestion that clinically healthy tissue is “armed™ with pro-inflammatory host components to aid it in maintaining an infection-free periodontium [1]. Although there are numerous studies on the relationship between inflammation, leptin metabolism, and plasma leptin concentrations, there is little information available concerning the possible role of leptin in the progression of inflammation within human tissues, in particular, the gingiva.
Materials and Methods
A total number of 60 subjects, both males and females, between the ages of 30-50 years were selected from the outpatient pool in the Department of Periodontology at Meenakshi Ammal Dental College, Chennai, India. The study was conducted from January 2012 to August 2012.
Inclusion Criteria
Subjects with normal Body Mass Index according to the chart of the World Health Organization
Subjects with clinically healthy gingiva with no attachment loss
Subjects with chronic gingivitis with no attachment loss
Subjects with chronic periodontitis with attachment loss and radiographic evidence of bone loss.
Exclusion Criteria
Subjects with systemic diseases
Subjects who are taking medications affecting periodontal status
Subjects who have undergone periodontal therapy in the preceding 6 months
Subjects with aggressive periodontitis
Subjects who are smokers/ alcoholics
Subjects who are pregnant or lactating.
The selected subjects were divided into three groups based on modified gingival index (MGI) [2], clinical attachment level (CAL) and radiographic evidence of bone loss. Group I (Healthy Periodontium) consisted of 20 subjects with clinically healthy periodontium with MGI score of < 1 and no attachment loss (CAL=0). The intraoral periapical radiographs did not show any evidence of bone loss. Group II (Gingivitis) consisted of 20 subjects who showed clinical signs of gingival inflammation with MGI score of ≥ 1, and no attachment loss (CAL=0). The intraoral periapical radiographs did not show any evidence of bone loss. Group III (Chronic periodontitis) consisted of 20 subjects who showed clinical signs of gingival inflammation and attachment loss with MGI score of ≥ 1 and CAL ≥ 2 mm (according to AAP International Workshop for Classification of Periodontal Diseases, 1999). The intraoral periapical radiographs showed the presence of bone loss.
Ethical clearance for the study was obtained from the ethical committee of the MAHER University. The patients were explained about the study and written informed consent was obtained from those who agreed to voluntarily participate in this study.
Clinical Evaluation of Subjects
Subjects were selected for each group after a brief case history recording which included patient’s chief complaint, medical and dental history, oral and radiographic examination. Following this, all the clinical measurements were recorded.
Initially, the subjects were seated comfortably in an upright position on the dental chair and the area to be examined was well-illuminated. A sterile mouth mirror and William’s graduated periodontal probe were used to clinically examine the periodontal status. Clinical measurements recorded were MGI and CAL. Intraoral periapical radiographs were then taken to assess for evidence of bone loss. GCF was collected by the same examiner on the following day, to prevent contamination of the sample with blood associated with the probing of inflamed sites. GCF was collected during outpatient timings, from 10:00 AM to 1:00 PM. Each sample collection took an average of 5-20 min. Test site for GCF sample collection was based on the highest scored sites in the oral cavity i.e., the site showing most severe inflammatory signs (in gingivitis cases) or greater amount of attachment loss (in chronic periodontitis cases). In the healthy group, to standardize site selection, sampling was predetermined to be from the mesio-buccal region of the maxillary right first molar or in its absence the maxillary left first molar.
Collection of GCF
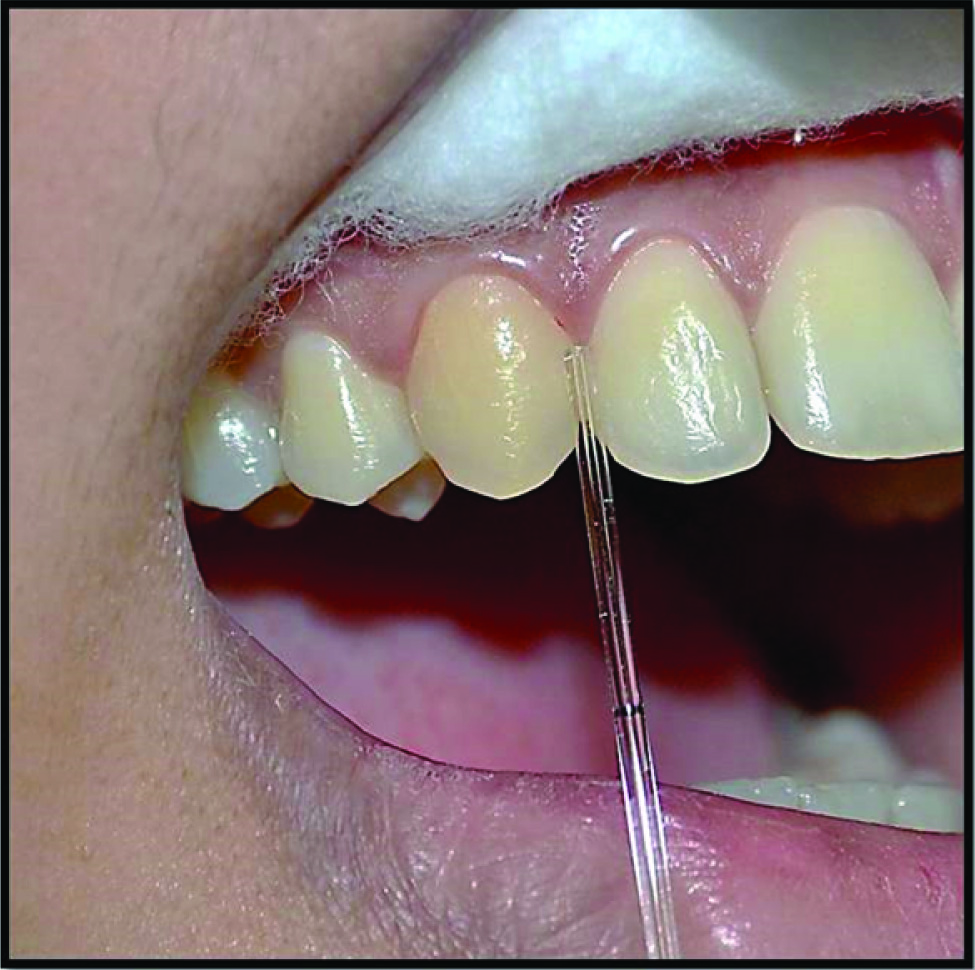
Based on the inclusion criteria, the selected patients were informed of the time and non-invasive nature of GCF collection as well as its significance regarding the study being undertaken. Patients were instructed to avoid taking food, chewing gums and refrain from brushing their teeth one hour prior to GCF collection. All the patients were extremely willing and cooperative to participate in the study. After making the subjects sit comfortably in an upright position on the dental chair with adequate illumination, the selected test site was isolated with cotton rolls. Without touching the marginal gingiva, the supragingival plaque was removed with a curette to avoid contamination of the GCF sample and blocking of the microcapillary pipette. The crevicular site was then dried gently with an air syringe. Then GCF was collected using the white color-coded 1-5μl calibrated volumetric microcapillary pipette. The tip of the microcapillary pipette was placed extra crevicularly (unstimulated) for 5-20 min and a standardized volume of 1μl GCF was collected using the calibration on the microcapillary pipette [Table/Fig-1].
After collection of the GCF, the sample was assigned to a particular group based on the recorded MGI scores, CAL and radiographic bone loss. The test sites which did not express standardized volume (1μl) of GCF were excluded from the study and the micropipettes contaminated with blood or saliva also were discarded. The GCF collected was immediately transferred to a plastic vial (Eppendorf tube) and stored at -70°C till the time of the assay.
Method of Estimation of Leptin
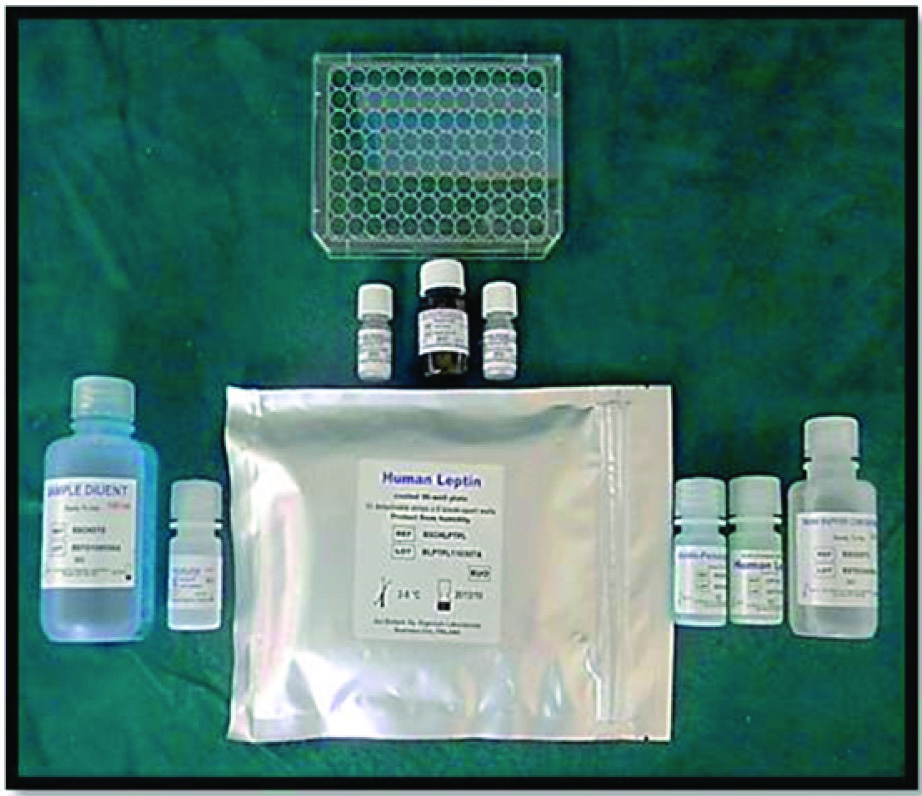
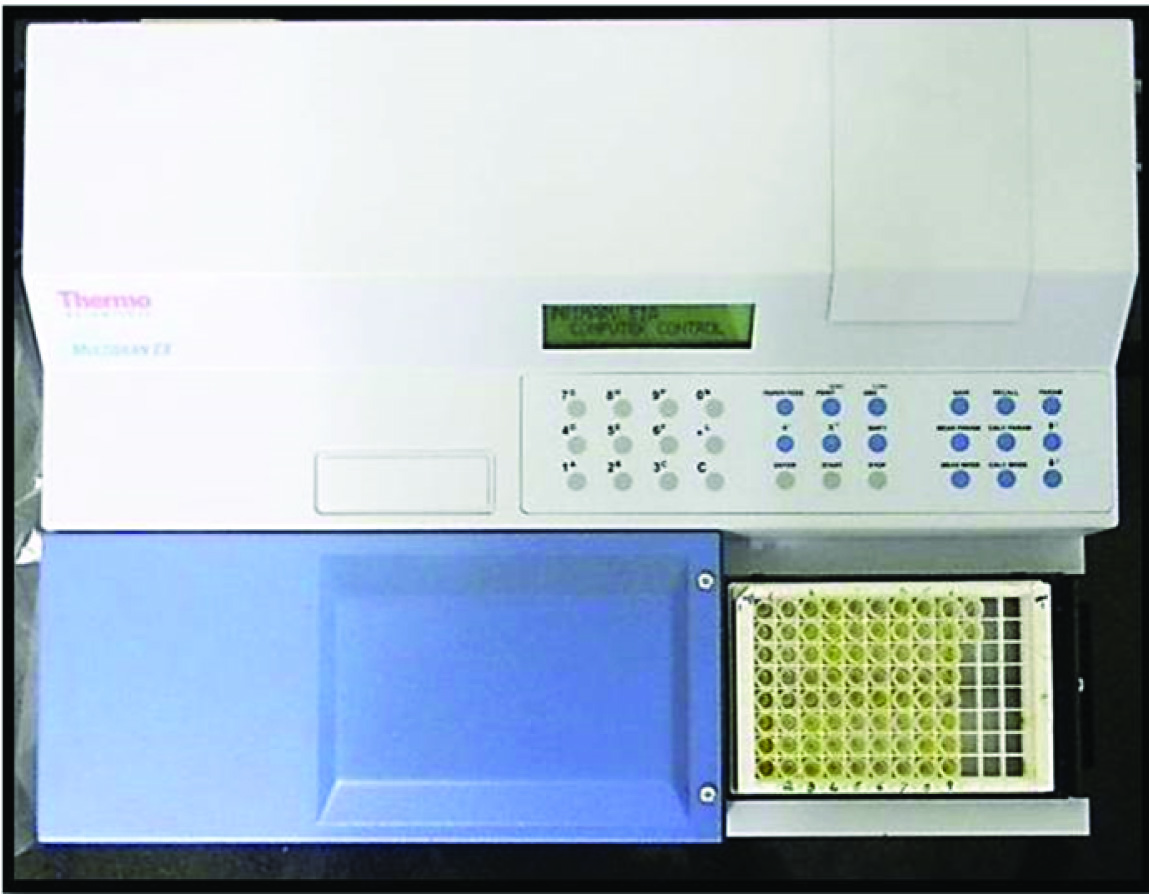
The concentration of leptin was determined using a human leptin solid phase enzyme linked immunosorbent assay (Orgenium Laboratories) [Table/Fig-2] as instructed by the manufacturer. This assay employed an antibody specific for human leptin coated on a 96-well plate. Standards, samples and biotinylated anti-human leptin were pipetted into the wells and leptin present in the sample was captured by the antibody immobilized to the wells and by the biotinylated leptin-specific detection antibody. After washing away unbound biotinylated antibody, HRP- conjugated streptavidin was pipetted to the wells. The wells were again washed. Following this second wash step, TMB substrate solution was added to the wells, resulting in colour development proportional to the amount of leptin bound. The Stop Solution changed the colour from blue to yellow, and the intensity of the colour was measured at 450 nm using the ELISA reader [Table/Fig-3].
Contents of Human Leptin kit (ELISA)
ELISA reader used to assess the leptin values
Statistical Analysis
One way ANOVA test was used to compare the mean BMI between study groups and to compare the mean Leptin (pg/mL) levels between the study groups. Independent t-test was used for pair wise comparison between the study groups. Pearson Correlation Coefficient test was used to compare GCF leptin concentration (pg/mL) with the clinical parameters: MGI & CAL. Kruskal-Wallis test was used to compare the mean Leptin (pg/mL) values between the BMI (kg/m2) groups in each study group.
Results
Descriptive statistics showing the gender distribution of the study groups is shown in [Table/Fig-4]. Out of the 60 subjects included in the study, 31 were males and 29 were females.
Descriptive statistics showing the gender distribution of the study groups
| Study Groups | Gender | Total |
|---|
| Male | Female |
|---|
| n | % | n | % | n | % |
|---|
| Group I | 11 | 55.0 | 9 | 45.0 | 20 | 100.0 |
| Group II | 8 | 40.0 | 12 | 60.0 | 20 | 100.0 |
| Group III | 12 | 60.0 | 8 | 40.0 | 20 | 100.0 |
| Total | 31 | 51.7 | 29 | 48.3 | 60 | 100.0 |
Descriptive statistics showing the mean ± SD and minimum and maximum of the age between study groups is shown in [Table/Fig-5]. The overall mean age and standard deviation of all 60 subjects was 39.0 ± 6.0.
Descriptive statistics showing the mean value, standard deviation (SD) and minimum and maximum of the age between study groups
| Study Groups | Age (yrs) |
|---|
| Count | Mean | Standard Deviation | Minimum | Maximum |
|---|
| Group I | 20 | 35.5 ± 4.6 | 30 | 45 |
| Group II | 20 | 36.0 ± 3.5 | 30 | 42 |
| Group III | 20 | 45.3 ± 3.9 | 37 | 50 |
| Total | 60 | 39.0 ± 6.0 | 30 | 50 |
One-way ANOVA test was used to compare the mean BMI between study groups which is shown in [Table/Fig-6]. The mean BMI values in Group I was 21.95 ± 1.76 kg/m2; in Group II was 22.02 ± 1.87 kg/m2, and in Group III was 22.76 ± 1.76 kg/m2. The ANOVA results show that all the mean BMI were similar (p=0.297). There was no statistically significant difference between mean BMI among study groups.
One-way ANOVA to compare the mean and standard deviation of Body Mass Index (BMI) (kg/m2) between study groups
| Study Groups | n | Mean BMI ± Standard Deviation | Minimum | Maximum | ANOVA f-value | p-value |
|---|
| Group I | 20 | 21.95 ± 1.76 | 19.20 | 24.70 | 1.241 | 0.297 |
| Group II | 20 | 22.02 ± 1.87 | 18.80 | 24.90 |
| Group III | 20 | 22.76 ± 1.76 | 19.80 | 24.70 |
| Total | 60 | 22.25 ± 1.80 | 18.80 | 24.90 |
One-way ANOVA was used to compare the mean leptin levels between the study groups which is shown in [Table/Fig-7]. It was observed that the maximum leptin level was found in Group I- Healthy Periodontium (2272.25 ± 215.76 pg/mL) followed by Group II- Gingivitis (1421.86 ± 180.11 pg/mL) and the minimum leptin level was found in Group III – Chronic Periodontitis (1160.67 ± 158.81 pg/mL). The difference between the groups was found to be statistically significant (p < 0.001).
One-way ANOVA to compare the mean GCF leptin levels (pg/mL) between the study groups
| Study Groups | n | Mean ± Standard Deviation | Minimum | Maximum | ANOVA f-value | p-value |
|---|
| Group I | 20 | 2272.25 ± 215.76 | 1995.32 | 2706.36 | 194.509 | <0.001 |
| Group II | 20 | 1421.86 ± 180.11 | 1097.58 | 1641.15 |
| Group III | 20 | 1160.67 ± 158.81 | 841.98 | 1346.65 |
Independent samples t-test was used to compare mean GCF leptin levels (pg/mL) between two study groups which is shown in [Table/Fig-8]. There was a statistically significant difference seen when the mean leptin level of Group I was compared to the mean leptin level of Group II and Group III and when Group II was compared to Group III. This showed a negative correlation between the gingival crevicular fluid leptin concentration and periodontal disease progression.
Independent samples t-test to compare mean GCF leptin levels (pg/mL) between two study groups
| Study Groups | t-Value | p-value |
|---|
| GROUP I vs GROUP II | 13.531 | <0.001 |
| GROUP I vs GROUP III | 18.556 | <0.001 |
| GROUP II vs GROUP III | 4.865 | <0.001 |
Pearson Correlation Coefficient test was used to compare GCF leptin concentration (pg/mL) with clinical parameters, MGI & CAL [Table/Fig-9]. In all groups, Leptin and MGI and with CAL were negatively correlated and not statistically significant.
Pearson Correlation Coefficient test comparing GCF leptin concentration (pg/mL) with MGI & CAL.
| Study Group | Leptin vs MGI (r) | Leptin vs CAL (r) | CAL vs MGI (r) |
|---|
| GROUP I | -.0.138 | - | - |
| GROUP II | -0.002 | - | - |
| GROUP III | -0.073 | 0.026 | 0.512* |
*Correlation is significant at the 0.05 level (2-tailed)
Kruskal-Wallis Test was used to compare the mean Leptin (pg/mL) values between the BMI (kg/m2) groups in each study group which is shown in [Table/Fig-10]. In the study group I, for the BMI (kg/m2) group of 18.5 to < 20.5, 20.5 to < 21.5 and 21.5 to < 22.5; the mean leptin levels (pg/mL) were 2342.9, 2246.4 and 2226.6 each; with a standard deviation of ± 216.7, ± 199.9 and ± 235.4, respectively.
Kruskal-Wallis Test to compare the mean GCF leptin values (pg/mL) between BMI (kg/m2) groups in each study group
| Study Group | BMI group | n | Mean Leptin ± Standard Deviation | Minimum | Maximum | Mean Rank | p-value |
|---|
| GROUP I | 18.5 to <20.5 | 7 | 2342.9 ± 216.7 | 1995.3 | 2601.1 | 11.71 | 0.769 |
| 20.5 to <21.5 | 5 | 2246.4 ± 199.9 | 2010.3 | 2451.8 | 10.40 |
| 21.5 to <22.5 | 8 | 2226.6 ± 235.4 | 1999.8 | 2706.4 | 9.50 |
| GROUP II | 18.5 to <20.5 | 10 | 1394.2 ± 125.5 | 1157.7 | 1514.6 | 9.10 | 0.551 |
| 20.5 to <21.5 | 5 | 1427.8 ± 256.7 | 1097.6 | 1641.0 | 11.40 |
| 21.5 to <22.5 | 5 | 1471.3 ± 218.5 | 1127.7 | 1641.2 | 12.40 |
| GROUP III | 18.5 to <20.5 | 9 | 1215.1 ± 119.3 | 1023.2 | 1346.7 | 12.56 | 0.268 |
| 20.5 to <21.5 | 5 | 1161.4 ± 190.7 | 842.0 | 1342.5 | 10.40 |
| 21.5 to <22.5 | 6 | 1078.6 ± 174.9 | 887.1 | 1296.5 | 7.50 |
In the study group II, for the BMI (kg/m2) group of 18.5 to <20.5, 20.5 to <21.5 and 21.5 to <22.5; the mean leptin levels (pg/mL) were 1394.2, 1427.8 and 1471.3 each; with a standard deviation of ± 125.5, ± 256.7 and ± 218.5, respectively.
In the study group III, for the BMI (kg/m2) group of 18.5 to <20.5, 20.5 to <21.5 and 21.5 to <22.5; the mean leptin levels (pg/mL) were 1215.1, 1161.4 and 1078.6 each; with a standard deviation of ± 119.3, ± 190.7 and ± 174.9, respectively. No statistically significant difference was found when comparing the mean values of leptin between BMI groups in each study group. Independent samples t-test was used to compare the mean leptin level between genders in each group which is shown in [Table/Fig-11]. There were no statistically significant differences seen in the mean leptin levels between genders in any of the groups.
Independent samples t-test comparing the mean leptin level between genders in each group
| Study Groups | Gender | N | Mean ± Std. Dev | Minimum | Maximum | t-value | p-value |
|---|
| Group I | Male | 11 | 2233.2 ± 189.7 | 1995.3 | 2601.1 | 0.889 | 0.386 |
| Female | 9 | 2319.9 ± 246.9 | 1999.8 | 2706.4 |
| Group II | Male | 8 | 1499.7 ± 133.1 | 1238.7 | 1641.1 | 1.647 | 0.117 |
| Female | 12 | 1370.0 ± 193.4 | 1097.6 | 1640.9 |
| Group III | Male | 12 | 1161.0 ± 158.6 | 842.0 | 1346.6 | 0.010 | 0.992 |
| Female | 8 | 1160.2 ± 170.0 | 887.1 | 1342.5 | |
Discussion
All periodontal diagnostic procedures should focus on providing essential data to the discerning clinician pertaining to the type of periodontal disease present, as well as its location and severity. These results form the cornerstone for the formulation of a holistic treatment plan and are a valuable tool during all phases of the treatment. The future of oral and periodontal disease diagnostic research is moving rapidly towards systems whereby periodontal risk can be predetermined as well as quantified using biomarkers.
The conventional diagnostic parameters used to quantify periodontal diseases clinically include – periodontal probing depth, bleeding on probing, clinical attachment level, radiographs assessing alveolar bone level as well as various indices such as the plaque index and modified gingival index [3]. These traditional parameters are advantageous in terms of their ease of use, low cost, and the fact that they are comparatively noninvasive when compared to other methods. However, conventional diagnostic procedures come with limitations, one of which is that only disease history and not the current disease status, can be assessed. For example, clinical attachment loss measurements both by probes and radiographic evaluation of the alveolar bone loss only reveal damage from past destructive episodes and only following a 2 to 3 mm change of value before the site can be pronounced as having experienced a “significant“ anatomic event [4].
The challenge for the biomarkers of the future lies in an earlier detection of disease progression and more effective measurements of therapy effectiveness. This will drastically improve the clinical aspect of patient management in such cases. A large number of host response factors have been identified in GCF including a cocktail of molecules from the host tissues and plaque biofilm which are not limited to but include – electrolytes, proteins, cytokines, antibodies, bacterial antigens, and enzymes [5].
Studies by Zhong et al., [6] and many others have shown that biomarkers of inflammatory response are elevated in people with periodontitis compared with healthy controls. These biomarkers include cytokines known to be produced locally in periodontal tissues {e.g. interleukin-1b (IL-1b)} as well as acute phase reactants that predominantly are produced in tissues remote from the infection {e.g. C-reactive protein (CRP), predominantly produced in liver}. Leptin is a 16 kDa circulating protein and polypeptide hormone which is derived from adipocytes and has been upgraded to the status of a cytokine in recent years. A popular theory put forward recently postulates that leptin manipulates the response of the host to the various inflammatory stimuli as it simultaneously increases cytokine production and phagocytosis by macrophages, inducing the production of human peripheral blood mononuclear cells and natural killer cells. Infection and inflammation increases the serum leptin levels thereby proving its significance in relation to the host’s immune response [1].
Leptin first made headlines in the 1950s as the spontaneous mutation that resulted in an extremely obese phenotype due to a combination of overeating and reduced energy expenditure [7]. The gene was christened ‘ob’ and the obese mice carrying the mutation were called ob/ob mice. It was originally identified as the gene defect responsible for the obesity syndrome in mice discovered by Zhang Y et al., [8]. Leptin orchestrates numerous activities such as control of the body weight, reproduction, immune function, angiogenesis, and its most crucial function which is, the regulation of inflammation [9]. For a long time now, leptin has been seen as the key link between fat mass, food intake, and energy expenditure. This link originally arose from animal research findings, but its application to describing human systems has since been challenged. Serum leptin can probably be considered as the best biological marker reflecting total body fat in both animals and humans. Janeckova R et al., [10] stated that leptin is not only linked to a series of endocrine factors, but also seems to be involved in mediating endocrine functions relating to the onset of puberty, insulin secretion, polycystic ovary syndrome, obesity, and cardiovascular diseases.
The fact that leptin can regulate bone mass was first suggested by Ducy P et al., [11] It is now an accepted theory that leptin can influence the metabolism of bone via a direct signalling from the brain, and though leptin’s action works toward reducing cancellous bone, the converse is true; it appears to increase cortical bone. Numerous theories have been put forward pertaining to the cortical-cancellous dichotomy, including a current theory suggesting that increased leptin levels in obese individuals may point to a mechanism for increasing bone size and hence bone resistance to deal with the increased body weight [12]. This is especially relevant when considering the relationship between periodontal disease and leptin levels. Johnson RB et al., [13] were the first to assess the leptin concentrations within healthy and diseased gingiva using solubilized gingival biopsies. Their results showed that leptin was negatively correlated with the adjacent probing depth and hypothesized that the gingiva could indeed be a source of circulating leptin in patients with periodontal diseases. After the discovery of leptin within healthy and inflamed gingiva was confirmed, further studies have since observed that the varying levels of leptin activity within the GCF may play an important role in the periodontal disease cascade. Karthikeyan BV et al., [14] reported that leptin levels decreased progressively in GCF but increased in serum as the periodontal disease progressed. However, further studies are needed to demystify this phenomenon.
GCF as an inflammatory exudate, responds to the current events within the periodontium and the state of the periodontal tissues that produce it. Leptin has only recently been identified in the GCF, but various other GCF components have already faithfully served as potential diagnostic or prognostic markers for the progression of periodontitis. Since the host response is a critical parameter in evaluating the pathogenesis and progression of periodontal disease, the risk of developing the disease is evaluated using various inflammatory mediators. Results from a pilot longitudinal study pointed to the idea that inflammatory mediator levels within GCF increase over time in periodontitis patients, both in sites with more bone loss as well as relatively stable sites without bone loss [15]. Collection of GCF using micropipettes appears to be the gold standard as it provides an undiluted sample of apparently ‘native’ GCF whose volume can be assessed accurately (Griffiths et al.,) [16].
The present biochemical study was aimed to evaluate and compare the GCF concentrations of leptin in periodontally healthy and diseased subjects with respect to Body Mass Index (BMI) among the study groups as well as to obtain an insight into leptin’s possible role in the initiation and progression of periodontal disease. 60 subjects; 31 males (51.7%) and 29 females (48.3%) between the ages of 30-50 y (Mean age of 39.0 ± 6) who reported to the Department of Periodontology at Meenakshi Ammal Dental College, Chennai, were recruited into the study. The subjects were divided into 3 groups; each group comprising of 20 subjects as Group I (Healthy periodontium), Group II (Gingivitis) and Group III (Chronic periodontitis).
Havel PJ et al.,[17] had stated that the concentrations of leptin are significantly higher in women than in men of the same BMI but that the exact cause of higher leptinemia in women remained unclear. Some studies had shown that the leptin levels varied significantly throughout the menstrual cycle [18]. In the present study, we accounted for this variation by evaluating the mean leptin levels (pg/mL) in the males and females [Table/Fig-11] separately although it was not found to be statistically significant in this study. Pregnant women had been excluded from the study because it has been demonstrated that serum leptin levels are higher in pregnant women than in puerperal women, possibly due to an excessive increase of leptin production from maternal adipose tissue that is stimulated by high concentrations of serum estradiol and leptin production from the placenta [19].
The clinical parameters recorded in this study were Modified Gingival Index (MGI), Clinical attachment level (CAL), and radiographic evidence of bone loss. The test comparing GCF leptin concentration (pg/mL) with MGI and CAL showed that in all the 3 groups, leptin and MGI were negatively correlated but the results were not statistically significant. In Group III, the correlation between leptin and CAL was not found to be statistically significant.
Considine RV et al., [20] stated that in most obese subjects, leptin levels are higher and correlate with the Body Mass Index (BMI) and the percentage of body fat. It is also known that leptin is expressed predominantly by adipocytes. Studies have demonstrated a close involvement of the adipokines, such as leptin, resistin and adiponectin in inflammatory processes. However, their role in periodontal inflammation is yet to be defined. Although this relationship needs further investigation, periodontists should counsel obese patients regarding the complications of their obesity to improve their periodontal status. Zimmermann et al., [21] had further evaluated the local and circulating levels of adipocytokines (resistin, adiponectin, leptin, tumor necrosis factor {TNF}-α, and interleukin {IL}-6) in individuals who were obese and individuals who were normal weight (NW) with chronic periodontitis (CP). Periodontitis mainly influenced the circulating levels of resistin and adiponectin, whereas both obesity and periodontitis affected the circulating levels of leptin in favor of proinflammation. In addition they discovered that obesity upregulated the local levels of TNF-α.
In accordance with the hallmark study done by Karthikeyan & Pradeep [1] to avoid leptin derived from obese subjects biasing the estimation of leptin concentration, those subjects were excluded from the study by selecting only subjects with a normal body mass index (18.5-22.9 kg/m2) according to the chart for the Asian population given by the World Health organization in 2002. In the present study, the one-way ANOVA comparing the mean BMI values between the study groups [Table/Fig-7] showed no statistically significant difference. This was similar to the results obtained from the study done by Karthikeyan & Pradeep [1]. To further correlate the BMI with leptin levels, the participants in each study group were subdivided into three groups based on their BMI (kg/m2) [Table/Fig-10] as follows: 18.5 to < 20.5; 20.5 to < 21.5; and 21.5 to < 22.5. Although the gingival crevicular fluid leptin levels increased as the body mass index increased in each group, the results were not found to be statistically significant. The BMI used in the present study is a universally accepted method for measuring adiposity that is cost effective and easy to carry out. One cautionary factor to be taken into account is that the BMI does not clearly distinguish between fat and lean body mass [22].
The results of the current study showed that the maximum leptin level was in Group I followed by Group II and the minimum leptin level was in Group III. The difference between the groups was found to be statistically significant (p < 0.001). The independent samples t-test [Table/Fig-8] also showed a statistical significance when the mean leptin level of Group I was compared to the mean leptin level of Group II and Group III and when Group II was compared to Group III. This showed a negative correlation between the gingival crevicular fluid leptin concentration and periodontal disease progression.
Barbier et al., [23] have reported increased plasma leptin levels corresponding with chronic inflammation while Nystrom et al., [24] have found no changes in the plasma leptin levels during inflammation. Torpy et al., [25] stated that during sepsis, a negative correlation between leptin concentration and patient survival was found, a similar state as seen within gingival tissues in periodontal disease progression. Studies reporting the leptin concentrations within gingiva carried out by Johnson and Serio [26], who studied the leptin concentrations within healthy and diseased gingiva using solubilized gingival biopsies; and Karthikeyan and Pradeep [1,14] who assessed the leptin levels within GCF as well as serum; showed results in concordance with our study. Increased leptin levels are generally observed during inflammation as a result of the stimulatory effect of lipopolysaccharide (LPS), and other cytokines such as tumour necrosis factor-α (TNF-α) and interleukin-1α (IL1-α) on leptin production by acting on adipocytes. However, during periodontal inflammation, there was no rise in the leptin concentration, probably as a result of the absence of the adipocytes within gingiva to increase the leptin concentration when acted upon by the cytokines. Since it is known that leptin is produced by the adipocytes; and gingiva contains no adipocytes, the very presence of leptin within the gingival crevicular fluid is a mystery [1].
The possible source of leptin in the GCF might be serum since GCF is considered to be a serum exudate; or the gingiva itself with leptin trapped within the microvasculature as well as from the resident T cells and osteoblasts. The higher concentration of GCF levels seen in periodontal health shows that it could be protective to the gingival tissues, as leptin also stimulates the immune system and enhances bone formation by acting directly on the osteoblasts. Johnson & Serio [26] also speculated that, during gingival inflammation, the concentration of leptin is decreased as a result of the expansion of the vascular network caused by the vascular endothelial growth factor, which might increase the net rate of leptin removal from the gingival tissues and may raise the serum leptin levels. Another hypothesis stated that it might also be the result of leptin being used up as a substrate during inflammation, or it might be an artifact [11].
Based on the findings by Karthikeyan & Pradeep [14], as perio-dontal disease progressed, there was a rise in the serum leptin concentration on an average; up to 12,082 pg/mL. The rise in serum leptin levels above 10,000 pg/mL is considered as a risk factor for cardiovascular disease [27]. Gundala et al., [28] assessed the concentration of serum leptin in periodontitis associated with acute myocardial infarction (AMI). A strong correlation of serum leptin concentration to BMI was observed in the AMI patient group, the generalized chronic periodontitis (GCP) patient group and the combined groups as well as an increase in serum leptin concentration when compared to the control groups. They concluded that the elevated serum leptin concentration was associated with increased BMI, GCP, and AMI and may serve as a risk marker for these conditions. Thus, it could be hypothesized that a rise in the serum leptin concentration due to periodontal disease could act as one of the risk factors for cardiovascular diseases; as it promotes atherosclerosis by enhancing platelet aggregation as well as induces calcification of arterial walls. However, longitudinal studies are required to confirm this possibility.
Studies have been done to show the effect of periodontal treatment on serum and GCF leptin levels. Shimada Y et al., [29] investigated the effects of non surgical periodontal treatment on the serum levels of leptin and other cytokines in patients with chronic periodontitis (CP). The serum leptin, adiponectin, tumor necrosis factor-alpha, interleukin (IL)-6, and C-reactive protein (CRP) levels were measured before and after non-surgical periodontal treatment. Periodontal treatment was effective in reducing serum leptin, IL-6, and CRP levels. The results suggested that leptin, IL-6, and CRP could be mediating factors that connect metabolic syndrome and periodontitis. Nonsurgical periodontal therapies were not found to be efficacious in maintaining stable reduction in the GCF leptin level.
Limitations
Limitations of the study includes the absence of an interventional therapy as well as a relatively small sample size. The usage of BMI to measure adiposity has a drawback in that, the correlation with body fat is imperfect as it does not discriminate between fat and lean body mass. This can be erroneous, because the relation between BMI and body fat is interdependent with factors such as age, sex, race-ethnicity, and fitness level. Furthermore, leptin levels are also dependant on a number of variables such as strenuous exercise, diet, sleep patterns and gender which were not adjusted for in this study.
Conclusion
Within the limitations of this study it can be postulated that leptin levels are inversely proportional to periodontal health, suggesting a protective role for leptin as well as its absence indicating a possible role in the initiation and progression of periodontal disease. Hence leptin can serve as a potential biomarker to not only detect the presence of active disease, but also shed some light on the future progression of the disease; as well as assess the effect of periodontal therapy. Additionally, since obese individuals have higher serum leptin levels, and presumably lower GCF leptin levels, although the underlying pathomechanistic mechanisms are not clear, periodontists can include the measurement of body mass index and waist circumference for periodontal risk assessment on a regular basis.
Further studies of the effects of plasma leptin levels on GCF leptin concentration need to be carried out. Prospective studies with a larger sample size as well as studies that assess the serum leptin concentrations simultaneously with the gingival leptin levels will help to shed more light on the exact role of leptin in the gingival tissues and its possible role in the initiation and progression of periodontal disease.
*Correlation is significant at the 0.05 level (2-tailed)