Tobacco use is major public health threats the world has ever faced. More than 60 chemicals in tobacco are known to cause cancer. Use of tobacco is highly addictive, because of nicotine. Over a time, smokers become physically and emotionally dependent on nicotine [1]. In India, 40% of the population older than age of 15 uses either smoking or chewing tobacco. Men use more smoking tobacco and women prefer smokeless or chewing tobacco. Cigarette smokers have two to five times more risk than that of non-smokers for developing oral cancer. The risk increases with rise in number of cigarettes smoked and duration of smoking [2].
Tobacco is known environmental factor to alter the chemical compositions of cells as well as the structure of deoxyribonucleic acid (DNA). Arrival of diagnosis at benign/precancerous stage can prevent the occurrence of oral cancer. Before reaching this stage, genetic and cellular changes have taken place sub-clinically. These changes cannot be diagnosed by the routine invasive technique of histopathological examination [3]. We need a non-invasive technique to identify cellular & DNA level change before the clinical manifestation.
Autofluorescence spectroscopy (AS) is an easily applicable tool for detecting the alteration in the chemical compositions of cells. This technique will be helpful to identify whether the tissue is normal, altered or diseased [4]. This technique is based on the principles of fluorescence. Normally, the oral mucosa has biomolecules called fluorophores. These fluorophores will fluoresce when they are excited in the ultra violet and visible spectral region.
DNA damage can be estimated by various methods such as micronucleus assay, comet assay, and challenge assay. These methods are done by using oral exfoliated epithelial cells (or) by using surrogate cells like leukocytes and lymphocytes. Among these assays, “COMET assay” or otherwise called “single cell gel electrophoresis (SCGE) is a sensitive and rapid technique for quantifying and analysing DNA damage in individual cells [5].
This method was originally developed by Ostling and Johansson in 1984. Later it was modified by Singh et al., in 1988. The cell with DNA damage appears in the form of “comet’ while undamaged cell appears as a halo [5]. The head is composed of intact DNA and the tail consists of damaged or broken pieces of DNA [6].
Smoking tobacco causes oxidative stress. This oxidation stress leads to cellular damage including DNA breaks [7]. The most widely used method for DNA damage assessment is the alkaline comet assay [8]. Comet assay is a biomarker to indicate the degree of DNA damage. If the DNA damage is detectable and quantifiable, it may contribute toward an easy and early detection and prediction system for oral cancer development and prognosis.
In this study, our aims were (a) to detect mucosal changes in normal and smokers by using AS, (b) to assess DNA damage in normal and smokers by using SCGE and (c) to substantiate the changes in the autofluorescence due to smoking with that of early DNA damage by comet assay.
Materials and Methods
The present prospective study was carried out at Centre for Advanced Studies (CAS) in Marine Biology, Annamalai University, Tamil Nadu, India in 2014. Twenty volunteers without the habit of tobacco use were selected as controls (Group I). Forty subjects with habit of smoking tobacco (Minimum 5 cigarettes per day) without any other habits were selected as study group (Group II). Age distribution in both the groups was between 25- to 35-year-old and all subjects were males.
The detail methodology was explained to individuals and written informed consent was obtained. Clearance certificate was obtained from Institutional Human Ethical Committee (IHEC) of Annamalai University. Individual with systemic conditions like diabetes mellitus, hypertension and clinically evident lesions like pre-malignancy and malignancy were excluded from the study.
AF Spectroscopy: The procedure of AF spectroscopy was explained to all the subjects. In vivo fluorescence spectra from both groups were obtained by using hand held fiber optic probe attached to Varian Cary Eclipse fluorescence spectrophotometer [Table/Fig-1]. Thoroughly disinfected fiber optic tip was placed in an arbitrary point of buccal mucosa which was formed by the intersection of the two imaginary lines, one at the occlusal plane and other line running down vertically in the upper second premolar-molar region [9].
Fluorescence spectrometer with optic probe
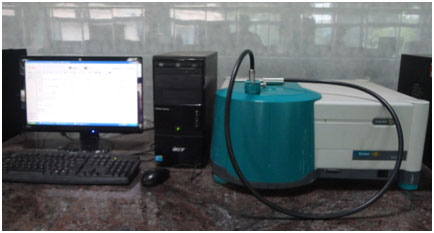
Specific wavelength of light required for the study was obtained by the computer guided programme. The tissue was excited at 320 nm to obtain the emission spectra and the emission wavelength was fixed at 390 nm to obtain the excitation spectra. The spectroscopic analysis was carried out for each subject.
Comet assay: Comet assay was carried out from all the two groups according to the procedure explained by Singh et al., [10]. 2 ml of peripheral blood was collected from each subject under aseptic conditions and was transformed into a sterile, EDTA containing disposable vial.
First, the lymphocytes were separated from other blood components by adding 2 ml of lymphocyte separating media (Ficoll Hisep, Himedia) and centrifuged at 1500 RPM for 30 min at room temperature. Hot 1% normal melting point agarose (NMPA) was layered on the agarose pre-coated slide and covered it with a cover slip and kept it 4oC for 5 min for solidification and then the cover slip removed.
After solidification of NMPA, add 200 μl of low melting point agarose (LMPA) was added and mixed with 5 -10 μl of cells analysed for DNA damage. Again, third agarose layer (200 μl of LMPA) was added to the slide and allows 5 - 10 min for solidification at 4oC. The slides were immersed in freshly prepared 1% Triton lysis buffer (pH10) for one hour and placed in the electrophoresis buffer (NaOH, pH>13) for 20 min for unwinding of the DNA.
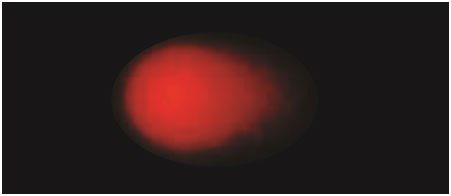
Later, the electrophoresis was performed in the same alkaline solutions for 30 min at 25 v. The slides were neutralized in Tris buffer for 5 min, twice dipped in deionized water and left to dry overnight. Fixation of slides was performed in methanol for 5 min. The slides were stained with ethidium bromide. Each slide was analysed using a fluorescent microscope and the tail length was measured by using image analyser software [Table/Fig-2,3].
Tail length in peripheral lymphocytes of normal healthy volunteer stained with ethidium bromide stain (X400)

Tail length in peripheral lymphocytes of smokers stained with ethidium bromide stain (X400)
Statistical Analysis
The individual scans of various wavelengths from each site of the patients were averaged and averaged emission and excitation spectrum was obtained. Normalization of each emission and excitation spectra of its maximum intensity was done. The ratio of intensities at two different wavelengths was computed for each scan. These wavelengths were selected where maximum spectral differences were noted. Using these ratio parameters, mean and standard deviation were calculated and independent-samples t-test was done. The same test was done for comet assay also by using IBM SPSS statistics version 20.
Results
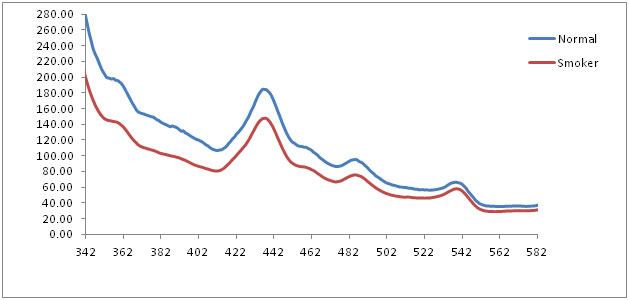
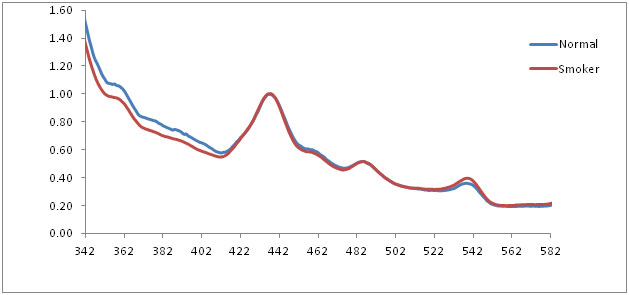
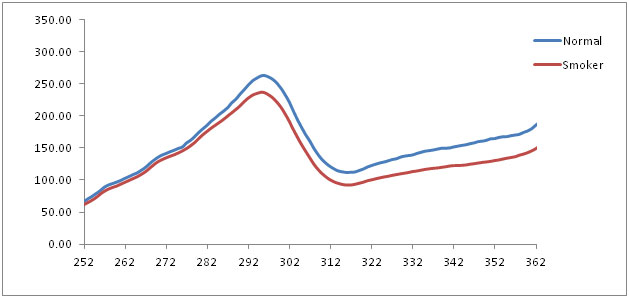
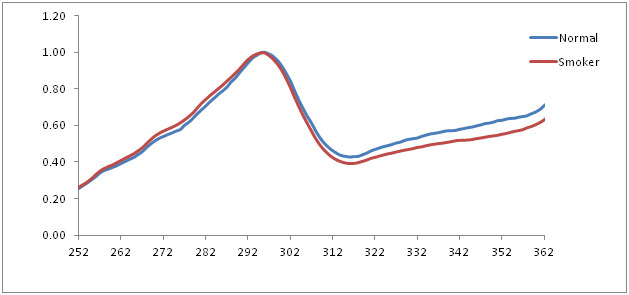
The average emission spectrum of the normal mucosa and smoker’s mucosa at 320 nm excitation showed three prominent peaks at 435 nm, 485 nm and 540 nm. The normalized emission spectra of normal mucosa, smoker’s mucosa also showed the similar findings at 320 nm excitation, which corresponds to structural protein collagen and nicotinamide adenine dinucleotide reduced form (NADH). In graph, wavelength represented in X axis and fluorescence intensity in Y axis [Table/Fig-4,5]. Statistical analysis of independent-samples t-test showed statistical significant (p< 0.05) between normal and smokers [Table/Fig-6].
Averaged fluorescence emission spectra of normal and smokers at 320 nm excitation
Normalized fluorescence emission spectra of normal and smokers at 320 nm excitation
Mean standard deviation and significant of normal and smokers group at 320 nm excitation
| Ratio | Groups | t-value | f-ratio | Significance |
|---|
| Normal (20) Mean ± S.D | Smoker (40) Maen ± S.D |
|---|
| 360/437 | 1.0570 ± 0.06 | 0.9613 ± 0.10 | 3.660 | 5.087 | 0.02 |
| 435/500 | 2.6330 ± 0.12 | 2.7335 ± 0.27 | -1.534 | 7.044 | 0.01 |
| 439/540 | 2.7345 ± 0.31 | 2.5145 ± 0.22 | 3.103 | 6.370 | 0.01 |
p< 0.05, S.D: Standard Deviation
The average excitation spectrum of the normal mucosa and smoker’s mucosa at 390 nm emission showed a prominent peak at 295 nm. The normalized emission spectra of normal mucosa, smoker’s mucosa also showed the similar findings at 390 nm emission which corresponds to tryptophan [Table/Fig-7,8]. Statistical analysis showed significant statistical differences (p < 0.05) between these two groups [Table/Fig-9].
Averaged fluorescence excitation spectra of normal and smokers at 390 nm emission
Normalized fluorescence emission spectra of normal and smokers at 390 nm emission
Mean standard deviation and significant of normal and smokers group at 390 nm emission.
| Ratio | Groups | t-value | f-ratio | Significance |
|---|
| Normal (20) Mean ± S.D | Smoker (40) Mean ± S.D |
|---|
| 275/295 | 0.5695 ± 0.02 | 0.6035 ± 0.03 | -3.524 | 5.452 | 0.02 |
p< 0.05, S.D: Standard Deviation
In COMET assay, the mean tail length (in μm) of normal group was 7.28 ± 2.46 and the mean tail length of smokers was 10.37 ± 1.76. Independent-Samples t-test was carried out. The results showed statistically significant differences (p ≤ 0.05) in between normals and smokers [Table/Fig-10].
Tail length of normal and smokers group by independent samples t-test
| Groups | t-value | f-ratio | Significance |
|---|
| Normal (20) Mean ± S.D | Smoker (40) Mean ± S.D |
|---|
| Tail length | 7.2850 ± 2.46 | 10.3725 ± 1.76 | -5.586 | 4.018 | 0.05 |
p< 0.05, S.D: Standard Deviation
Discussion
Despite the progress in diagnosis and therapy of oral squamous cell carcinoma (OSCC), the mortality and morbidity of these tumours are still high. Many endogenous and exogenous factors are responsible for the pathogenesis of OSCC. Among these, tobacco usage has gained the importance of endogenous risk in OSCC [11].
OSCC is a multistage process. The transformation of the oral mucosa from normal to malignancy occurs gradually. It would be prudent if the lesion is diagnosed at the early stages when there is subtle change or premalignant change [11]. Presently many techniques are available like Lugol’s iodine, toluidine blue and exfoliative cytology [12]. These techniques are useful only when the lesion manifests clinically.
AS and comet assay are available techniques to detect sub-clinical level cellular changes and DNA damages respectively. Autofluorescence is one such emerging technique which uses fluorophores that is normally present in the tissue. Some of the known fluorophores are tryptophan, structural protein, co-enzymes nicotinamide adenine dinucleotide reduced form (NADH), flavin adenine dinucleotide (FAD) and metabolic products like porphyrins [13].
When the normal epithelium turns into premalignancy or malignancy, the fluorescence properties of these fluorophores change. These biochemical change can be detected, which can further help in the diagnosis of premalignancy and early invasive cancer [13].
The fluorescence emission spectra of normal mucosa and smoker’s mucosa of 320 nm excitation showed prominent peaks at 435 nm, 485 nm and 540 nm. These peaks are attributed to structural protein collagen and co-enzyme NADH. Collagen is the main structural protein of the connective tissues and NADH is present in the mitochondria of the cells, acting as a co-enzyme in the citric acid cycle. But the intensity of smokers mucosa was reduced when compare with normal mucosa. As the oral epithelium of smokers and premalignant lesion becomes hyperplastic, the fluorescence from collagen may not reach completely to fibro optic probe because of deeper position. This may be the reason for the reduced intensity. At the same time, NADH is the co-enzyme, which is essential in cellular metabolism. When the metabolism is altered because of dysplastic changes in the cell, the intensity is reduced [14,15]. Statistical analysis showed statistical significant differences (p < 0.05) between normal and smokers.
The fluorescence excitation spectra of normal mucosa and smoker’s mucosa showed a prominent peak at 295 nm for 390 nm emission which corresponds to tryptophan and collagen. But the smoker’s mucosa showed decreased intensity because of thickness of the epithelium increases. Heat comes from smoking directly causes increase of epithelial thickness and the excitation beam fails to penetrate the sub-mucosal tissue. Statistical analysis showed p < 0.05which indicates statistical significant differences between normal and smokers.
The tobacco contains N-nitrosonornicotine, polycyclic aromatic hydrocarbons that act on the keratinocytes. They are metabolized by cytochrome P450 and glutathione S. transferase and the intermediate was produced within the nucleus. That intermediate binds with DNA by direct stimulation of heat of cigarette causing altered cell proliferation and DNA damage [16].
The neoplastic process is beginning with normal epithelium, progress through dysplasia to carcinoma. This will reflect as DNA damage which can occur as double-strand (ds) breaks or as single-strand (ss) breaks. The increased number of single or double strand breaks could either due to an increased incidence of breaks or decreased repair capacity of DNA damage or both [17].
Oxidative stress occurs when the amount of reactive oxygen species (ROS) generated in cells exceeds the capacity of normal detoxification systems. This stress will lead to DNA damage, particularly DNA breaks. Cigarette smoke contains molecules (e.g. benzopyrene) that acts as potent carcinogens and other ROS forming substances such as catechol or hydroquinone. These substances enhance free radical mediated reactions [18].
Various studies support the view of an increased oxidative stress in smokers. Smoking of five cigarettes per day gives more than doubles ss-DNA breaks. The ss-DNA breaks are repaired approximately within an hour, but smoking induced polymorphisms affect DNA repair ability [16–18].
This type of DNA damage can be estimated by three types of comet assays; 1) Alkaline comet assay: used in our study, 2) Neutral comet assay: Detection of single-strand DNA breaks, 3) Fluorescent in situ hybridization (FISH) comets: To identify DNA of a particular chromosome in the comet tail.
From the comet assay results, we observed that smokers have increased number of DNA breaks in their lymphocytes. The available literature substantiate that the smoking causes increased oxidative stress, which leads to DNA damage.
Both AS study and comet assay revealed that smokers had chemical changes in the smoking affected area and early DNA damage in circulating lymphocytes compare with healthy individuals. The DNA damage and chemical changes will be severe if the patient had benign/premalignant lesion clinically [18].
Conclusion
The autofluorescence spectroscopic study showed the characteristic feature of collagen, NADH & tryptophan which were the examples of native cellular fluorophore at excitation wavelength at 320 nm and emission wavelength of 390 nm. The comet assay revealed the DNA damage in smoker’s mucosa. Our attempt to substantiate the changes in the autofluorescence due to smoking with that of early DNA damage was successful and results were statistically significant. These techniques will be very useful for monitoring of very early changes of mucosa before clinical manifestation of the lesion in high risk smokers and thus prevents the occurrence of OSCC.
p< 0.05, S.D: Standard Deviation
p< 0.05, S.D: Standard Deviation
p< 0.05, S.D: Standard Deviation