The expression of steroid hormone receptors – oestrogen receptor (ER) and progesterone receptor (PR) – by breast carcinoma is associated with strong positive correlation with the latter’s response to hormonal therapy and overall prognosis [1]. Even without hormonal therapy, ER positive breast cancers have a better short-term prognosis than ER negative tumours [2]. Significance of PR expression is more uncertain. Its expression has a predictive value in assessing response to tamoxifen therapy in metastatic breast cancer [3]. Absence of PR expression in an ER-positive cancer (Luminal B type), makes the lesion more aggressive with greater genetic instability and increased mutations [4].
The predictive and prognostic value of receptor expression may be refined and improved if the assessment of receptors is semi-quantitative. Besides, American Society of Clinical Oncology/College of American Pathologists (ASCO/CAP) has recommended the use of image analysis for estimating the percentage of immunoreactive cells [5]. Following immunohistochemical demonstration of the receptor expression, they can be quantitated by several well established methods, both manual and automated. Some of the manual methods include H-score [6], immunoreactive Remmele score (IRS) [7] and the most popular Allred score [8]. One well-known automated method is “Immunoratio”, which is freely available online as basic or advanced protocols [9]. Whether the results of all the methods yield comparable values which can be used interchangeably is not yet clear. Shousha [10] suggested a conversion table to make H-score and Allred score more equivalent. But so far, the results of automated ‘Immunoratio’ have not been compared with those of the manual methods. In the present study, we have tried to find out if automated (Immunoratio) and manual methods (H score and Allred score) produce comparable values and whether they can be used interchangeably.
Materials and Methods
Sixteen samples of tumour tissue from established cases of carcinoma of breast were fixed in buffered formalin within 30 min of their removal from the body and were fixed for at least 6 h (up to 24 h) before processing further for paraffin embedding. Three micron paraffin sections were cut using Leica Microtomes 2125 and 2245. One section was stained with haematoxylin and eosin. Other two sections were taken on poly-L-Lysine coated slides and were used for immunohistochemical (IHC) demonstration of oestrogen receptor (ER) and progesterone receptor (PR) using Novocastra™ Lyophilized Mouse Monoclonal Antibodies: NCL-ER-6F11 for ER and NCL-PGR for PR. Antigen retrieval was done using “High Temperature Antigen Unmasking Technique for Immunohistochemical Demonstration on Paraffin Sections” recommended by Leica Microsystems [11].
Manual Scoring of ER and PR Immunostains
Manual semi-quantitative assessment of ER and PR Immunostains were done by 2 methods: McCarty’s “H” score and Allred score. We used two Image-J tools to do the manual counting: Cell Counter and Point Tool [Table/Fig-1].
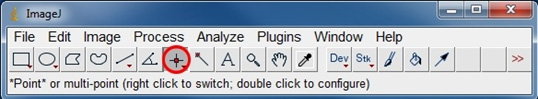
Screenshot of Point Tool, which is part of main menu of ImageJ (highlighted with red ring)
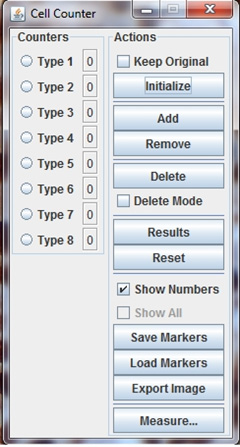
H-score (6): One hundred cells were counted sequentially and graded 0 to 3 depending on the intensity of staining (0 = negative; 1 = weak staining; 2 = moderate intensity; 3 = strong staining). The counting was done using “Cell Counter” plugin [Table/Fig-2] of morphometric software Image-J [12,13]. This plugin allows simultaneous categorisation and measurement. In conventional ‘H’ scoring (H-visual), the intensity was assessed visually. The final score was obtained by multiplying percentage of positive cells by the factor representing the intensity of staining (1 = weak; 2 = moderate; 3 = strong). As ‘0’ type is not available in Cell counter plugin, we used ‘4’ type as marker for ‘0’. The maximum score achievable is 300 [Table/Fig-3].
Screenshot of Cell Counter tool of Image-J
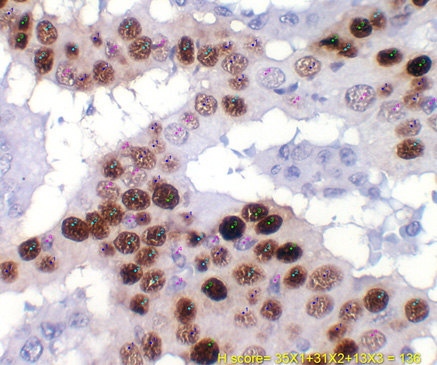
H score assessment using Cell Counter Tool.1=weak, 2=moderate, 3=strong, 4=negative. (H DAB, 400X)
In conventional “H” score, the intensity of staining is assessed visually and is susceptible to subjective variations. In order to make intensity assessments more objective, we measured Mean Grey Value (MGV) and Optical density (OD). With cell counter plugin, this was achieved by clicking the ‘Measure’ button after selecting mean grey value in ‘Set Measurements’ option in “Analysis” menu. Using the values obtained, H-MGV was calculated.
To measure MGV using Point tool in Image-J, it was configured with the following options selected: type – cross hair/circle; colour – red; size – extra-large; auto-measure – selected; overlay – selected; label points – selected. Auto-measure was set to measure the Mean Grey Value (MGV). The latter divided into quartiles (< 63.5, Strong; >63.5 – 127.5, moderate; >127.5- 191.5, weak positivity; >191.5-255, negative) was used as a measure of the intensity of staining.
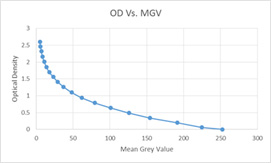
As MGV was measured from RGB images, the value obtained is likely to be affected by the presence of other colours in addition to that of immunoreaction product. In an attempt to improve the accuracy of intensity measurement, we measured the intensity as optical density(OD) again on colour deconvoluted images. Colour Deconvolution was done using Colour Deconvolution plugin [14] for Image-J and vector H DAB (hematoxylin and diaminobenzidine) was selected from the option to separate the colours. Analysis tool in Image-J was calibrated with Kodak Step-Tablet to measure optical density by Rodbard method [15] [Table/Fig-4]. After calibration, colour intensity was measured as optical density by cell counter plugin or point tool. The following OD ranges were used to grade the intensity of staining (<0.762, negative; >0.762-1.525, weak; >1.525-2.224, moderate; >2.224, strong). With values obtained, H-DC-OD was calculated.
Optical density calibration curve
Allred score (8): Allred score is obtained by adding up the proportion score and intensity score. The proportion score (0 to 5) was derived from the percentage of positive cells (0%= 0 ;<1% =1; 1 – 10% =2; 11-33%= 3; 34-66%=4; 67-100%=5).This was combined with visually assessed intensity score (0=negative; 1=weak; 2=moderate; 3=strong) to get the final Allred score (0- 8). The counting was done using “cell counter” plugin or Point tool.
Automated scoring of Immunostains Immunoratio [
16]
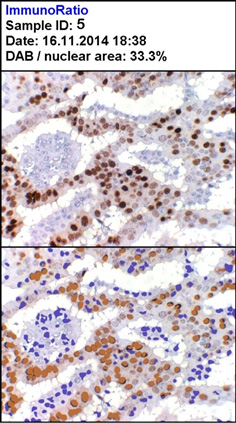
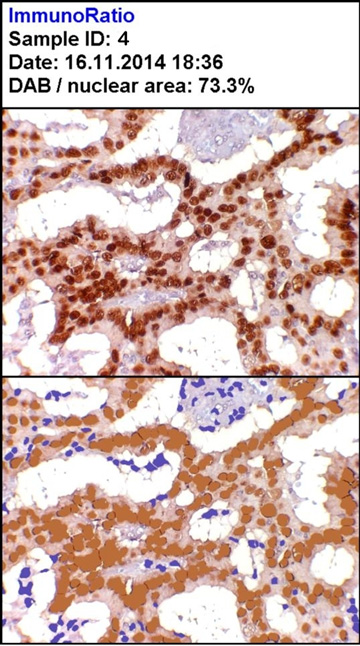
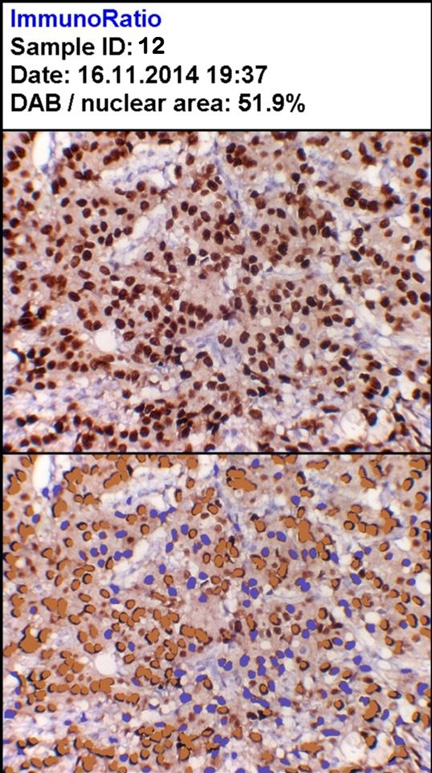
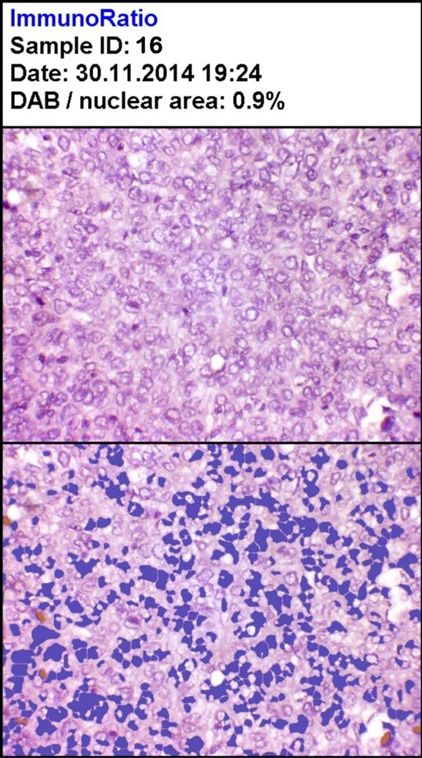
Immunoratio is freely available online image analysis tool based on Image-J. It involves colour separation by deconvolution, nuclear thresholding, particle segmentation and filtering, and calculation of ratio of DAB stained area to nuclear area [9]. Automated quantitative assessment of the immunostaining was done both by basic and advanced methods. The basic method does not allow user inputs/adjustments whereas advanced method allows background correction, image scale adjustment and colour threshold adjustment. The result is expressed as percentage positivity. The output is the montage of original IHC stain and the analysed image [Table/Fig-5,6,7,8]. The results of all the methods were compared and Pearson’s correlation coefficient was determined using SPSS statistical software package (version 21).
Result output of Advanced Immunoratio (H DAB, 100x)
Strong positivity for ER (H DAB, 100X)
Moderately strong positivity for ER (H DAB, 100X)
Negative reaction for ER (H DAB, 100X)
Results
The scores obtained by each method is summarised in [Table/Fig-9].
Summary of scores by various methods
| H score (0-300) | Immunoratio (%) | |
|---|
| Samples | Visual | MGV | DC-OD | Basic | Advanced | Allred (0-8) |
| 1 | 222 | 180 | 63 | 23.7 | 34.4 | 7 |
| 2 | 125 | 173 | 48 | 28.5 | 38.8 | 6 |
| 3 | 9 | 42 | 0 | 24.5 | 1.6 | 1 |
| 4 | 227 | 215 | 133 | 65.5 | 73.3 | 7 |
| 5 | 136 | 200 | 48 | 28.5 | 33.3 | 7 |
| 6 | 213 | 253 | 93 | 56.3 | 56.7 | 8 |
| 7 | 203 | 239 | 110 | 74.6 | 73.1 | 7 |
| 8 | 219 | 112 | 47 | 49.9 | 30.9 | 5 |
| 9 | 206 | 164 | 63 | 79.8 | 70.6 | 7 |
| 10 | 189 | 200 | 76 | 65.2 | 53.4 | 6 |
| 11 | 174 | 187 | 162 | 100 | 100 | 8 |
| 12 | 245 | 265 | 105 | 70.2 | 51.9 | 8 |
| 13 | 236 | 274 | 136 | 79.5 | 77.1 | 8 |
| 14 | 25 | 54 | 0 | 42.7 | 1.6 | 3 |
| 15 | 172 | 182 | 79 | 48.9 | 40.2 | 8 |
| 16 | 0 | 25 | 0 | 16.5 | 0.9 | 0 |
H-score was determined in three ways depending on the method employed to assess the intensity: Visual, mean grey value (MGV) and optical density (OD). Abbreviations: MGV =mean grey value; DC-OD= optical density on deconvoluted image;
There was variation in the H-scores depending on how the intensity of staining was assessed. Determination of intensity by visual or by MGV resulted in much higher scores than those obtained with OD. However, ‘H’ (MGV) appeared more sensitive and gave weakly positive signals even in cases which were negative by other methods (except IR-Basic).
Between the two automated Immunoratio protocols, basic method appeared overly sensitive in weakly staining and even non-staining samples giving much higher percentages of positivity compared to advanced method.
Pearson’s correlation matrix for all the methods used in the study is given in [Table/Fig-10]. There was statistically significant positive correlation among all the groups (p<0.02). However, there were subtle differences in the strength of correlation. Highest degree of correlation was observed between H-score (DC-OD) and Advanced immunoratio method (R=0.943; p= <0.001). The conventional H-score (visual) showed greater correlation with the other conventional manual method, Allred score than with other methods (R=0.88; p<0.001). Among all, basic immunoratio method showed the weakest correlation with the conventional manual methods, H-score & Allred score (R=0.612 & 0.625; p = 0.01).
Pearson Correlation between the scores
| | H (visual) | H (MGV) | H (DC-OD) | IR-Basic | IR-Advanced |
|---|
| H (MGV) | R | 0.859 | | | | |
| p-value | <0.001 | | | | |
| H (DC-OD | R | 0.774 | 0.825 | | | |
| p-value | <0.001 | <0.001 | | | |
| IR-Basic | R | 0.612 | 0.591 | 0.819 | | |
| p-value | 0.012 | 0.016 | <0.001 | | |
| IR-Advanced | R | 0.760 | 0.780 | 0.943 | 0.879 | |
| p-value | 0.001 | <0.001 | <0.001 | <0.001 | |
| Allred | R | 0.880 | 0.914 | 0.813 | 0.625 | 0.802 |
| p-value | <0.001 | <0.001 | <0.001 | 0.01 | <0.001 |
Abbreviations: MGV=mean grey value; DC-OP=optical density in deconvoluted image; IR= immunoratio; R= Pearson Correlation
Discussion
The role of determination of ER and PR expression in the predictive and prognostic assessments of breast carcinoma has long been established. More recently, the value of quantifying the receptor expression has been emphasised. This has led to introduction of several manual as well as automated methods for quantitating the receptor expression through image analysis. American Society of Clinical Oncology/College of American Pathologists (ASCO/CAP) has recommended the use of image analysis for estimating the percentage of immunoreactive cells [5]. At present, there are several well-established manual methods like H-score [6], IRS [7] and Allred score [8]. Immunoratio is the only free online automated image analysis tool for quantifying ER/PR [16]. It is also available as a plugin for Image-J (NIH) [17].
It is still uncertain whether the results obtained by these methods are comparable and can be interchangeably used. There has been only one attempt by Shousha [10] to make the two popular manual methods, H-score and Allred score, appear equivalent using a conversion table. So far, the manual methods and automated Immunoratio have not been compared. In the present study, we have tried to do just that. We have compared H-score and Allred score with basic and advanced protocols of automated Immunoratio. In addition, we used several modifications. In conventional manual methods, the staining intensity is assessed visually. This is susceptible to subjective variation. This may lead to inter-observer differences in the interpretation of results. To find out the extent to which the values may be affected, we made two pathologists to independently do manual H-score on all the slides. The results are given in [Table/Fig-10] (columns 2 and3).
Differences in the values between two observers varied from 0 to 82 (Sample 4 - 27%; average 33 or 11%). Similarly, if the same person did the score on a single sample repeatedly, we noticed similar variations unless the cells were marked each time and the same cells were counted. As ImmunoRatio is fully automated once it has been configured, there is no chance for interobserver variation [Table/Fig-11]. However, there can be variation between two separate runs of same samples. So, we ran the samples again after configuring it to the parameters of the original run. The differences between the two runs done more than a month apart were 0 to 2.4% (sample 9; average 0.1%). From these it appears that Immunoratio shows inter-run consistency and is reproducible. In addition, the sample 4 was run consecutively for 10 times over a period of two and half hours. Each time it returned the value of 74%. So, ImmunoRatio exhibits both reproducibility and repeatability much better than manual methods.
Inter-observer/ inter-run scores
| Manual ‘H’ Score | Immunoratio (advanced) (%) |
|---|
| 0 - 300 | MGV | First run | Second Run |
|---|
| Samples | 1st observer | 2nd Observer | Nov, 2014 | Jan, 2015 |
|---|
| 1 | 222 | 168 | 34.4 | 34.5 |
| 2 | 125 | 115 | 38.8 | 37.4 |
| 3 | 9 | 9 | 1.6 | 1.9 |
| 4 | 227 | 143 | 73.3 | 74 |
| 5 | 140 | 149 | 33.3 | 32.5 |
| 6 | 213 | 156 | 56.7 | 57.4 |
| 7 | 203 | 168 | 73.1 | 73.1 |
| 8 | 219 | 138 | 30.9 | 31.8 |
| 9 | 206 | 138 | 70.6 | 68.2 |
| 10 | 189 | 137 | 53.4 | 54.6 |
| 11 | 174 | 152 | 100 | 100 |
| 12 | 245 | 212 | 51.9 | 50.1 |
| 13 | 236 | 202 | 77.1 | 77.4 |
| 14 | 25 | 14 | 1.6 | 1.3 |
| 15 | 172 | 164 | 40.2 | 41.6 |
| 16 | 0 | 0 | 0.9 | 1 |
| Average | 162.81 | 129.06 | 46.11 | 46.05 |
In order to eliminate subjectivity and make the intensity assessment more objective, we used mean grey value (MGV) or optical density (OD) of the immunoreaction as indicators of intensity of staining. Of the two, determination of OD on a deconvoluted image appeared to have subtle advantages. It can be adjusted to detect truly negative reaction much better than the other methods by careful calibration and selection of appropriate cut-off points. We used ‘Cell counter’ plugin [12] of Image-J (NIH) [13]. We are not sure if this tool has been used for this purpose before as we could not find any documentation. This tool allows simultaneous counting, categorisation and measurement, and displays the result which can be saved in excel format for further statistical analysis.
In the present study, the scores obtained from all methods were comparable and showed significant positive correlation (R=0.591-0.943; p 0.02- <0.001) [Table/Fig-10]. Two manual methods (H-score & Allred score) in which the intensity was visually assessed, showed stronger correlation with each other than with other more automated methods. Immunoratio in its basic mode, which allows only one user input (selection of nuclear size), appeared a bit too sensitive to brown colour (colour of immunoreaction). It gave positive reaction even in cases that were negative by other methods. It also showed the weakest positive correlation with manual methods (R=0.612-0.625) even though it was statistically significant (p=0.02). Immunoratio appeared more reliable in advanced mode as it allows several user inputs including background correction, adjustment of brown and blue thresholds. To get the optimal result, we had to adjust the brown threshold to “-50” and blue threshold to “-10”. It showed strongest correlation with H (DC-OD) in which the intensity of staining was quantified by determining the OD of the reaction product (R=0.943;p=0.0001). It also showed better correlation with conventional manual methods than basic immunoratio.
The one question we need to answer is “is there a need for automated method if it is only as good as the manual method?” From our discussion above, it is fairly clear that automated method has the following advantages over manual methods:
ImmunoRatio samples the whole photograph (all the tumour tissue in it) unlike manual methods in which only 100 cells are counted and the value is extrapolated for the rest of the image. So, using manual methods may lead to erroneous results due to sampling error; the sampling error is less likely with ImmunoRatio;
It allows batch processing; since the measurement is automated, it allows for unattended result generation;
Unlike manual methods which are time consuming, each run of immunoratio takes only a couple of minutes;
It produces consistent, reproducible and repeatable results
It generates an informative pictorial montage asreport;
It is free and readily available on the web. For off-line use, Image-J plugin is available.
So, what are the drawbacks? Each user needs to configure the advanced ImmunoRatio before using it. Otherwise, the result may not be satisfactory. The quality of IHC staining and photography will also influence the quality of results.
Conclusion
In conclusion, quantitation of ER/PR expression by both manual (H-score and Allred score) and automated (basic and advanced Immunoratio) methods produced comparable results. There was statistically significant positive correlation among the various methods. Advanced Immunoratio appears to have a good correlation with the manual methods. But it needs to be carefully adjusted particularly with regard to brown and blue colour thresholds. Once it is properly tuned, it can produce results that are comparable to more established manual methods and appears to be a reliable and hassle free alternative to the time consuming manual methods. But basic immunoratio is less satisfactory. For manual counting and quantifying, Cell Counter plugin of Image-J (NIH) appears to be a very effective tool. Quantifying the intensity of immunoreaction is made more objective by OD determination on deconvoluted image.
H-score was determined in three ways depending on the method employed to assess the intensity: Visual, mean grey value (MGV) and optical density (OD). Abbreviations: MGV =mean grey value; DC-OD= optical density on deconvoluted image;
Abbreviations: MGV=mean grey value; DC-OP=optical density in deconvoluted image; IR= immunoratio; R= Pearson Correlation